Cities with the Highest Poverty Level Among Children Under the Age of 16 in North Dakota
RELATED REPORTS & OPTIONS
Highest Poverty | Child 0-16
North Dakota
Compare Cities
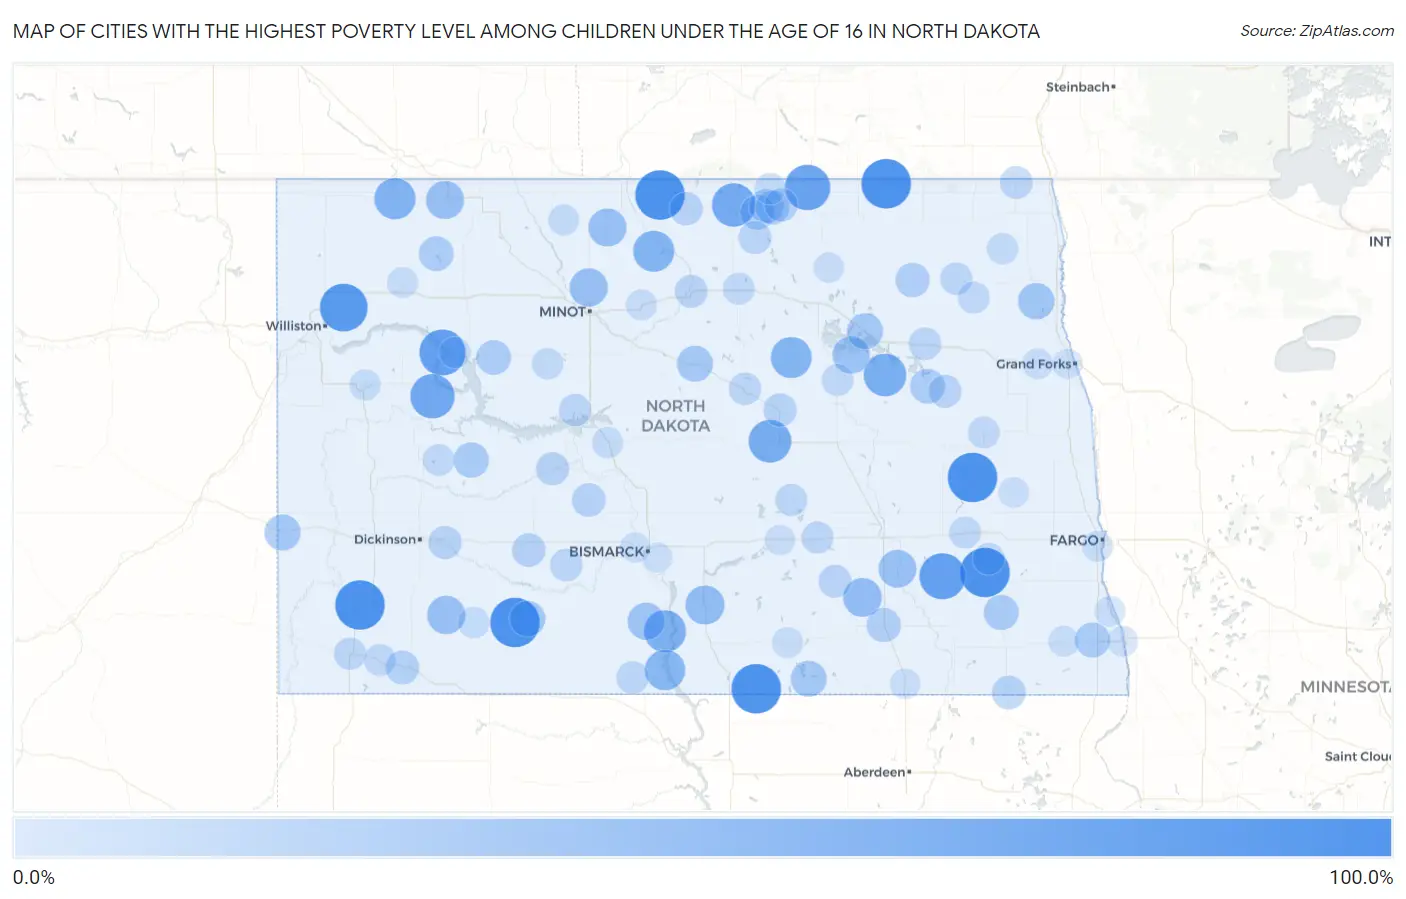
Map of Cities with the Highest Poverty Level Among Children Under the Age of 16 in North Dakota
0.0%
100.0%
Cities with the Highest Poverty Level Among Children Under the Age of 16 in North Dakota
| City | Child Poverty | vs State | vs National | |
| 1. | New Leipzig | 100.0% | 11.2%(+88.8)#1 | 16.9%(+83.1)#257 |
| 2. | Zeeland | 100.0% | 11.2%(+88.8)#2 | 16.9%(+83.1)#347 |
| 3. | Souris | 100.0% | 11.2%(+88.8)#3 | 16.9%(+83.1)#422 |
| 4. | Nome | 100.0% | 11.2%(+88.8)#4 | 16.9%(+83.1)#428 |
| 5. | Luverne | 100.0% | 11.2%(+88.8)#5 | 16.9%(+83.1)#469 |
| 6. | Amidon | 100.0% | 11.2%(+88.8)#6 | 16.9%(+83.1)#474 |
| 7. | Hannah | 100.0% | 11.2%(+88.8)#7 | 16.9%(+83.1)#494 |
| 8. | Springbrook | 91.7% | 11.2%(+80.4)#8 | 16.9%(+74.7)#552 |
| 9. | Four Bears Village | 84.4% | 11.2%(+73.2)#9 | 16.9%(+67.5)#725 |
| 10. | Litchville | 84.2% | 11.2%(+73.0)#10 | 16.9%(+67.3)#730 |
| 11. | Hansboro | 81.8% | 11.2%(+70.6)#11 | 16.9%(+64.9)#790 |
| 12. | Mandaree | 75.9% | 11.2%(+64.7)#12 | 16.9%(+59.0)#985 |
| 13. | East Dunseith | 72.4% | 11.2%(+61.1)#13 | 16.9%(+55.4)#1,130 |
| 14. | Bowdon | 69.0% | 11.2%(+57.7)#14 | 16.9%(+52.0)#1,303 |
| 15. | Warwick | 67.9% | 11.2%(+56.6)#15 | 16.9%(+50.9)#1,345 |
| 16. | Cannon Ball | 65.5% | 11.2%(+54.3)#16 | 16.9%(+48.6)#1,474 |
| 17. | Noonan | 61.9% | 11.2%(+50.7)#17 | 16.9%(+45.0)#1,709 |
| 18. | Upham | 61.2% | 11.2%(+50.0)#18 | 16.9%(+44.3)#1,760 |
| 19. | Maddock | 60.3% | 11.2%(+49.0)#19 | 16.9%(+43.3)#1,826 |
| 20. | Fort Yates | 58.3% | 11.2%(+47.1)#20 | 16.9%(+41.4)#1,992 |
| 21. | Hazelton | 52.4% | 11.2%(+41.1)#21 | 16.9%(+35.4)#2,514 |
| 22. | Jud | 50.0% | 11.2%(+38.8)#22 | 16.9%(+33.1)#2,823 |
| 23. | Regent | 48.1% | 11.2%(+36.9)#23 | 16.9%(+31.2)#3,000 |
| 24. | Ruthville | 47.9% | 11.2%(+36.7)#24 | 16.9%(+31.0)#3,031 |
| 25. | Lignite | 47.6% | 11.2%(+36.4)#25 | 16.9%(+30.7)#3,064 |
| 26. | Maxbass | 47.4% | 11.2%(+36.1)#26 | 16.9%(+30.4)#3,107 |
| 27. | Montpelier | 46.4% | 11.2%(+35.2)#27 | 16.9%(+29.5)#3,251 |
| 28. | Fort Totten | 44.6% | 11.2%(+33.3)#28 | 16.9%(+27.6)#3,539 |
| 29. | Solen | 43.8% | 11.2%(+32.5)#29 | 16.9%(+26.8)#3,648 |
| 30. | Minto | 40.2% | 11.2%(+28.9)#30 | 16.9%(+23.2)#4,276 |
| 31. | Beach | 38.5% | 11.2%(+27.3)#31 | 16.9%(+21.6)#4,598 |
| 32. | Devils Lake | 38.2% | 11.2%(+27.0)#32 | 16.9%(+21.3)#4,671 |
| 33. | Ashley | 38.2% | 11.2%(+26.9)#33 | 16.9%(+21.2)#4,685 |
| 34. | Drake | 37.9% | 11.2%(+26.6)#34 | 16.9%(+20.9)#4,733 |
| 35. | Elgin | 37.1% | 11.2%(+25.8)#35 | 16.9%(+20.1)#4,895 |
| 36. | Halliday | 35.1% | 11.2%(+23.8)#36 | 16.9%(+18.1)#5,335 |
| 37. | Lisbon | 34.2% | 11.2%(+22.9)#37 | 16.9%(+17.2)#5,544 |
| 38. | Mooreton | 34.0% | 11.2%(+22.8)#38 | 16.9%(+17.1)#5,575 |
| 39. | Pekin | 33.3% | 11.2%(+22.1)#39 | 16.9%(+16.4)#5,788 |
| 40. | Powers Lake | 32.8% | 11.2%(+21.6)#40 | 16.9%(+15.9)#5,886 |
| 41. | Parshall | 32.7% | 11.2%(+21.5)#41 | 16.9%(+15.8)#5,916 |
| 42. | Shell Valley | 31.5% | 11.2%(+20.2)#42 | 16.9%(+14.5)#6,246 |
| 43. | Edmore | 30.8% | 11.2%(+19.5)#43 | 16.9%(+13.8)#6,452 |
| 44. | Belcourt | 30.5% | 11.2%(+19.3)#44 | 16.9%(+13.6)#6,536 |
| 45. | Edgeley | 30.4% | 11.2%(+19.1)#45 | 16.9%(+13.4)#6,577 |
| 46. | Green Acres | 29.8% | 11.2%(+18.6)#46 | 16.9%(+12.9)#6,729 |
| 47. | Reeder | 28.6% | 11.2%(+17.3)#47 | 16.9%(+11.6)#7,109 |
| 48. | Center | 28.1% | 11.2%(+16.9)#48 | 16.9%(+11.2)#7,236 |
| 49. | Glen Ullin | 27.8% | 11.2%(+16.5)#49 | 16.9%(+10.8)#7,340 |
| 50. | Havana | 27.8% | 11.2%(+16.5)#50 | 16.9%(+10.8)#7,350 |
| 51. | Gladstone | 26.4% | 11.2%(+15.2)#51 | 16.9%(+9.48)#7,847 |
| 52. | Rolla | 26.2% | 11.2%(+15.0)#52 | 16.9%(+9.30)#7,910 |
| 53. | Fessenden | 26.1% | 11.2%(+14.8)#53 | 16.9%(+9.15)#7,959 |
| 54. | Bottineau | 26.0% | 11.2%(+14.8)#54 | 16.9%(+9.08)#7,983 |
| 55. | Hazen | 25.7% | 11.2%(+14.5)#55 | 16.9%(+8.79)#8,107 |
| 56. | Mcville | 25.0% | 11.2%(+13.8)#56 | 16.9%(+8.06)#8,348 |
| 57. | Towner | 24.8% | 11.2%(+13.6)#57 | 16.9%(+7.85)#8,441 |
| 58. | Rolette | 24.8% | 11.2%(+13.5)#58 | 16.9%(+7.84)#8,447 |
| 59. | Gackle | 24.4% | 11.2%(+13.1)#59 | 16.9%(+7.42)#8,585 |
| 60. | Neche | 23.6% | 11.2%(+12.3)#60 | 16.9%(+6.65)#8,846 |
| 61. | Almont | 23.5% | 11.2%(+12.3)#61 | 16.9%(+6.59)#8,872 |
| 62. | Lakota | 22.9% | 11.2%(+11.7)#62 | 16.9%(+5.97)#9,125 |
| 63. | Selfridge | 22.6% | 11.2%(+11.4)#63 | 16.9%(+5.70)#9,242 |
| 64. | Adams | 22.6% | 11.2%(+11.3)#64 | 16.9%(+5.64)#9,269 |
| 65. | Harvey | 22.5% | 11.2%(+11.3)#65 | 16.9%(+5.60)#9,283 |
| 66. | Pettibone | 22.2% | 11.2%(+11.0)#66 | 16.9%(+5.28)#9,426 |
| 67. | Garrison | 21.6% | 11.2%(+10.4)#67 | 16.9%(+4.70)#9,634 |
| 68. | Bowman | 21.3% | 11.2%(+10.0)#68 | 16.9%(+4.35)#9,801 |
| 69. | Medina | 20.9% | 11.2%(+9.69)#69 | 16.9%(+3.99)#9,949 |
| 70. | Scranton | 20.9% | 11.2%(+9.66)#70 | 16.9%(+3.96)#9,965 |
| 71. | Rugby | 20.4% | 11.2%(+9.17)#71 | 16.9%(+3.47)#10,186 |
| 72. | Valley City | 20.3% | 11.2%(+9.09)#72 | 16.9%(+3.39)#10,226 |
| 73. | Finley | 20.0% | 11.2%(+8.76)#73 | 16.9%(+3.06)#10,375 |
| 74. | Sheyenne | 20.0% | 11.2%(+8.76)#74 | 16.9%(+3.06)#10,383 |
| 75. | Fingal | 20.0% | 11.2%(+8.76)#75 | 16.9%(+3.06)#10,396 |
| 76. | Lankin | 20.0% | 11.2%(+8.76)#76 | 16.9%(+3.06)#10,401 |
| 77. | Dunn Center | 19.9% | 11.2%(+8.63)#77 | 16.9%(+2.93)#10,442 |
| 78. | Ryder | 18.2% | 11.2%(+6.94)#78 | 16.9%(+1.24)#11,256 |
| 79. | Crystal | 18.2% | 11.2%(+6.94)#79 | 16.9%(+1.24)#11,259 |
| 80. | Mott | 17.9% | 11.2%(+6.69)#80 | 16.9%(+0.985)#11,369 |
| 81. | New Town | 17.9% | 11.2%(+6.63)#81 | 16.9%(+0.926)#11,392 |
| 82. | Underwood | 17.7% | 11.2%(+6.46)#82 | 16.9%(+0.760)#11,470 |
| 83. | St John | 17.5% | 11.2%(+6.31)#83 | 16.9%(+0.605)#11,540 |
| 84. | Mohall | 16.9% | 11.2%(+5.71)#84 | 16.9%(+0.010)#11,839 |
| 85. | Watford City | 16.9% | 11.2%(+5.65)#85 | 16.9%(-0.049)#11,861 |
| 86. | Wishek | 16.2% | 11.2%(+4.94)#86 | 16.9%(-0.763)#12,223 |
| 87. | Granville | 16.1% | 11.2%(+4.89)#87 | 16.9%(-0.810)#12,259 |
| 88. | Tioga | 16.1% | 11.2%(+4.86)#88 | 16.9%(-0.842)#12,273 |
| 89. | Fargo | 15.8% | 11.2%(+4.61)#89 | 16.9%(-1.09)#12,411 |
| 90. | Wyndmere | 15.8% | 11.2%(+4.52)#90 | 16.9%(-1.19)#12,461 |
| 91. | Emerado | 14.9% | 11.2%(+3.67)#91 | 16.9%(-2.03)#12,906 |
| 92. | Wahpeton | 14.8% | 11.2%(+3.52)#92 | 16.9%(-2.18)#12,980 |
| 93. | Ellendale | 14.7% | 11.2%(+3.42)#93 | 16.9%(-2.28)#13,036 |
| 94. | Tappen | 14.3% | 11.2%(+3.05)#94 | 16.9%(-2.65)#13,234 |
| 95. | Page | 14.3% | 11.2%(+3.05)#95 | 16.9%(-2.65)#13,244 |
| 96. | Abercrombie | 14.1% | 11.2%(+2.85)#96 | 16.9%(-2.85)#13,341 |
| 97. | Cando | 14.0% | 11.2%(+2.76)#97 | 16.9%(-2.95)#13,401 |
| 98. | Mandan | 13.4% | 11.2%(+2.19)#98 | 16.9%(-3.51)#13,695 |
| 99. | Grand Forks | 13.4% | 11.2%(+2.13)#99 | 16.9%(-3.57)#13,719 |
| 100. | Lincoln | 12.9% | 11.2%(+1.69)#100 | 16.9%(-4.01)#13,953 |
Common Questions
What are the Top 10 Cities with the Highest Poverty Level Among Children Under the Age of 16 in North Dakota?
Top 10 Cities with the Highest Poverty Level Among Children Under the Age of 16 in North Dakota are:
#1
100.0%
#2
100.0%
#3
100.0%
#4
100.0%
#5
100.0%
#6
100.0%
#7
100.0%
#8
91.7%
#9
84.4%
#10
84.2%
What city has the Highest Poverty Level Among Children Under the Age of 16 in North Dakota?
New Leipzig has the Highest Poverty Level Among Children Under the Age of 16 in North Dakota with 100.0%.
What is the Poverty Level Among Children Under the Age of 16 in the State of North Dakota?
Poverty Level Among Children Under the Age of 16 in North Dakota is 11.2%.
What is the Poverty Level Among Children Under the Age of 16 in the United States?
Poverty Level Among Children Under the Age of 16 in the United States is 16.9%.