Cities with the Highest Poverty Level Among Children Under the Age of 16 in New Mexico
RELATED REPORTS & OPTIONS
Highest Poverty | Child 0-16
New Mexico
Compare Cities
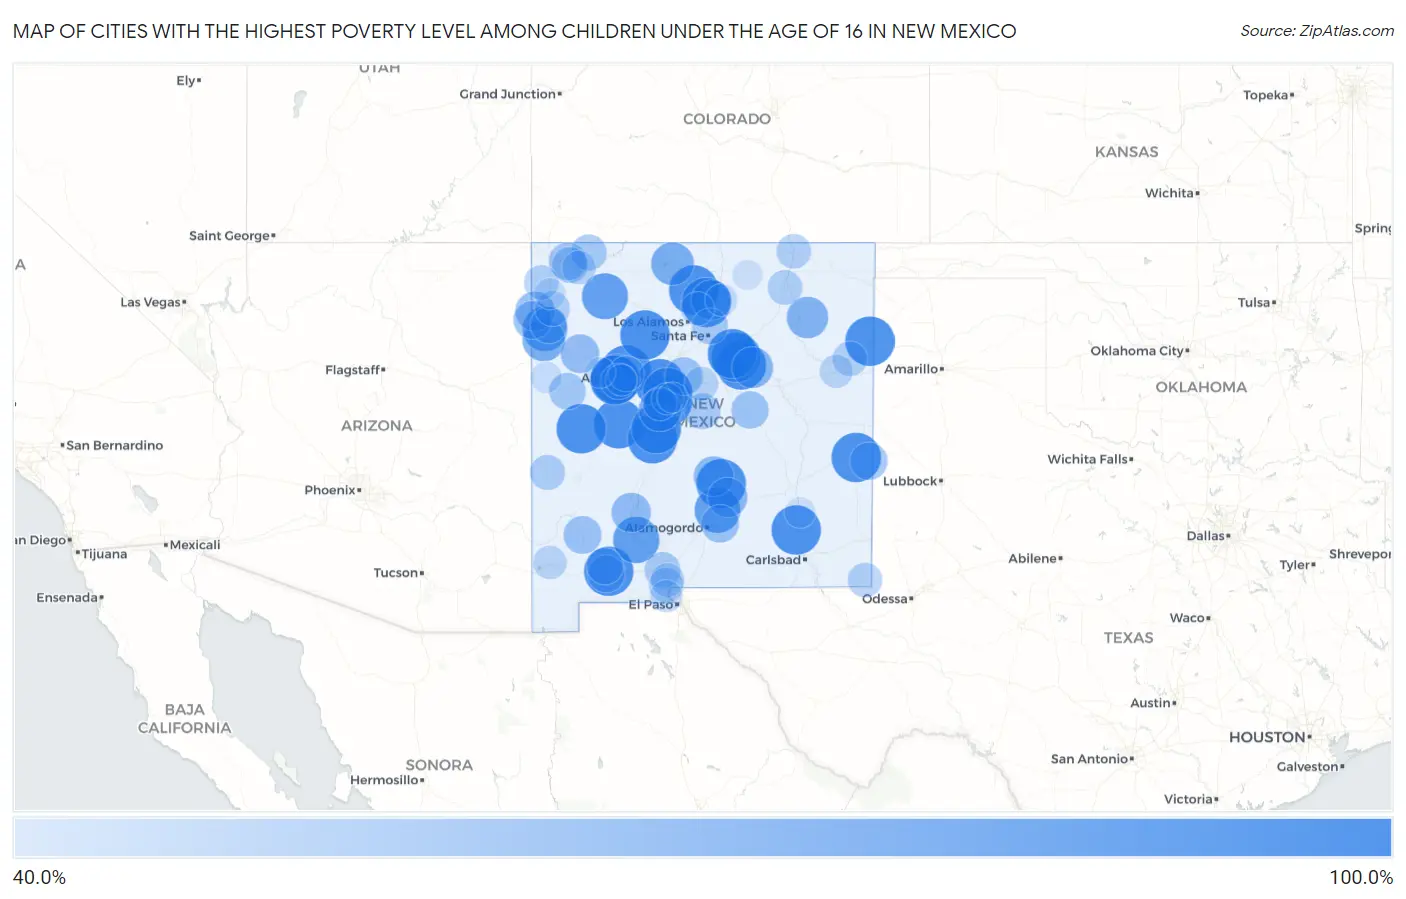
Map of Cities with the Highest Poverty Level Among Children Under the Age of 16 in New Mexico
0.0%
100.0%
Cities with the Highest Poverty Level Among Children Under the Age of 16 in New Mexico
| City | Child Poverty | vs State | vs National | |
| 1. | Alamo | 100.0% | 24.4%(+75.6)#1 | 16.9%(+83.1)#20 |
| 2. | El Rito | 100.0% | 24.4%(+75.6)#2 | 16.9%(+83.1)#32 |
| 3. | Ventura | 100.0% | 24.4%(+75.6)#3 | 16.9%(+83.1)#46 |
| 4. | Las Tusas | 100.0% | 24.4%(+75.6)#4 | 16.9%(+83.1)#53 |
| 5. | Monterey Park | 100.0% | 24.4%(+75.6)#5 | 16.9%(+83.1)#71 |
| 6. | Morningside | 100.0% | 24.4%(+75.6)#6 | 16.9%(+83.1)#74 |
| 7. | Polvadera | 100.0% | 24.4%(+75.6)#7 | 16.9%(+83.1)#75 |
| 8. | Seboyeta | 100.0% | 24.4%(+75.6)#8 | 16.9%(+83.1)#82 |
| 9. | Placitas Cdp Dona Ana County | 100.0% | 24.4%(+75.6)#9 | 16.9%(+83.1)#84 |
| 10. | Totah Vista | 100.0% | 24.4%(+75.6)#10 | 16.9%(+83.1)#94 |
| 11. | Villanueva | 100.0% | 24.4%(+75.6)#11 | 16.9%(+83.1)#101 |
| 12. | Homer C Jones | 100.0% | 24.4%(+75.6)#12 | 16.9%(+83.1)#123 |
| 13. | Lybrook | 100.0% | 24.4%(+75.6)#13 | 16.9%(+83.1)#125 |
| 14. | Ribera | 100.0% | 24.4%(+75.6)#14 | 16.9%(+83.1)#126 |
| 15. | Sagar | 100.0% | 24.4%(+75.6)#15 | 16.9%(+83.1)#133 |
| 16. | Velarde | 100.0% | 24.4%(+75.6)#16 | 16.9%(+83.1)#156 |
| 17. | Soham | 100.0% | 24.4%(+75.6)#17 | 16.9%(+83.1)#181 |
| 18. | Jamestown | 100.0% | 24.4%(+75.6)#19 | 16.9%(+83.1)#191 |
| 19. | North Acomita Village | 100.0% | 24.4%(+75.6)#20 | 16.9%(+83.1)#192 |
| 20. | Pajarito Mesa | 100.0% | 24.4%(+75.6)#21 | 16.9%(+83.1)#197 |
| 21. | Chical | 100.0% | 24.4%(+75.6)#22 | 16.9%(+83.1)#207 |
| 22. | Pie Town | 100.0% | 24.4%(+75.6)#23 | 16.9%(+83.1)#240 |
| 23. | San Luis | 100.0% | 24.4%(+75.6)#24 | 16.9%(+83.1)#247 |
| 24. | Nara Visa | 100.0% | 24.4%(+75.6)#25 | 16.9%(+83.1)#274 |
| 25. | La Joya | 100.0% | 24.4%(+75.6)#26 | 16.9%(+83.1)#279 |
| 26. | South Acomita Village | 100.0% | 24.4%(+75.6)#27 | 16.9%(+83.1)#301 |
| 27. | Nogal | 100.0% | 24.4%(+75.6)#28 | 16.9%(+83.1)#334 |
| 28. | Dora | 100.0% | 24.4%(+75.6)#29 | 16.9%(+83.1)#404 |
| 29. | Manuelito | 100.0% | 24.4%(+75.6)#30 | 16.9%(+83.1)#452 |
| 30. | Salem | 90.5% | 24.4%(+66.1)#31 | 16.9%(+73.6)#568 |
| 31. | Nageezi | 90.3% | 24.4%(+65.9)#32 | 16.9%(+73.3)#573 |
| 32. | Mescalero | 89.3% | 24.4%(+64.9)#33 | 16.9%(+72.3)#591 |
| 33. | Borrego Pass | 88.5% | 24.4%(+64.0)#34 | 16.9%(+71.5)#615 |
| 34. | Pinedale | 86.8% | 24.4%(+62.4)#35 | 16.9%(+69.9)#657 |
| 35. | Nakaibito | 86.2% | 24.4%(+61.8)#36 | 16.9%(+69.3)#678 |
| 36. | Becenti | 85.7% | 24.4%(+61.3)#37 | 16.9%(+68.8)#686 |
| 37. | Dona Ana | 85.5% | 24.4%(+61.1)#38 | 16.9%(+68.5)#695 |
| 38. | Ojo Encino | 83.3% | 24.4%(+58.9)#39 | 16.9%(+66.4)#751 |
| 39. | Prewitt | 83.2% | 24.4%(+58.8)#40 | 16.9%(+66.3)#760 |
| 40. | Tierra Amarilla | 80.7% | 24.4%(+56.3)#41 | 16.9%(+63.8)#819 |
| 41. | Pueblitos | 80.5% | 24.4%(+56.1)#42 | 16.9%(+63.5)#827 |
| 42. | Haystack | 80.4% | 24.4%(+56.0)#43 | 16.9%(+63.5)#831 |
| 43. | Rock Springs | 79.8% | 24.4%(+55.4)#44 | 16.9%(+62.8)#850 |
| 44. | Crestview | 77.8% | 24.4%(+53.4)#45 | 16.9%(+60.8)#904 |
| 45. | Roy | 76.9% | 24.4%(+52.5)#46 | 16.9%(+60.0)#948 |
| 46. | Tecolotito | 75.7% | 24.4%(+51.3)#47 | 16.9%(+58.8)#994 |
| 47. | Carrizozo | 72.5% | 24.4%(+48.0)#48 | 16.9%(+55.5)#1,123 |
| 48. | Dixon | 72.4% | 24.4%(+48.0)#49 | 16.9%(+55.5)#1,126 |
| 49. | Tortugas | 71.9% | 24.4%(+47.5)#50 | 16.9%(+55.0)#1,147 |
| 50. | Ruidoso Downs | 71.7% | 24.4%(+47.3)#51 | 16.9%(+54.8)#1,155 |
| 51. | Williamsburg | 71.2% | 24.4%(+46.7)#52 | 16.9%(+54.2)#1,191 |
| 52. | Crystal | 70.8% | 24.4%(+46.4)#53 | 16.9%(+53.9)#1,205 |
| 53. | Thoreau | 68.7% | 24.4%(+44.2)#54 | 16.9%(+51.7)#1,316 |
| 54. | Navajo | 67.1% | 24.4%(+42.7)#55 | 16.9%(+50.2)#1,383 |
| 55. | Santa Clara | 66.7% | 24.4%(+42.2)#56 | 16.9%(+49.7)#1,390 |
| 56. | Cedar Crest | 66.7% | 24.4%(+42.2)#57 | 16.9%(+49.7)#1,391 |
| 57. | Cloudcroft | 66.4% | 24.4%(+42.0)#58 | 16.9%(+49.5)#1,424 |
| 58. | Causey | 65.7% | 24.4%(+41.3)#59 | 16.9%(+48.8)#1,464 |
| 59. | Vaughn | 65.2% | 24.4%(+40.8)#60 | 16.9%(+48.3)#1,494 |
| 60. | Nenahnezad | 64.8% | 24.4%(+40.4)#61 | 16.9%(+47.9)#1,512 |
| 61. | La Hacienda | 64.8% | 24.4%(+40.3)#62 | 16.9%(+47.8)#1,514 |
| 62. | Gamerco | 63.3% | 24.4%(+38.9)#63 | 16.9%(+46.3)#1,618 |
| 63. | Pinehill | 63.2% | 24.4%(+38.8)#64 | 16.9%(+46.3)#1,622 |
| 64. | Tohatchi | 62.9% | 24.4%(+38.5)#65 | 16.9%(+45.9)#1,643 |
| 65. | Keeler Farm | 62.6% | 24.4%(+38.1)#66 | 16.9%(+45.6)#1,661 |
| 66. | North Light Plant | 61.6% | 24.4%(+37.2)#67 | 16.9%(+44.7)#1,729 |
| 67. | Chupadero | 61.5% | 24.4%(+37.1)#68 | 16.9%(+44.6)#1,740 |
| 68. | University Park | 61.2% | 24.4%(+36.8)#69 | 16.9%(+44.3)#1,761 |
| 69. | Ojo Amarillo | 61.1% | 24.4%(+36.7)#70 | 16.9%(+44.2)#1,766 |
| 70. | Seama | 61.1% | 24.4%(+36.7)#71 | 16.9%(+44.2)#1,767 |
| 71. | Willard | 60.9% | 24.4%(+36.5)#72 | 16.9%(+43.9)#1,779 |
| 72. | Paguate | 59.5% | 24.4%(+35.1)#73 | 16.9%(+42.6)#1,901 |
| 73. | Reserve | 58.8% | 24.4%(+34.4)#74 | 16.9%(+41.9)#1,949 |
| 74. | Naschitti | 58.0% | 24.4%(+33.6)#75 | 16.9%(+41.1)#2,020 |
| 75. | Springer | 57.7% | 24.4%(+33.3)#76 | 16.9%(+40.8)#2,043 |
| 76. | Chamberino | 57.6% | 24.4%(+33.2)#77 | 16.9%(+40.6)#2,052 |
| 77. | Logan | 57.5% | 24.4%(+33.1)#78 | 16.9%(+40.6)#2,058 |
| 78. | Raton | 57.5% | 24.4%(+33.1)#79 | 16.9%(+40.5)#2,061 |
| 79. | Sanostee | 57.1% | 24.4%(+32.7)#80 | 16.9%(+40.2)#2,092 |
| 80. | Jal | 57.0% | 24.4%(+32.6)#81 | 16.9%(+40.1)#2,109 |
| 81. | Napi Headquarters | 55.3% | 24.4%(+30.9)#82 | 16.9%(+38.3)#2,240 |
| 82. | Moriarty | 55.3% | 24.4%(+30.9)#83 | 16.9%(+38.3)#2,242 |
| 83. | Vado | 54.7% | 24.4%(+30.2)#84 | 16.9%(+37.7)#2,301 |
| 84. | El Duende | 54.6% | 24.4%(+30.2)#85 | 16.9%(+37.7)#2,302 |
| 85. | Glen Acres | 54.3% | 24.4%(+29.9)#86 | 16.9%(+37.4)#2,342 |
| 86. | Tucumcari | 53.7% | 24.4%(+29.3)#87 | 16.9%(+36.7)#2,397 |
| 87. | Belen | 53.2% | 24.4%(+28.8)#88 | 16.9%(+36.3)#2,430 |
| 88. | Santa Teresa | 51.1% | 24.4%(+26.6)#89 | 16.9%(+34.1)#2,660 |
| 89. | Angustura | 50.6% | 24.4%(+26.2)#90 | 16.9%(+33.6)#2,706 |
| 90. | Picuris Pueblo | 50.0% | 24.4%(+25.6)#91 | 16.9%(+33.1)#2,817 |
| 91. | El Cerro Mission | 48.9% | 24.4%(+24.4)#92 | 16.9%(+31.9)#2,925 |
| 92. | San Jose Cdp Rio Arriba County | 48.7% | 24.4%(+24.3)#93 | 16.9%(+31.8)#2,934 |
| 93. | Sundance | 48.1% | 24.4%(+23.7)#94 | 16.9%(+31.2)#3,004 |
| 94. | Black Rock | 48.0% | 24.4%(+23.6)#95 | 16.9%(+31.1)#3,012 |
| 95. | Paraje | 48.0% | 24.4%(+23.5)#96 | 16.9%(+31.0)#3,024 |
| 96. | Newcomb | 47.8% | 24.4%(+23.4)#97 | 16.9%(+30.9)#3,042 |
| 97. | Hagerman | 46.5% | 24.4%(+22.1)#98 | 16.9%(+29.5)#3,237 |
| 98. | Grants | 46.3% | 24.4%(+21.9)#99 | 16.9%(+29.3)#3,275 |
| 99. | Meadow Lake | 45.4% | 24.4%(+21.0)#100 | 16.9%(+28.5)#3,417 |
| 100. | Eagle Nest | 45.3% | 24.4%(+20.9)#101 | 16.9%(+28.3)#3,432 |
Common Questions
What are the Top 10 Cities with the Highest Poverty Level Among Children Under the Age of 16 in New Mexico?
Top 10 Cities with the Highest Poverty Level Among Children Under the Age of 16 in New Mexico are:
#1
100.0%
#2
100.0%
#3
100.0%
#4
100.0%
#5
100.0%
#6
100.0%
#7
100.0%
#8
100.0%
#9
100.0%
#10
100.0%
What city has the Highest Poverty Level Among Children Under the Age of 16 in New Mexico?
Alamo has the Highest Poverty Level Among Children Under the Age of 16 in New Mexico with 100.0%.
What is the Poverty Level Among Children Under the Age of 16 in the State of New Mexico?
Poverty Level Among Children Under the Age of 16 in New Mexico is 24.4%.
What is the Poverty Level Among Children Under the Age of 16 in the United States?
Poverty Level Among Children Under the Age of 16 in the United States is 16.9%.