Cities with the Highest Poverty Level Among Children Under the Age of 16 in Pennsylvania
RELATED REPORTS & OPTIONS
Highest Poverty | Child 0-16
Pennsylvania
Compare Cities
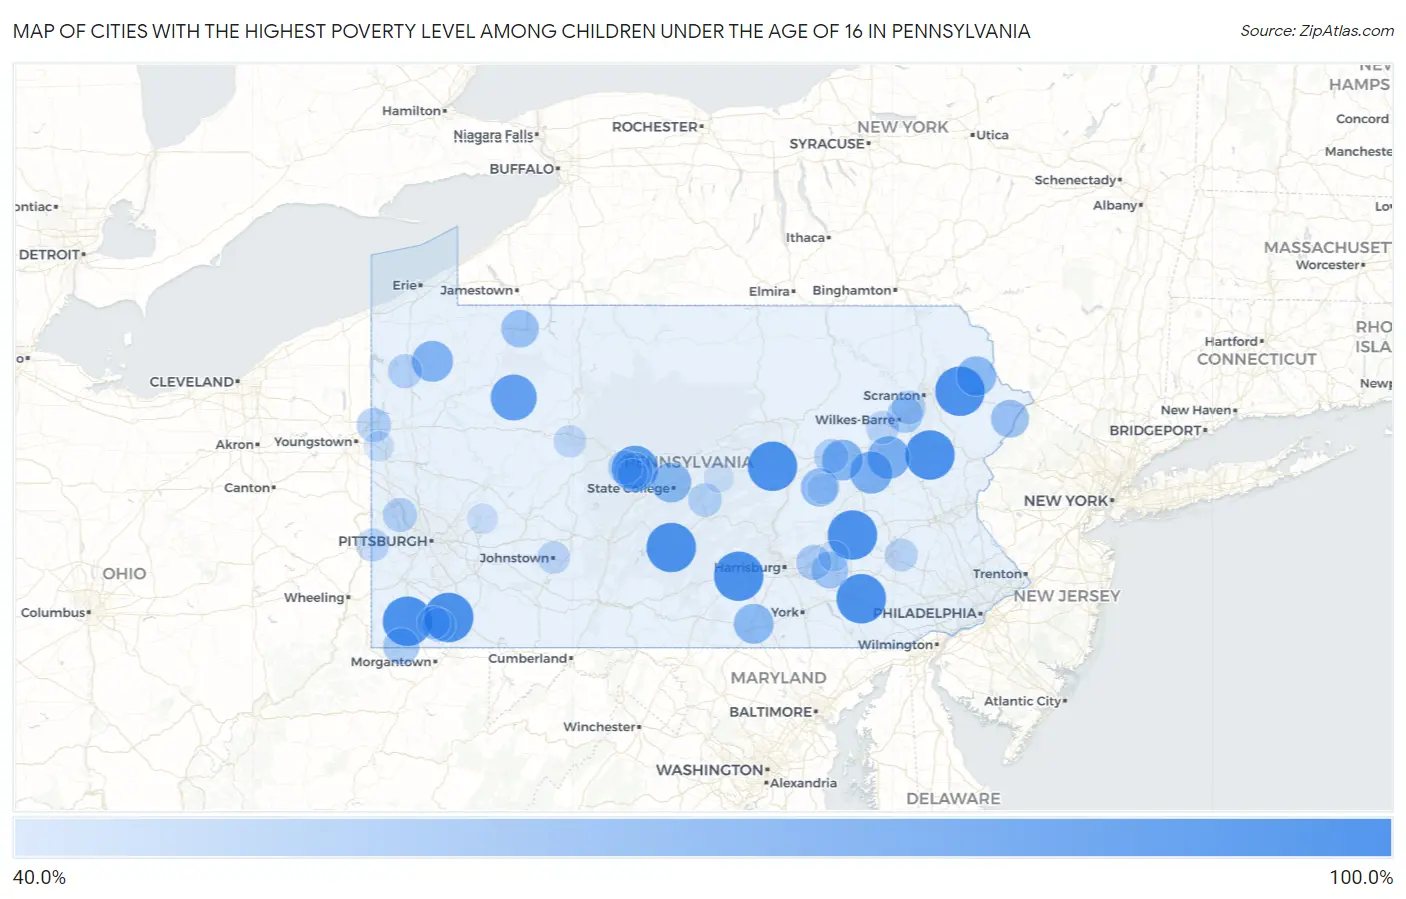
Map of Cities with the Highest Poverty Level Among Children Under the Age of 16 in Pennsylvania
0.0%
100.0%
Cities with the Highest Poverty Level Among Children Under the Age of 16 in Pennsylvania
| City | Child Poverty | vs State | vs National | |
| 1. | The Hideout | 100.0% | 16.5%(+83.5)#1 | 16.9%(+83.1)#4 |
| 2. | West Waynesburg | 100.0% | 16.5%(+83.5)#2 | 16.9%(+83.1)#95 |
| 3. | Bethel | 100.0% | 16.5%(+83.5)#3 | 16.9%(+83.1)#136 |
| 4. | East Altoona | 100.0% | 16.5%(+83.5)#4 | 16.9%(+83.1)#140 |
| 5. | Aaronsburg Cdp Washington County | 100.0% | 16.5%(+83.5)#5 | 16.9%(+83.1)#151 |
| 6. | Mckee | 100.0% | 16.5%(+83.5)#6 | 16.9%(+83.1)#176 |
| 7. | Witmer | 100.0% | 16.5%(+83.5)#7 | 16.9%(+83.1)#178 |
| 8. | Plainfield | 100.0% | 16.5%(+83.5)#8 | 16.9%(+83.1)#182 |
| 9. | Cove Forge | 100.0% | 16.5%(+83.5)#9 | 16.9%(+83.1)#199 |
| 10. | Albrightsville | 100.0% | 16.5%(+83.5)#10 | 16.9%(+83.1)#224 |
| 11. | Charlottsville | 100.0% | 16.5%(+83.5)#11 | 16.9%(+83.1)#246 |
| 12. | Friendsville Borough | 100.0% | 16.5%(+83.5)#12 | 16.9%(+83.1)#249 |
| 13. | Vicksburg | 100.0% | 16.5%(+83.5)#13 | 16.9%(+83.1)#255 |
| 14. | Buffington | 100.0% | 16.5%(+83.5)#14 | 16.9%(+83.1)#309 |
| 15. | Cedar Crest | 100.0% | 16.5%(+83.5)#15 | 16.9%(+83.1)#390 |
| 16. | Glasgow Borough | 100.0% | 16.5%(+83.5)#16 | 16.9%(+83.1)#392 |
| 17. | Beavertown | 100.0% | 16.5%(+83.5)#17 | 16.9%(+83.1)#482 |
| 18. | Hawk Run | 91.3% | 16.5%(+74.8)#18 | 16.9%(+74.4)#556 |
| 19. | Crown | 90.8% | 16.5%(+74.3)#19 | 16.9%(+73.8)#566 |
| 20. | Washingtonville Borough | 90.2% | 16.5%(+73.8)#20 | 16.9%(+73.3)#574 |
| 21. | Elco Borough | 87.0% | 16.5%(+70.5)#21 | 16.9%(+70.0)#650 |
| 22. | St. Clair | 85.7% | 16.5%(+69.2)#22 | 16.9%(+68.8)#691 |
| 23. | Rainsburg Borough | 81.8% | 16.5%(+65.3)#23 | 16.9%(+64.9)#786 |
| 24. | Pardeesville | 81.7% | 16.5%(+65.2)#24 | 16.9%(+64.7)#796 |
| 25. | Sheppton | 81.2% | 16.5%(+64.7)#25 | 16.9%(+64.2)#808 |
| 26. | Coalmont Borough | 80.0% | 16.5%(+63.5)#26 | 16.9%(+63.1)#848 |
| 27. | Ashley Borough | 78.8% | 16.5%(+62.3)#27 | 16.9%(+61.9)#876 |
| 28. | Smithton Borough | 78.3% | 16.5%(+61.8)#28 | 16.9%(+61.4)#892 |
| 29. | Guys Mills | 77.8% | 16.5%(+61.3)#29 | 16.9%(+60.8)#906 |
| 30. | Mainville | 77.3% | 16.5%(+60.8)#30 | 16.9%(+60.3)#929 |
| 31. | Toftrees | 75.3% | 16.5%(+58.8)#31 | 16.9%(+58.3)#1,005 |
| 32. | Spring Drive Mobile Home Park | 75.0% | 16.5%(+58.5)#32 | 16.9%(+58.1)#1,018 |
| 33. | Hunterstown | 74.6% | 16.5%(+58.1)#33 | 16.9%(+57.7)#1,037 |
| 34. | White Mills | 74.5% | 16.5%(+58.0)#34 | 16.9%(+57.5)#1,039 |
| 35. | Wall Borough | 71.9% | 16.5%(+55.5)#35 | 16.9%(+55.0)#1,148 |
| 36. | Tharptown Uniontown | 71.1% | 16.5%(+54.6)#36 | 16.9%(+54.1)#1,196 |
| 37. | North Philipsburg | 70.0% | 16.5%(+53.5)#37 | 16.9%(+53.1)#1,241 |
| 38. | Birchwood Lakes | 69.5% | 16.5%(+53.0)#38 | 16.9%(+52.5)#1,268 |
| 39. | Starbrick | 68.9% | 16.5%(+52.4)#39 | 16.9%(+52.0)#1,305 |
| 40. | Atwood Borough | 67.5% | 16.5%(+51.0)#40 | 16.9%(+50.6)#1,357 |
| 41. | Timber Hills | 66.5% | 16.5%(+50.0)#41 | 16.9%(+49.5)#1,420 |
| 42. | East Conemaugh Borough | 65.5% | 16.5%(+49.0)#42 | 16.9%(+48.6)#1,470 |
| 43. | Brave | 65.4% | 16.5%(+48.9)#43 | 16.9%(+48.4)#1,480 |
| 44. | Ehrenfeld Borough | 65.0% | 16.5%(+48.5)#44 | 16.9%(+48.1)#1,504 |
| 45. | Hudson | 64.3% | 16.5%(+47.8)#45 | 16.9%(+47.4)#1,546 |
| 46. | Dale Borough | 63.4% | 16.5%(+47.0)#46 | 16.9%(+46.5)#1,601 |
| 47. | Thompson Borough | 63.3% | 16.5%(+46.8)#47 | 16.9%(+46.4)#1,613 |
| 48. | Northern Cambria Borough | 62.8% | 16.5%(+46.4)#48 | 16.9%(+45.9)#1,649 |
| 49. | Palmdale | 62.6% | 16.5%(+46.1)#49 | 16.9%(+45.7)#1,660 |
| 50. | Big Run Borough | 61.5% | 16.5%(+45.1)#50 | 16.9%(+44.6)#1,737 |
| 51. | Enon Valley Borough | 61.2% | 16.5%(+44.7)#51 | 16.9%(+44.3)#1,759 |
| 52. | Roseville Borough | 61.1% | 16.5%(+44.6)#52 | 16.9%(+44.2)#1,768 |
| 53. | Fernville | 60.7% | 16.5%(+44.2)#53 | 16.9%(+43.7)#1,794 |
| 54. | Woodbury Borough | 60.6% | 16.5%(+44.1)#54 | 16.9%(+43.6)#1,802 |
| 55. | Farrell | 60.4% | 16.5%(+43.9)#55 | 16.9%(+43.5)#1,814 |
| 56. | Rankin Borough | 60.2% | 16.5%(+43.7)#56 | 16.9%(+43.3)#1,833 |
| 57. | Aliquippa | 60.1% | 16.5%(+43.6)#57 | 16.9%(+43.2)#1,837 |
| 58. | Geneva | 60.0% | 16.5%(+43.5)#58 | 16.9%(+43.1)#1,859 |
| 59. | Freedom Borough | 59.8% | 16.5%(+43.3)#59 | 16.9%(+42.9)#1,876 |
| 60. | West Decatur | 59.7% | 16.5%(+43.2)#60 | 16.9%(+42.8)#1,886 |
| 61. | Turtle Creek Borough | 59.6% | 16.5%(+43.1)#61 | 16.9%(+42.6)#1,899 |
| 62. | Pittston | 59.4% | 16.5%(+42.9)#62 | 16.9%(+42.4)#1,911 |
| 63. | Donora Borough | 59.2% | 16.5%(+42.7)#63 | 16.9%(+42.3)#1,924 |
| 64. | Nemacolin | 59.0% | 16.5%(+42.5)#64 | 16.9%(+42.0)#1,939 |
| 65. | Milroy | 58.8% | 16.5%(+42.3)#65 | 16.9%(+41.9)#1,954 |
| 66. | Renovo Borough | 58.3% | 16.5%(+41.8)#66 | 16.9%(+41.4)#1,986 |
| 67. | Paris | 57.4% | 16.5%(+40.9)#67 | 16.9%(+40.4)#2,068 |
| 68. | Pringle Borough | 57.3% | 16.5%(+40.9)#68 | 16.9%(+40.4)#2,071 |
| 69. | Sheatown | 57.3% | 16.5%(+40.8)#69 | 16.9%(+40.4)#2,076 |
| 70. | Marion Center Borough | 57.1% | 16.5%(+40.7)#70 | 16.9%(+40.2)#2,089 |
| 71. | Fairdale | 57.1% | 16.5%(+40.6)#71 | 16.9%(+40.2)#2,104 |
| 72. | Stony Creek Mills | 57.0% | 16.5%(+40.5)#72 | 16.9%(+40.0)#2,112 |
| 73. | Fairchance Borough | 56.9% | 16.5%(+40.4)#73 | 16.9%(+39.9)#2,119 |
| 74. | Johnstown | 56.0% | 16.5%(+39.5)#74 | 16.9%(+39.1)#2,174 |
| 75. | Laurel Run Borough | 56.0% | 16.5%(+39.5)#75 | 16.9%(+39.1)#2,177 |
| 76. | Sandy | 55.6% | 16.5%(+39.1)#76 | 16.9%(+38.7)#2,208 |
| 77. | Whitaker Borough | 55.4% | 16.5%(+38.9)#77 | 16.9%(+38.5)#2,236 |
| 78. | Darby Borough | 55.1% | 16.5%(+38.6)#78 | 16.9%(+38.2)#2,255 |
| 79. | Clarendon Borough | 54.5% | 16.5%(+38.1)#79 | 16.9%(+37.6)#2,311 |
| 80. | Braddock Borough | 54.4% | 16.5%(+37.9)#80 | 16.9%(+37.5)#2,330 |
| 81. | Luzerne Borough | 53.8% | 16.5%(+37.3)#81 | 16.9%(+36.8)#2,390 |
| 82. | Blawnox Borough | 53.8% | 16.5%(+37.3)#82 | 16.9%(+36.8)#2,392 |
| 83. | Donegal Borough | 52.6% | 16.5%(+36.1)#83 | 16.9%(+35.7)#2,490 |
| 84. | Smethport Borough | 52.4% | 16.5%(+35.9)#84 | 16.9%(+35.5)#2,510 |
| 85. | Shenandoah Borough | 52.3% | 16.5%(+35.8)#85 | 16.9%(+35.4)#2,521 |
| 86. | Pleasant Hill | 52.3% | 16.5%(+35.8)#86 | 16.9%(+35.3)#2,528 |
| 87. | Dushore Borough | 51.2% | 16.5%(+34.7)#87 | 16.9%(+34.3)#2,643 |
| 88. | Shamokin | 51.2% | 16.5%(+34.7)#88 | 16.9%(+34.3)#2,644 |
| 89. | Frizzleburg | 51.1% | 16.5%(+34.6)#89 | 16.9%(+34.1)#2,659 |
| 90. | Orchard Hills | 50.9% | 16.5%(+34.4)#90 | 16.9%(+33.9)#2,677 |
| 91. | Montrose Borough | 50.8% | 16.5%(+34.3)#91 | 16.9%(+33.8)#2,685 |
| 92. | Rochester Borough | 50.5% | 16.5%(+34.0)#92 | 16.9%(+33.6)#2,712 |
| 93. | Lykens Borough | 50.2% | 16.5%(+33.7)#93 | 16.9%(+33.2)#2,735 |
| 94. | Chester Hill Borough | 50.0% | 16.5%(+33.5)#94 | 16.9%(+33.1)#2,756 |
| 95. | South Philipsburg | 50.0% | 16.5%(+33.5)#95 | 16.9%(+33.1)#2,760 |
| 96. | Alverda | 50.0% | 16.5%(+33.5)#96 | 16.9%(+33.1)#2,795 |
| 97. | Coburn | 50.0% | 16.5%(+33.5)#97 | 16.9%(+33.1)#2,805 |
| 98. | North Braddock Borough | 49.9% | 16.5%(+33.4)#98 | 16.9%(+33.0)#2,828 |
| 99. | Millbourne Borough | 49.6% | 16.5%(+33.1)#99 | 16.9%(+32.7)#2,856 |
| 100. | Continental Courts | 49.5% | 16.5%(+33.0)#100 | 16.9%(+32.6)#2,858 |
Common Questions
What are the Top 10 Cities with the Highest Poverty Level Among Children Under the Age of 16 in Pennsylvania?
Top 10 Cities with the Highest Poverty Level Among Children Under the Age of 16 in Pennsylvania are:
#1
100.0%
#2
100.0%
#3
100.0%
#4
100.0%
#5
100.0%
#6
100.0%
#7
100.0%
#8
100.0%
#9
100.0%
#10
91.3%
What city has the Highest Poverty Level Among Children Under the Age of 16 in Pennsylvania?
The Hideout has the Highest Poverty Level Among Children Under the Age of 16 in Pennsylvania with 100.0%.
What is the Poverty Level Among Children Under the Age of 16 in the State of Pennsylvania?
Poverty Level Among Children Under the Age of 16 in Pennsylvania is 16.5%.
What is the Poverty Level Among Children Under the Age of 16 in the United States?
Poverty Level Among Children Under the Age of 16 in the United States is 16.9%.