Cities with the Highest Poverty Level Among Children Under the Age of 16 in Alabama
RELATED REPORTS & OPTIONS
Highest Poverty | Child 0-16
Alabama
Compare Cities
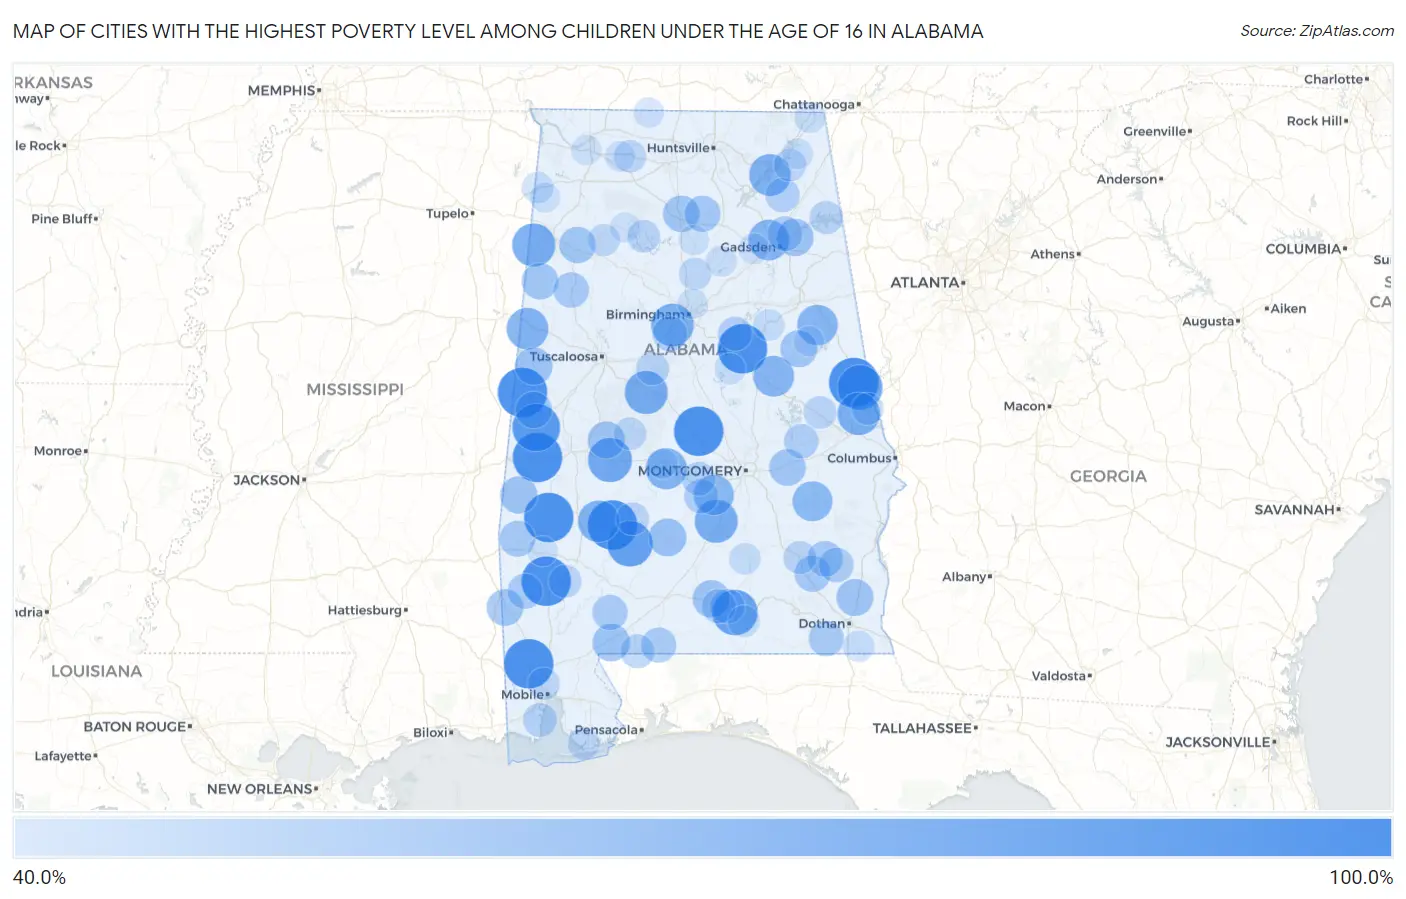
Map of Cities with the Highest Poverty Level Among Children Under the Age of 16 in Alabama
0.0%
100.0%
Cities with the Highest Poverty Level Among Children Under the Age of 16 in Alabama
| City | Child Poverty | vs State | vs National | |
| 1. | St Stephens | 100.0% | 22.5%(+77.5)#1 | 16.9%(+83.1)#92 |
| 2. | Five Points | 100.0% | 22.5%(+77.5)#2 | 16.9%(+83.1)#264 |
| 3. | Chunchula | 100.0% | 22.5%(+77.5)#3 | 16.9%(+83.1)#266 |
| 4. | Yellow Bluff | 100.0% | 22.5%(+77.5)#4 | 16.9%(+83.1)#287 |
| 5. | Bellamy | 100.0% | 22.5%(+77.5)#5 | 16.9%(+83.1)#320 |
| 6. | Panola | 100.0% | 22.5%(+77.5)#6 | 16.9%(+83.1)#369 |
| 7. | Billingsley | 100.0% | 22.5%(+77.5)#7 | 16.9%(+83.1)#400 |
| 8. | Putnam | 100.0% | 22.5%(+77.5)#8 | 16.9%(+83.1)#408 |
| 9. | Bon Air | 100.0% | 22.5%(+77.5)#9 | 16.9%(+83.1)#419 |
| 10. | Epes | 94.7% | 22.5%(+72.3)#10 | 16.9%(+77.8)#518 |
| 11. | Abanda | 92.9% | 22.5%(+70.4)#11 | 16.9%(+76.0)#533 |
| 12. | Vredenburgh | 88.9% | 22.5%(+66.4)#12 | 16.9%(+71.9)#603 |
| 13. | Sanford | 88.1% | 22.5%(+65.7)#13 | 16.9%(+71.2)#622 |
| 14. | Fredonia | 86.9% | 22.5%(+64.4)#14 | 16.9%(+70.0)#656 |
| 15. | Uniontown | 84.5% | 22.5%(+62.0)#15 | 16.9%(+67.5)#723 |
| 16. | Detroit | 81.8% | 22.5%(+59.3)#16 | 16.9%(+64.9)#783 |
| 17. | Brent | 81.5% | 22.5%(+59.1)#17 | 16.9%(+64.6)#799 |
| 18. | Fort Deposit | 81.5% | 22.5%(+59.0)#18 | 16.9%(+64.5)#801 |
| 19. | Brighton | 80.6% | 22.5%(+58.1)#19 | 16.9%(+63.6)#823 |
| 20. | Cusseta | 80.0% | 22.5%(+57.5)#20 | 16.9%(+63.1)#844 |
| 21. | Langston | 77.8% | 22.5%(+55.3)#21 | 16.9%(+60.8)#903 |
| 22. | Ethelsville | 77.8% | 22.5%(+55.3)#22 | 16.9%(+60.8)#907 |
| 23. | Pine Hill | 77.6% | 22.5%(+55.1)#23 | 16.9%(+60.7)#912 |
| 24. | Selmont West Selmont | 76.2% | 22.5%(+53.8)#24 | 16.9%(+59.3)#969 |
| 25. | Goodwater | 75.2% | 22.5%(+52.7)#25 | 16.9%(+58.3)#1,006 |
| 26. | Ridgeville | 75.0% | 22.5%(+52.5)#26 | 16.9%(+58.1)#1,021 |
| 27. | Delta | 74.4% | 22.5%(+51.9)#27 | 16.9%(+57.5)#1,043 |
| 28. | Hayneville | 73.6% | 22.5%(+51.1)#28 | 16.9%(+56.6)#1,077 |
| 29. | Union Springs | 73.0% | 22.5%(+50.5)#29 | 16.9%(+56.1)#1,102 |
| 30. | Pine Apple | 66.7% | 22.5%(+44.2)#30 | 16.9%(+49.7)#1,399 |
| 31. | Atmore | 66.1% | 22.5%(+43.6)#31 | 16.9%(+49.2)#1,440 |
| 32. | Aliceville | 66.1% | 22.5%(+43.6)#32 | 16.9%(+49.2)#1,441 |
| 33. | Lisman | 65.3% | 22.5%(+42.8)#33 | 16.9%(+48.4)#1,484 |
| 34. | Red Level | 65.3% | 22.5%(+42.8)#34 | 16.9%(+48.3)#1,487 |
| 35. | Coats Bend | 65.2% | 22.5%(+42.8)#35 | 16.9%(+48.3)#1,489 |
| 36. | Newbern | 64.7% | 22.5%(+42.2)#36 | 16.9%(+47.8)#1,521 |
| 37. | Newville | 64.4% | 22.5%(+42.0)#37 | 16.9%(+47.5)#1,533 |
| 38. | Ashland | 64.4% | 22.5%(+41.9)#38 | 16.9%(+47.5)#1,537 |
| 39. | Gainesville | 63.6% | 22.5%(+41.2)#39 | 16.9%(+46.7)#1,582 |
| 40. | Fruitdale | 63.6% | 22.5%(+41.2)#40 | 16.9%(+46.7)#1,588 |
| 41. | Shorter | 63.5% | 22.5%(+41.0)#41 | 16.9%(+46.6)#1,596 |
| 42. | South Vinemont | 63.3% | 22.5%(+40.8)#42 | 16.9%(+46.4)#1,616 |
| 43. | Vernon | 63.0% | 22.5%(+40.5)#43 | 16.9%(+46.0)#1,638 |
| 44. | Brilliant | 62.9% | 22.5%(+40.4)#44 | 16.9%(+46.0)#1,642 |
| 45. | Ariton | 62.1% | 22.5%(+39.6)#45 | 16.9%(+45.2)#1,701 |
| 46. | Fairview | 61.8% | 22.5%(+39.3)#46 | 16.9%(+44.9)#1,711 |
| 47. | Gilbertown | 61.5% | 22.5%(+39.1)#47 | 16.9%(+44.6)#1,735 |
| 48. | Clio | 60.9% | 22.5%(+38.4)#48 | 16.9%(+44.0)#1,778 |
| 49. | Fayette | 60.3% | 22.5%(+37.8)#49 | 16.9%(+43.4)#1,823 |
| 50. | Uriah | 59.7% | 22.5%(+37.2)#50 | 16.9%(+42.8)#1,888 |
| 51. | Riverview | 59.5% | 22.5%(+37.0)#51 | 16.9%(+42.5)#1,905 |
| 52. | Slocomb | 59.4% | 22.5%(+37.0)#52 | 16.9%(+42.5)#1,907 |
| 53. | Chatom | 59.4% | 22.5%(+36.9)#53 | 16.9%(+42.5)#1,909 |
| 54. | Lookout Mountain | 58.9% | 22.5%(+36.4)#54 | 16.9%(+41.9)#1,944 |
| 55. | Bessemer | 58.8% | 22.5%(+36.4)#55 | 16.9%(+41.9)#1,947 |
| 56. | Blue Springs | 58.3% | 22.5%(+35.9)#56 | 16.9%(+41.4)#1,994 |
| 57. | Reeltown | 57.8% | 22.5%(+35.3)#57 | 16.9%(+40.9)#2,034 |
| 58. | Heath | 57.7% | 22.5%(+35.2)#58 | 16.9%(+40.8)#2,044 |
| 59. | Mosses | 57.4% | 22.5%(+34.9)#59 | 16.9%(+40.5)#2,067 |
| 60. | Lakeview | 57.1% | 22.5%(+34.7)#60 | 16.9%(+40.2)#2,098 |
| 61. | River Falls | 56.9% | 22.5%(+34.4)#61 | 16.9%(+40.0)#2,117 |
| 62. | Vincent | 56.5% | 22.5%(+34.0)#62 | 16.9%(+39.5)#2,145 |
| 63. | Flomaton | 56.1% | 22.5%(+33.6)#63 | 16.9%(+39.2)#2,168 |
| 64. | White Hall | 55.9% | 22.5%(+33.4)#64 | 16.9%(+39.0)#2,186 |
| 65. | Belle Fontaine | 55.8% | 22.5%(+33.3)#65 | 16.9%(+38.8)#2,198 |
| 66. | Cedar Bluff | 54.2% | 22.5%(+31.8)#66 | 16.9%(+37.3)#2,352 |
| 67. | Brundidge | 53.9% | 22.5%(+31.4)#67 | 16.9%(+36.9)#2,380 |
| 68. | West Blocton | 53.7% | 22.5%(+31.3)#68 | 16.9%(+36.8)#2,394 |
| 69. | Camden | 53.5% | 22.5%(+31.0)#69 | 16.9%(+36.5)#2,403 |
| 70. | Jackson | 53.1% | 22.5%(+30.6)#70 | 16.9%(+36.1)#2,442 |
| 71. | Camp Hill | 53.1% | 22.5%(+30.6)#71 | 16.9%(+36.1)#2,446 |
| 72. | Arley | 52.8% | 22.5%(+30.4)#72 | 16.9%(+35.9)#2,468 |
| 73. | Dutton | 52.4% | 22.5%(+29.9)#73 | 16.9%(+35.5)#2,507 |
| 74. | Marion | 52.4% | 22.5%(+29.9)#74 | 16.9%(+35.5)#2,509 |
| 75. | Courtland | 51.6% | 22.5%(+29.1)#75 | 16.9%(+34.7)#2,596 |
| 76. | Bon Secour | 51.5% | 22.5%(+29.0)#76 | 16.9%(+34.5)#2,611 |
| 77. | Lanett | 51.3% | 22.5%(+28.8)#77 | 16.9%(+34.3)#2,634 |
| 78. | Chickasaw | 51.2% | 22.5%(+28.7)#78 | 16.9%(+34.3)#2,647 |
| 79. | Trafford | 51.2% | 22.5%(+28.7)#79 | 16.9%(+34.2)#2,650 |
| 80. | Lynn | 50.9% | 22.5%(+28.5)#80 | 16.9%(+34.0)#2,674 |
| 81. | Horn Hill | 50.0% | 22.5%(+27.5)#81 | 16.9%(+33.1)#2,781 |
| 82. | Red Bay | 49.6% | 22.5%(+27.1)#82 | 16.9%(+32.7)#2,857 |
| 83. | Rutledge | 49.3% | 22.5%(+26.8)#83 | 16.9%(+32.4)#2,877 |
| 84. | Talladega | 49.2% | 22.5%(+26.7)#84 | 16.9%(+32.3)#2,885 |
| 85. | Cottonwood | 49.0% | 22.5%(+26.5)#85 | 16.9%(+32.0)#2,904 |
| 86. | Talladega Springs | 48.6% | 22.5%(+26.1)#86 | 16.9%(+31.6)#2,952 |
| 87. | Bridgeport | 47.8% | 22.5%(+25.3)#87 | 16.9%(+30.9)#3,046 |
| 88. | Allgood | 47.6% | 22.5%(+25.1)#88 | 16.9%(+30.7)#3,062 |
| 89. | Pisgah | 47.6% | 22.5%(+25.1)#89 | 16.9%(+30.6)#3,072 |
| 90. | Gallant | 46.9% | 22.5%(+24.4)#90 | 16.9%(+29.9)#3,169 |
| 91. | Tarrant | 46.7% | 22.5%(+24.2)#91 | 16.9%(+29.8)#3,202 |
| 92. | Town Creek | 46.7% | 22.5%(+24.2)#92 | 16.9%(+29.8)#3,203 |
| 93. | Lester | 46.7% | 22.5%(+24.2)#93 | 16.9%(+29.7)#3,216 |
| 94. | Selma | 46.5% | 22.5%(+24.0)#94 | 16.9%(+29.5)#3,243 |
| 95. | Hanceville | 46.5% | 22.5%(+24.0)#95 | 16.9%(+29.5)#3,244 |
| 96. | Double Springs | 46.4% | 22.5%(+23.9)#96 | 16.9%(+29.4)#3,256 |
| 97. | Lineville | 46.3% | 22.5%(+23.8)#97 | 16.9%(+29.4)#3,266 |
| 98. | Tuscumbia | 46.3% | 22.5%(+23.8)#98 | 16.9%(+29.3)#3,276 |
| 99. | Coffeeville | 46.2% | 22.5%(+23.7)#99 | 16.9%(+29.2)#3,295 |
| 100. | Vina | 46.0% | 22.5%(+23.5)#100 | 16.9%(+29.0)#3,320 |
Common Questions
What are the Top 10 Cities with the Highest Poverty Level Among Children Under the Age of 16 in Alabama?
Top 10 Cities with the Highest Poverty Level Among Children Under the Age of 16 in Alabama are:
#1
100.0%
#2
100.0%
#3
100.0%
#4
100.0%
#5
100.0%
#6
100.0%
#7
100.0%
#8
100.0%
#9
100.0%
#10
94.7%
What city has the Highest Poverty Level Among Children Under the Age of 16 in Alabama?
St Stephens has the Highest Poverty Level Among Children Under the Age of 16 in Alabama with 100.0%.
What is the Poverty Level Among Children Under the Age of 16 in the State of Alabama?
Poverty Level Among Children Under the Age of 16 in Alabama is 22.5%.
What is the Poverty Level Among Children Under the Age of 16 in the United States?
Poverty Level Among Children Under the Age of 16 in the United States is 16.9%.