Cities with the Highest Poverty Level Among Children Under the Age of 16 in Nebraska
RELATED REPORTS & OPTIONS
Highest Poverty | Child 0-16
Nebraska
Compare Cities
Map of Cities with the Highest Poverty Level Among Children Under the Age of 16 in Nebraska
0.0%
100.0%
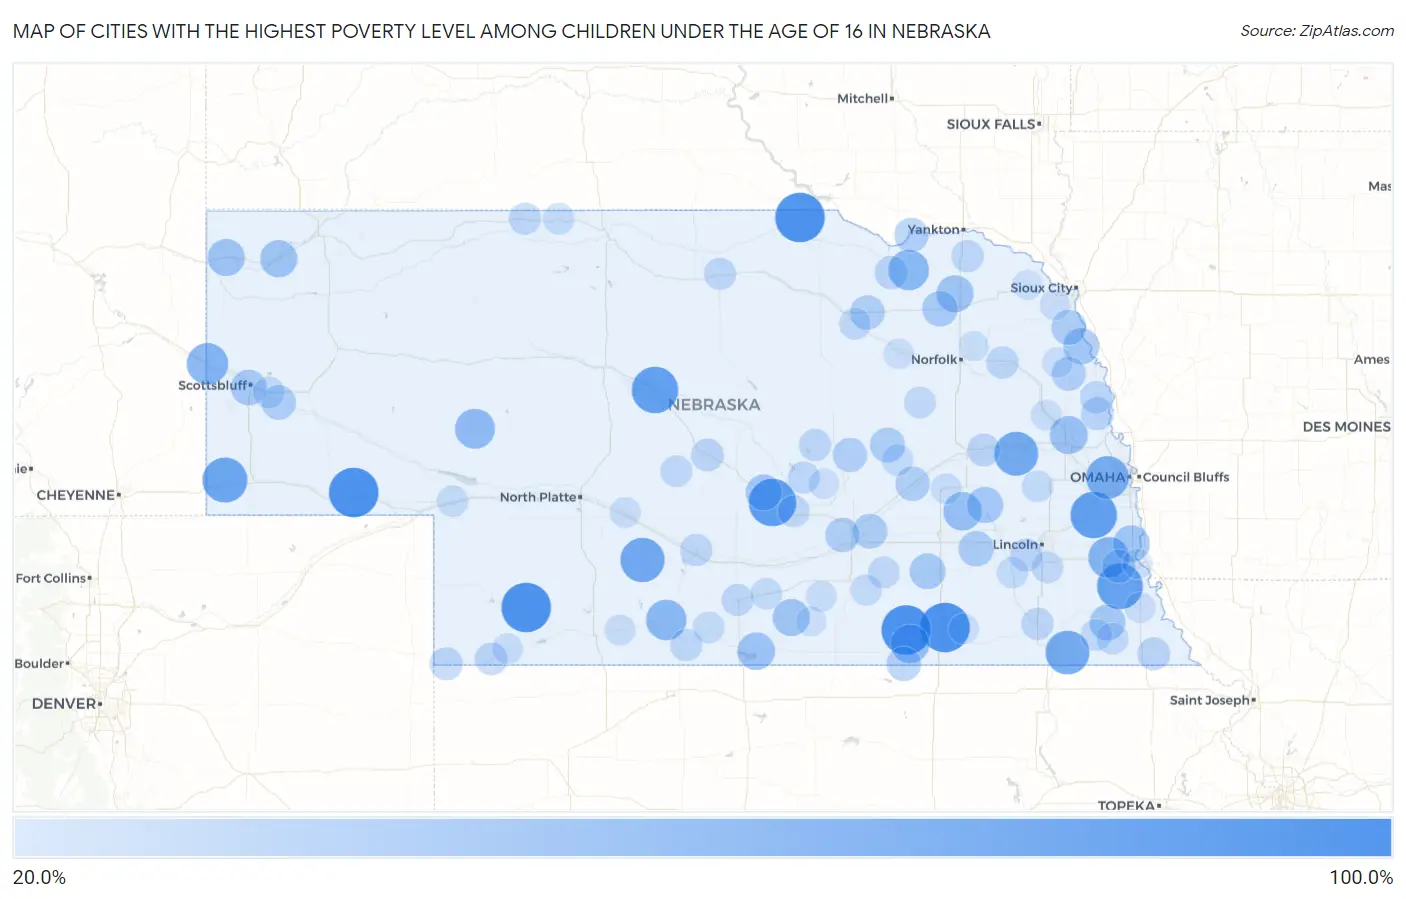
Cities with the Highest Poverty Level Among Children Under the Age of 16 in Nebraska
| City | Child Poverty | vs State | vs National | |
| 1. | Sunol | 100.0% | 12.2% (+87.8)#1 | 16.9% (+83.1)#271 |
| 2. | Belvidere | 100.0% | 12.2% (+87.8)#2 | 16.9% (+83.1)#418 |
| 3. | Oak | 100.0% | 12.2% (+87.8)#3 | 16.9% (+83.1)#447 |
| 4. | Anoka | 100.0% | 12.2% (+87.8)#4 | 16.9% (+83.1)#459 |
| 5. | Hamlet | 100.0% | 12.2% (+87.8)#5 | 16.9% (+83.1)#467 |
| 6. | Hazard | 91.7% | 12.2% (+79.5)#6 | 16.9% (+74.7)#550 |
| 7. | South Bend | 87.5% | 12.2% (+75.3)#7 | 16.9% (+70.6)#633 |
| 8. | Dunning | 87.5% | 12.2% (+75.3)#8 | 16.9% (+70.6)#635 |
| 9. | Talmage | 84.9% | 12.2% (+72.7)#9 | 16.9% (+68.0)#713 |
| 10. | Bushnell | 81.2% | 12.2% (+69.1)#10 | 16.9% (+64.3)#805 |
| 11. | Farnam | 78.6% | 12.2% (+66.4)#11 | 16.9% (+61.6)#884 |
| 12. | Linwood | 77.5% | 12.2% (+65.3)#12 | 16.9% (+60.6)#915 |
| 13. | Liberty | 76.5% | 12.2% (+64.3)#13 | 16.9% (+59.5)#961 |
| 14. | Boys Town | 73.1% | 12.2% (+60.9)#14 | 16.9% (+56.1)#1,098 |
| 15. | Henry | 66.7% | 12.2% (+54.5)#15 | 16.9% (+49.7)#1,408 |
| 16. | Otoe | 65.4% | 12.2% (+53.2)#16 | 16.9% (+48.4)#1,477 |
| 17. | Center | 63.4% | 12.2% (+51.2)#17 | 16.9% (+46.5)#1,606 |
| 18. | Holbrook | 63.3% | 12.2% (+51.2)#18 | 16.9% (+46.4)#1,612 |
| 19. | Arthur | 61.1% | 12.2% (+48.9)#19 | 16.9% (+44.2)#1,770 |
| 20. | Ruskin | 56.2% | 12.2% (+44.1)#20 | 16.9% (+39.3)#2,160 |
| 21. | Gresham | 55.2% | 12.2% (+43.0)#21 | 16.9% (+38.2)#2,250 |
| 22. | Nickerson | 53.5% | 12.2% (+41.3)#22 | 16.9% (+36.5)#2,404 |
| 23. | Republican City | 52.0% | 12.2% (+39.8)#23 | 16.9% (+35.1)#2,559 |
| 24. | Crawford | 50.5% | 12.2% (+38.3)#24 | 16.9% (+33.6)#2,714 |
| 25. | Harrison | 50.0% | 12.2% (+37.8)#25 | 16.9% (+33.1)#2,784 |
| 26. | Upland | 50.0% | 12.2% (+37.8)#26 | 16.9% (+33.1)#2,804 |
| 27. | Magnet | 50.0% | 12.2% (+37.8)#27 | 16.9% (+33.1)#2,821 |
| 28. | Union | 49.0% | 12.2% (+36.8)#28 | 16.9% (+32.0)#2,902 |
| 29. | Ulysses | 47.1% | 12.2% (+34.9)#29 | 16.9% (+30.1)#3,147 |
| 30. | Macy | 46.8% | 12.2% (+34.6)#30 | 16.9% (+29.8)#3,192 |
| 31. | Litchfield | 46.3% | 12.2% (+34.1)#31 | 16.9% (+29.3)#3,279 |
| 32. | Elk Creek | 45.5% | 12.2% (+33.3)#32 | 16.9% (+28.5)#3,415 |
| 33. | Grafton | 44.8% | 12.2% (+32.7)#33 | 16.9% (+27.9)#3,505 |
| 34. | Terrytown | 44.7% | 12.2% (+32.5)#34 | 16.9% (+27.7)#3,519 |
| 35. | Osmond | 43.7% | 12.2% (+31.5)#35 | 16.9% (+26.8)#3,653 |
| 36. | Beaver Crossing | 43.2% | 12.2% (+31.1)#36 | 16.9% (+26.3)#3,734 |
| 37. | Belgrade | 41.9% | 12.2% (+29.8)#37 | 16.9% (+25.0)#3,982 |
| 38. | Phillips | 41.8% | 12.2% (+29.7)#38 | 16.9% (+24.9)#3,996 |
| 39. | Winnebago | 41.8% | 12.2% (+29.6)#39 | 16.9% (+24.9)#4,000 |
| 40. | Clarks | 40.3% | 12.2% (+28.2)#40 | 16.9% (+23.4)#4,252 |
| 41. | Orchard | 40.0% | 12.2% (+27.8)#41 | 16.9% (+23.1)#4,311 |
| 42. | Hardy | 40.0% | 12.2% (+27.8)#42 | 16.9% (+23.1)#4,324 |
| 43. | Mcgrew | 40.0% | 12.2% (+27.8)#43 | 16.9% (+23.1)#4,334 |
| 44. | Alda | 39.8% | 12.2% (+27.7)#44 | 16.9% (+22.9)#4,364 |
| 45. | Wolbach | 39.4% | 12.2% (+27.3)#45 | 16.9% (+22.5)#4,430 |
| 46. | Santee | 39.2% | 12.2% (+27.0)#46 | 16.9% (+22.2)#4,483 |
| 47. | Lyons | 38.9% | 12.2% (+26.7)#47 | 16.9% (+21.9)#4,546 |
| 48. | Dunbar | 35.7% | 12.2% (+23.5)#48 | 16.9% (+18.8)#5,180 |
| 49. | Verdigre | 35.2% | 12.2% (+23.0)#49 | 16.9% (+18.2)#5,312 |
| 50. | Herman | 34.0% | 12.2% (+21.9)#50 | 16.9% (+17.1)#5,573 |
| 51. | Haigler | 34.0% | 12.2% (+21.8)#51 | 16.9% (+17.1)#5,588 |
| 52. | Broken Bow | 33.5% | 12.2% (+21.3)#52 | 16.9% (+16.5)#5,691 |
| 53. | Benkelman | 33.3% | 12.2% (+21.2)#53 | 16.9% (+16.4)#5,718 |
| 54. | Denton | 33.3% | 12.2% (+21.2)#54 | 16.9% (+16.4)#5,766 |
| 55. | Salem | 33.3% | 12.2% (+21.2)#55 | 16.9% (+16.4)#5,782 |
| 56. | Richland | 33.3% | 12.2% (+21.2)#56 | 16.9% (+16.4)#5,794 |
| 57. | Tekamah | 33.0% | 12.2% (+20.8)#57 | 16.9% (+16.0)#5,859 |
| 58. | Pilger | 32.4% | 12.2% (+20.3)#58 | 16.9% (+15.5)#5,978 |
| 59. | Scotia | 31.7% | 12.2% (+19.5)#59 | 16.9% (+14.8)#6,177 |
| 60. | Fordyce | 31.6% | 12.2% (+19.4)#60 | 16.9% (+14.6)#6,211 |
| 61. | Beatrice | 31.5% | 12.2% (+19.4)#61 | 16.9% (+14.6)#6,226 |
| 62. | Lexington | 31.4% | 12.2% (+19.2)#62 | 16.9% (+14.4)#6,278 |
| 63. | Bassett | 31.2% | 12.2% (+19.0)#63 | 16.9% (+14.2)#6,333 |
| 64. | Beaver City | 31.0% | 12.2% (+18.9)#64 | 16.9% (+14.1)#6,376 |
| 65. | Holdrege | 30.9% | 12.2% (+18.7)#65 | 16.9% (+13.9)#6,428 |
| 66. | Ashton | 30.8% | 12.2% (+18.6)#66 | 16.9% (+13.8)#6,455 |
| 67. | Cody | 30.8% | 12.2% (+18.6)#67 | 16.9% (+13.8)#6,458 |
| 68. | Ravenna | 30.5% | 12.2% (+18.4)#68 | 16.9% (+13.6)#6,530 |
| 69. | Callaway | 30.1% | 12.2% (+17.9)#69 | 16.9% (+13.2)#6,659 |
| 70. | Harvard | 29.9% | 12.2% (+17.7)#70 | 16.9% (+12.9)#6,719 |
| 71. | Minatare | 29.7% | 12.2% (+17.6)#71 | 16.9% (+12.8)#6,761 |
| 72. | Table Rock | 29.7% | 12.2% (+17.6)#72 | 16.9% (+12.8)#6,765 |
| 73. | Steinauer | 29.7% | 12.2% (+17.6)#73 | 16.9% (+12.8)#6,767 |
| 74. | Ewing | 29.6% | 12.2% (+17.4)#74 | 16.9% (+12.7)#6,799 |
| 75. | Newman Grove | 29.6% | 12.2% (+17.4)#75 | 16.9% (+12.6)#6,808 |
| 76. | Roca | 29.4% | 12.2% (+17.2)#76 | 16.9% (+12.5)#6,849 |
| 77. | Crete | 29.0% | 12.2% (+16.9)#77 | 16.9% (+12.1)#6,955 |
| 78. | Oxford | 28.9% | 12.2% (+16.7)#78 | 16.9% (+12.0)#6,988 |
| 79. | Fullerton | 28.6% | 12.2% (+16.4)#79 | 16.9% (+11.6)#7,071 |
| 80. | Kilgore | 28.6% | 12.2% (+16.4)#80 | 16.9% (+11.6)#7,105 |
| 81. | Axtell | 28.3% | 12.2% (+16.1)#81 | 16.9% (+11.4)#7,168 |
| 82. | Glenvil | 28.3% | 12.2% (+16.1)#82 | 16.9% (+11.4)#7,171 |
| 83. | Brule | 28.3% | 12.2% (+16.1)#83 | 16.9% (+11.3)#7,179 |
| 84. | Weston | 28.3% | 12.2% (+16.1)#84 | 16.9% (+11.3)#7,180 |
| 85. | Max | 26.5% | 12.2% (+14.3)#85 | 16.9% (+9.53)#7,825 |
| 86. | Holstein | 26.3% | 12.2% (+14.2)#86 | 16.9% (+9.38)#7,885 |
| 87. | Osceola | 25.9% | 12.2% (+13.8)#87 | 16.9% (+8.99)#8,019 |
| 88. | Brady | 25.9% | 12.2% (+13.8)#88 | 16.9% (+8.99)#8,020 |
| 89. | Scribner | 25.9% | 12.2% (+13.7)#89 | 16.9% (+8.96)#8,028 |
| 90. | Indianola | 25.7% | 12.2% (+13.6)#90 | 16.9% (+8.80)#8,101 |
| 91. | Auburn | 25.4% | 12.2% (+13.2)#91 | 16.9% (+8.42)#8,226 |
| 92. | Bancroft | 25.2% | 12.2% (+13.1)#92 | 16.9% (+8.29)#8,273 |
| 93. | Oakdale | 25.0% | 12.2% (+12.8)#93 | 16.9% (+8.06)#8,352 |
| 94. | Hubbard | 25.0% | 12.2% (+12.8)#94 | 16.9% (+8.06)#8,362 |
| 95. | Alexandria | 25.0% | 12.2% (+12.8)#95 | 16.9% (+8.06)#8,389 |
| 96. | Farwell | 25.0% | 12.2% (+12.8)#96 | 16.9% (+8.06)#8,395 |
| 97. | Hoskins | 24.2% | 12.2% (+12.0)#97 | 16.9% (+7.25)#8,652 |
| 98. | Campbell | 24.1% | 12.2% (+12.0)#98 | 16.9% (+7.20)#8,673 |
| 99. | Martinsburg | 23.8% | 12.2% (+11.6)#99 | 16.9% (+6.87)#8,783 |
| 100. | Nebraska City | 23.6% | 12.2% (+11.4)#100 | 16.9% (+6.61)#8,856 |
Common Questions
What are the Top 10 Cities with the Highest Poverty Level Among Children Under the Age of 16 in Nebraska?
Top 10 Cities with the Highest Poverty Level Among Children Under the Age of 16 in Nebraska are:
What city has the Highest Poverty Level Among Children Under the Age of 16 in Nebraska?
Sunol has the Highest Poverty Level Among Children Under the Age of 16 in Nebraska with 100.0%.
What is the Poverty Level Among Children Under the Age of 16 in the State of Nebraska?
Poverty Level Among Children Under the Age of 16 in Nebraska is 12.2%.
What is the Poverty Level Among Children Under the Age of 16 in the United States?
Poverty Level Among Children Under the Age of 16 in the United States is 16.9%.