Cities with the Highest Poverty Level Among Children Under the Age of 16 in Arizona
RELATED REPORTS & OPTIONS
Highest Poverty | Child 0-16
Arizona
Compare Cities
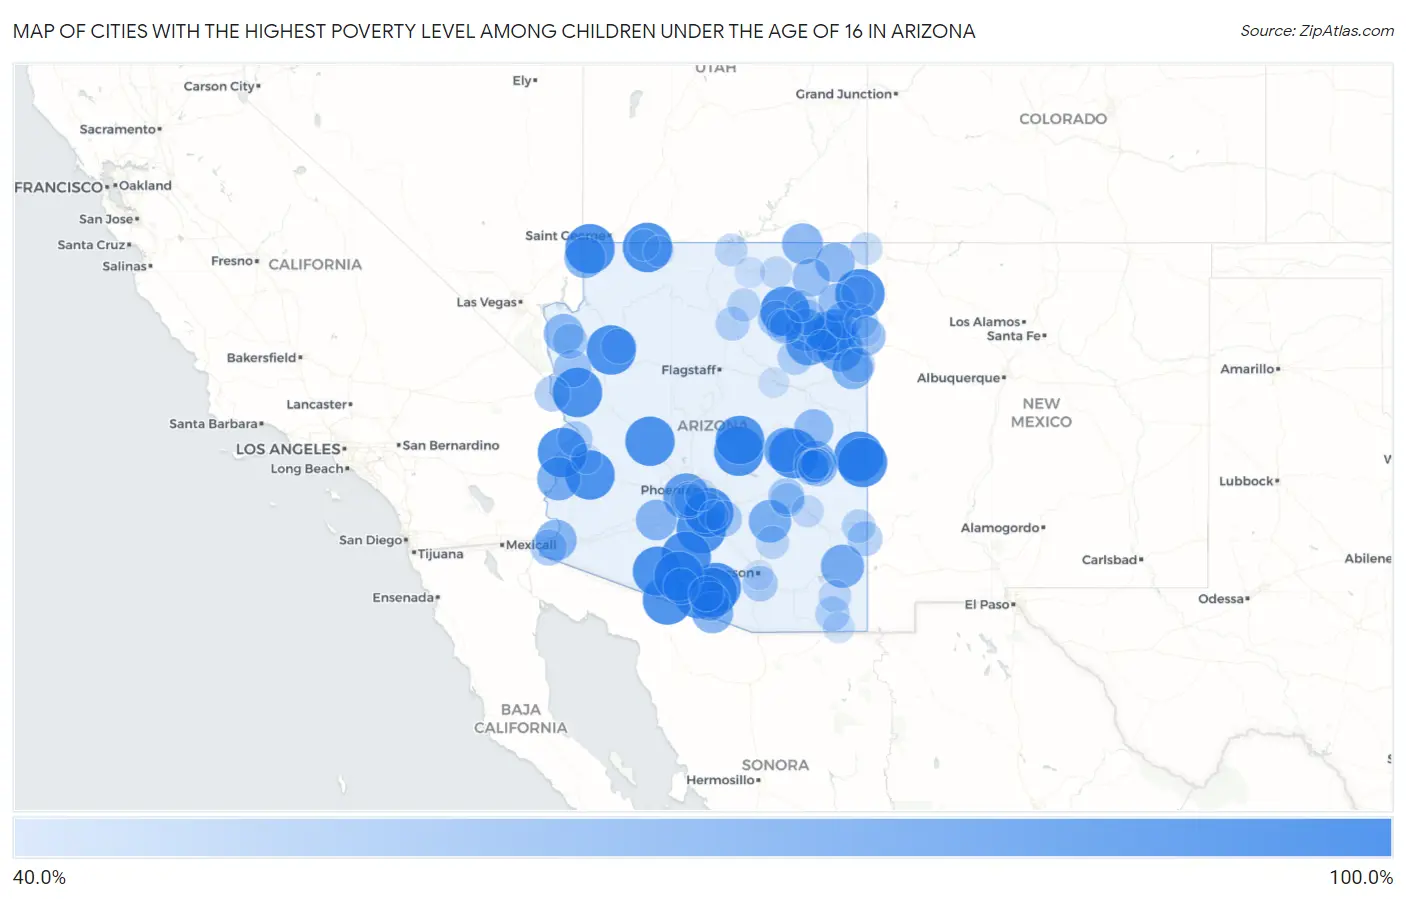
Map of Cities with the Highest Poverty Level Among Children Under the Age of 16 in Arizona
0.0%
100.0%
Cities with the Highest Poverty Level Among Children Under the Age of 16 in Arizona
| City | Child Poverty | vs State | vs National | |
| 1. | Beaver Dam | 100.0% | 18.1%(+81.9)#1 | 16.9%(+83.1)#5 |
| 2. | Congress | 100.0% | 18.1%(+81.9)#2 | 16.9%(+83.1)#11 |
| 3. | Brenda | 100.0% | 18.1%(+81.9)#3 | 16.9%(+83.1)#57 |
| 4. | Stanfield | 100.0% | 18.1%(+81.9)#4 | 16.9%(+83.1)#93 |
| 5. | Nutrioso | 100.0% | 18.1%(+81.9)#5 | 16.9%(+83.1)#107 |
| 6. | Carrizo | 100.0% | 18.1%(+81.9)#6 | 16.9%(+83.1)#158 |
| 7. | Cane Beds | 100.0% | 18.1%(+81.9)#7 | 16.9%(+83.1)#179 |
| 8. | Jakes Corner | 100.0% | 18.1%(+81.9)#8 | 16.9%(+83.1)#212 |
| 9. | Gu Oidak | 100.0% | 18.1%(+81.9)#9 | 16.9%(+83.1)#234 |
| 10. | Haivana Nakya | 100.0% | 18.1%(+81.9)#10 | 16.9%(+83.1)#261 |
| 11. | Sehili | 100.0% | 18.1%(+81.9)#11 | 16.9%(+83.1)#262 |
| 12. | Poston | 100.0% | 18.1%(+81.9)#12 | 16.9%(+83.1)#270 |
| 13. | Alpine | 100.0% | 18.1%(+81.9)#13 | 16.9%(+83.1)#284 |
| 14. | Ventana | 100.0% | 18.1%(+81.9)#14 | 16.9%(+83.1)#305 |
| 15. | Ali Chuk | 100.0% | 18.1%(+81.9)#15 | 16.9%(+83.1)#308 |
| 16. | Hard Rock | 100.0% | 18.1%(+81.9)#16 | 16.9%(+83.1)#310 |
| 17. | Sweet Water Village | 100.0% | 18.1%(+81.9)#17 | 16.9%(+83.1)#317 |
| 18. | Truxton | 100.0% | 18.1%(+81.9)#18 | 16.9%(+83.1)#333 |
| 19. | Why | 100.0% | 18.1%(+81.9)#19 | 16.9%(+83.1)#336 |
| 20. | Chiawuli Tak | 100.0% | 18.1%(+81.9)#20 | 16.9%(+83.1)#360 |
| 21. | Yucca | 100.0% | 18.1%(+81.9)#21 | 16.9%(+83.1)#399 |
| 22. | Wahak Hotrontk | 100.0% | 18.1%(+81.9)#22 | 16.9%(+83.1)#441 |
| 23. | Round Valley | 97.4% | 18.1%(+79.3)#23 | 16.9%(+80.4)#501 |
| 24. | Cornfields | 89.2% | 18.1%(+71.0)#24 | 16.9%(+72.2)#594 |
| 25. | Maricopa Colony | 89.0% | 18.1%(+70.8)#25 | 16.9%(+72.0)#598 |
| 26. | Whitecone | 88.5% | 18.1%(+70.3)#26 | 16.9%(+71.5)#613 |
| 27. | Klagetoh | 87.5% | 18.1%(+69.4)#27 | 16.9%(+70.6)#631 |
| 28. | Cibecue | 85.2% | 18.1%(+67.0)#28 | 16.9%(+68.2)#704 |
| 29. | Burnside | 83.2% | 18.1%(+65.1)#29 | 16.9%(+66.3)#759 |
| 30. | Ehrenberg | 80.9% | 18.1%(+62.7)#30 | 16.9%(+63.9)#813 |
| 31. | Bowie | 80.6% | 18.1%(+62.5)#31 | 16.9%(+63.7)#821 |
| 32. | Winkelman | 78.9% | 18.1%(+60.8)#32 | 16.9%(+62.0)#871 |
| 33. | Jeddito | 78.6% | 18.1%(+60.4)#33 | 16.9%(+61.6)#883 |
| 34. | Rainbow City | 75.7% | 18.1%(+57.6)#34 | 16.9%(+58.8)#995 |
| 35. | San Miguel | 75.3% | 18.1%(+57.2)#35 | 16.9%(+58.4)#1,004 |
| 36. | Casa Blanca | 75.0% | 18.1%(+56.9)#36 | 16.9%(+58.1)#1,013 |
| 37. | Scenic | 74.4% | 18.1%(+56.3)#37 | 16.9%(+57.4)#1,044 |
| 38. | El Prado Estates | 73.5% | 18.1%(+55.4)#38 | 16.9%(+56.6)#1,083 |
| 39. | Sanders | 73.5% | 18.1%(+55.3)#39 | 16.9%(+56.5)#1,086 |
| 40. | Oljato Monument Valley | 73.3% | 18.1%(+55.2)#40 | 16.9%(+56.4)#1,092 |
| 41. | Gila Bend | 72.9% | 18.1%(+54.7)#41 | 16.9%(+55.9)#1,108 |
| 42. | White Hills | 70.6% | 18.1%(+52.5)#42 | 16.9%(+53.6)#1,217 |
| 43. | East Fork | 69.4% | 18.1%(+51.3)#43 | 16.9%(+52.5)#1,271 |
| 44. | Rock Point | 69.3% | 18.1%(+51.2)#44 | 16.9%(+52.4)#1,277 |
| 45. | Topawa | 69.0% | 18.1%(+50.8)#45 | 16.9%(+52.0)#1,300 |
| 46. | White Mountain Lake | 68.3% | 18.1%(+50.2)#46 | 16.9%(+51.4)#1,329 |
| 47. | Window Rock | 67.2% | 18.1%(+49.1)#47 | 16.9%(+50.3)#1,375 |
| 48. | Steamboat | 66.2% | 18.1%(+48.1)#48 | 16.9%(+49.2)#1,437 |
| 49. | Chinle | 65.7% | 18.1%(+47.6)#49 | 16.9%(+48.8)#1,465 |
| 50. | Chilchinbito | 64.5% | 18.1%(+46.3)#50 | 16.9%(+47.5)#1,532 |
| 51. | Golden Valley | 62.9% | 18.1%(+44.8)#51 | 16.9%(+45.9)#1,646 |
| 52. | Nazlini | 62.4% | 18.1%(+44.3)#52 | 16.9%(+45.5)#1,680 |
| 53. | St Johns | 60.3% | 18.1%(+42.2)#53 | 16.9%(+43.3)#1,824 |
| 54. | Hotevilla Bacavi | 59.7% | 18.1%(+41.6)#54 | 16.9%(+42.8)#1,885 |
| 55. | Blackwater | 59.4% | 18.1%(+41.3)#55 | 16.9%(+42.5)#1,910 |
| 56. | Pisinemo | 59.3% | 18.1%(+41.2)#56 | 16.9%(+42.4)#1,918 |
| 57. | Rancho Mesa Verde | 59.3% | 18.1%(+41.2)#57 | 16.9%(+42.3)#1,919 |
| 58. | San Carlos | 58.8% | 18.1%(+40.6)#58 | 16.9%(+41.8)#1,959 |
| 59. | Low Mountain | 57.5% | 18.1%(+39.3)#59 | 16.9%(+40.5)#2,063 |
| 60. | Arizona Village | 57.1% | 18.1%(+39.0)#60 | 16.9%(+40.2)#2,088 |
| 61. | Summit | 56.9% | 18.1%(+38.8)#61 | 16.9%(+40.0)#2,114 |
| 62. | Shongopovi | 56.8% | 18.1%(+38.7)#62 | 16.9%(+39.9)#2,124 |
| 63. | Sells | 56.8% | 18.1%(+38.7)#63 | 16.9%(+39.9)#2,125 |
| 64. | Peach Springs | 56.3% | 18.1%(+38.2)#64 | 16.9%(+39.4)#2,150 |
| 65. | Cienega Springs | 56.3% | 18.1%(+38.2)#65 | 16.9%(+39.3)#2,152 |
| 66. | Dolan Springs | 55.6% | 18.1%(+37.4)#66 | 16.9%(+38.6)#2,213 |
| 67. | Duncan | 55.6% | 18.1%(+37.4)#67 | 16.9%(+38.6)#2,214 |
| 68. | Seven Mile | 55.5% | 18.1%(+37.4)#68 | 16.9%(+38.6)#2,227 |
| 69. | Dilkon | 55.2% | 18.1%(+37.1)#69 | 16.9%(+38.3)#2,247 |
| 70. | Houck | 54.9% | 18.1%(+36.8)#70 | 16.9%(+38.0)#2,277 |
| 71. | Canyon Day | 54.6% | 18.1%(+36.4)#71 | 16.9%(+37.6)#2,306 |
| 72. | Mcneal | 53.8% | 18.1%(+35.7)#72 | 16.9%(+36.9)#2,387 |
| 73. | Peridot | 52.9% | 18.1%(+34.7)#73 | 16.9%(+35.9)#2,464 |
| 74. | Cameron | 52.8% | 18.1%(+34.7)#74 | 16.9%(+35.9)#2,476 |
| 75. | Sawmill | 52.5% | 18.1%(+34.3)#75 | 16.9%(+35.5)#2,503 |
| 76. | York | 51.7% | 18.1%(+33.6)#76 | 16.9%(+34.8)#2,587 |
| 77. | Second Mesa | 51.3% | 18.1%(+33.1)#77 | 16.9%(+34.3)#2,635 |
| 78. | Mammoth | 50.4% | 18.1%(+32.2)#78 | 16.9%(+33.4)#2,722 |
| 79. | Moenkopi | 50.3% | 18.1%(+32.2)#79 | 16.9%(+33.3)#2,727 |
| 80. | Tsaile | 49.5% | 18.1%(+31.3)#80 | 16.9%(+32.5)#2,862 |
| 81. | Greasewood | 49.1% | 18.1%(+30.9)#81 | 16.9%(+32.1)#2,896 |
| 82. | Sunizona | 48.9% | 18.1%(+30.8)#82 | 16.9%(+32.0)#2,909 |
| 83. | Lechee | 48.6% | 18.1%(+30.5)#83 | 16.9%(+31.7)#2,947 |
| 84. | Teec Nos Pos | 48.3% | 18.1%(+30.2)#84 | 16.9%(+31.3)#2,985 |
| 85. | Fort Apache | 47.8% | 18.1%(+29.7)#85 | 16.9%(+30.9)#3,045 |
| 86. | Bylas | 47.4% | 18.1%(+29.3)#86 | 16.9%(+30.5)#3,097 |
| 87. | Komatke | 47.4% | 18.1%(+29.3)#87 | 16.9%(+30.5)#3,099 |
| 88. | Pinon | 47.0% | 18.1%(+28.8)#88 | 16.9%(+30.0)#3,163 |
| 89. | Shonto | 46.9% | 18.1%(+28.7)#89 | 16.9%(+29.9)#3,171 |
| 90. | Guadalupe | 46.5% | 18.1%(+28.4)#90 | 16.9%(+29.6)#3,226 |
| 91. | Colorado City | 45.6% | 18.1%(+27.4)#91 | 16.9%(+28.6)#3,385 |
| 92. | Douglas | 45.5% | 18.1%(+27.4)#92 | 16.9%(+28.6)#3,394 |
| 93. | Kaibab | 43.8% | 18.1%(+25.6)#93 | 16.9%(+26.8)#3,646 |
| 94. | Kaibito | 43.5% | 18.1%(+25.4)#94 | 16.9%(+26.6)#3,677 |
| 95. | Winslow | 43.2% | 18.1%(+25.1)#95 | 16.9%(+26.3)#3,737 |
| 96. | Whiteriver | 43.1% | 18.1%(+25.0)#96 | 16.9%(+26.2)#3,760 |
| 97. | Bouse | 42.9% | 18.1%(+24.7)#97 | 16.9%(+25.9)#3,795 |
| 98. | Fort Defiance | 42.5% | 18.1%(+24.4)#98 | 16.9%(+25.6)#3,862 |
| 99. | South Tucson | 41.4% | 18.1%(+23.2)#99 | 16.9%(+24.4)#4,072 |
| 100. | Sacaton | 41.3% | 18.1%(+23.1)#100 | 16.9%(+24.3)#4,091 |
Common Questions
What are the Top 10 Cities with the Highest Poverty Level Among Children Under the Age of 16 in Arizona?
Top 10 Cities with the Highest Poverty Level Among Children Under the Age of 16 in Arizona are:
#1
100.0%
#2
100.0%
#3
100.0%
#4
100.0%
#5
100.0%
#6
100.0%
#7
100.0%
#8
100.0%
#9
100.0%
#10
100.0%
What city has the Highest Poverty Level Among Children Under the Age of 16 in Arizona?
Beaver Dam has the Highest Poverty Level Among Children Under the Age of 16 in Arizona with 100.0%.
What is the Poverty Level Among Children Under the Age of 16 in the State of Arizona?
Poverty Level Among Children Under the Age of 16 in Arizona is 18.1%.
What is the Poverty Level Among Children Under the Age of 16 in the United States?
Poverty Level Among Children Under the Age of 16 in the United States is 16.9%.