Cities with the Highest Poverty Level Among Children Under the Age of 16 in New York
RELATED REPORTS & OPTIONS
Highest Poverty | Child 0-16
New York
Compare Cities
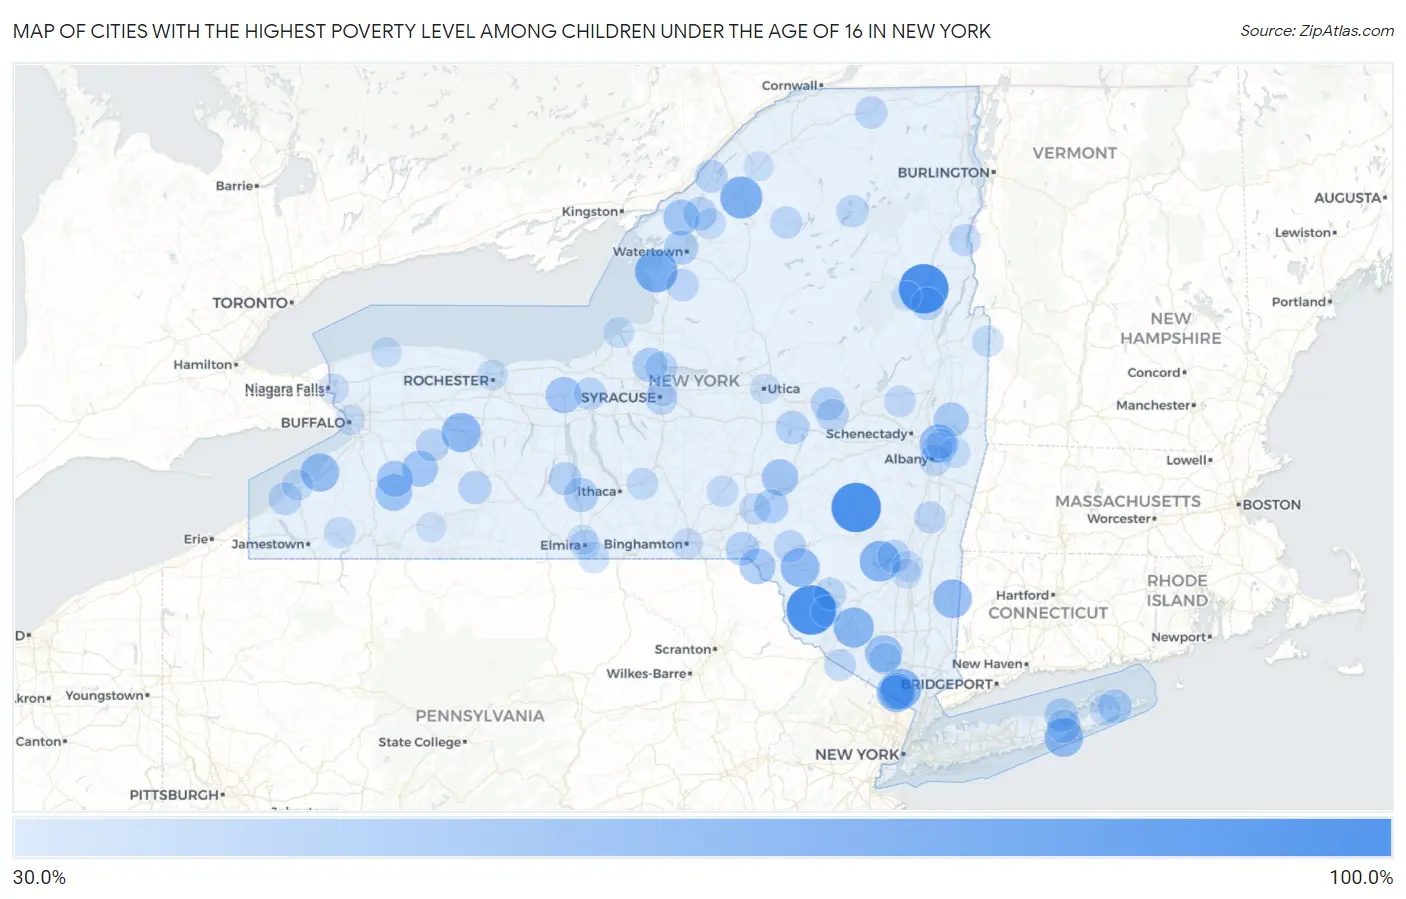
Map of Cities with the Highest Poverty Level Among Children Under the Age of 16 in New York
0.0%
100.0%
Cities with the Highest Poverty Level Among Children Under the Age of 16 in New York
| City | Child Poverty | vs State | vs National | |
| 1. | Fallsburg | 100.0% | 18.3%(+81.7)#1 | 16.9%(+83.1)#6 |
| 2. | Smallwood | 100.0% | 18.3%(+81.7)#2 | 16.9%(+83.1)#60 |
| 3. | West Danby | 100.0% | 18.3%(+81.7)#3 | 16.9%(+83.1)#200 |
| 4. | Pottersville | 100.0% | 18.3%(+81.7)#4 | 16.9%(+83.1)#269 |
| 5. | Prattsville | 100.0% | 18.3%(+81.7)#5 | 16.9%(+83.1)#343 |
| 6. | Hankins | 93.0% | 18.3%(+74.7)#6 | 16.9%(+76.1)#531 |
| 7. | Mount Vision | 82.6% | 18.3%(+64.3)#7 | 16.9%(+65.7)#766 |
| 8. | Henderson | 77.5% | 18.3%(+59.1)#8 | 16.9%(+60.5)#919 |
| 9. | Hailesboro | 76.2% | 18.3%(+57.9)#9 | 16.9%(+59.3)#970 |
| 10. | Shokan | 72.3% | 18.3%(+54.0)#10 | 16.9%(+55.4)#1,131 |
| 11. | Bloomingburg | 70.4% | 18.3%(+52.1)#11 | 16.9%(+53.5)#1,229 |
| 12. | New Square | 70.0% | 18.3%(+51.7)#12 | 16.9%(+53.1)#1,240 |
| 13. | Kaser | 67.6% | 18.3%(+49.2)#13 | 16.9%(+50.6)#1,353 |
| 14. | Wadsworth | 67.3% | 18.3%(+49.0)#14 | 16.9%(+50.4)#1,370 |
| 15. | Roscoe | 66.7% | 18.3%(+48.3)#15 | 16.9%(+49.7)#1,395 |
| 16. | Dover Plains | 66.2% | 18.3%(+47.9)#16 | 16.9%(+49.3)#1,431 |
| 17. | Quogue | 65.8% | 18.3%(+47.4)#17 | 16.9%(+48.8)#1,460 |
| 18. | Green Island | 65.5% | 18.3%(+47.2)#18 | 16.9%(+48.6)#1,468 |
| 19. | Sunset Bay | 64.5% | 18.3%(+46.2)#19 | 16.9%(+47.6)#1,530 |
| 20. | South Blooming Grove | 61.1% | 18.3%(+42.7)#20 | 16.9%(+44.2)#1,772 |
| 21. | South Ilion | 60.0% | 18.3%(+41.7)#21 | 16.9%(+43.1)#1,855 |
| 22. | Lime Lake | 59.7% | 18.3%(+41.4)#22 | 16.9%(+42.8)#1,883 |
| 23. | Westernville | 59.4% | 18.3%(+41.0)#23 | 16.9%(+42.4)#1,913 |
| 24. | Laurens | 58.8% | 18.3%(+40.5)#24 | 16.9%(+41.9)#1,951 |
| 25. | Lyons | 58.2% | 18.3%(+39.8)#25 | 16.9%(+41.3)#2,005 |
| 26. | Bliss | 57.9% | 18.3%(+39.5)#26 | 16.9%(+40.9)#2,030 |
| 27. | La Fargeville | 57.7% | 18.3%(+39.4)#27 | 16.9%(+40.8)#2,040 |
| 28. | Yorkshire | 57.5% | 18.3%(+39.2)#28 | 16.9%(+40.6)#2,057 |
| 29. | Hancock | 57.1% | 18.3%(+38.8)#29 | 16.9%(+40.2)#2,087 |
| 30. | Schaghticoke | 54.9% | 18.3%(+36.5)#30 | 16.9%(+37.9)#2,280 |
| 31. | Monsey | 54.1% | 18.3%(+35.8)#31 | 16.9%(+37.2)#2,362 |
| 32. | Sand Ridge | 53.1% | 18.3%(+34.8)#32 | 16.9%(+36.2)#2,441 |
| 33. | Burdett | 52.2% | 18.3%(+33.8)#33 | 16.9%(+35.2)#2,532 |
| 34. | Glen Park | 52.1% | 18.3%(+33.8)#34 | 16.9%(+35.2)#2,543 |
| 35. | Milton Cdp Ulster County | 51.4% | 18.3%(+33.0)#35 | 16.9%(+34.4)#2,624 |
| 36. | Franklin | 51.4% | 18.3%(+33.0)#36 | 16.9%(+34.4)#2,628 |
| 37. | Northville | 50.6% | 18.3%(+32.3)#37 | 16.9%(+33.7)#2,703 |
| 38. | Deposit | 50.6% | 18.3%(+32.2)#38 | 16.9%(+33.6)#2,705 |
| 39. | Springs | 50.5% | 18.3%(+32.2)#39 | 16.9%(+33.6)#2,707 |
| 40. | Sleepy Hollow Lake | 50.5% | 18.3%(+32.2)#40 | 16.9%(+33.6)#2,710 |
| 41. | Richfield Springs | 50.2% | 18.3%(+31.9)#41 | 16.9%(+33.3)#2,734 |
| 42. | Theresa | 50.0% | 18.3%(+31.7)#42 | 16.9%(+33.1)#2,752 |
| 43. | Flanders | 49.9% | 18.3%(+31.6)#43 | 16.9%(+33.0)#2,829 |
| 44. | St Johnsville | 49.8% | 18.3%(+31.4)#44 | 16.9%(+32.8)#2,841 |
| 45. | Grahamsville | 49.4% | 18.3%(+31.0)#45 | 16.9%(+32.4)#2,874 |
| 46. | Zena | 49.0% | 18.3%(+30.7)#46 | 16.9%(+32.1)#2,898 |
| 47. | Dundee | 48.9% | 18.3%(+30.6)#47 | 16.9%(+32.0)#2,910 |
| 48. | Canaseraga | 48.6% | 18.3%(+30.3)#48 | 16.9%(+31.7)#2,946 |
| 49. | Warsaw | 48.3% | 18.3%(+30.0)#49 | 16.9%(+31.4)#2,981 |
| 50. | Hammond | 48.0% | 18.3%(+29.7)#50 | 16.9%(+31.1)#3,019 |
| 51. | Fort Plain | 47.8% | 18.3%(+29.5)#51 | 16.9%(+30.9)#3,040 |
| 52. | Brocton | 47.6% | 18.3%(+29.3)#52 | 16.9%(+30.7)#3,059 |
| 53. | Chestertown | 47.5% | 18.3%(+29.1)#53 | 16.9%(+30.5)#3,091 |
| 54. | Lorraine | 47.1% | 18.3%(+28.7)#54 | 16.9%(+30.1)#3,150 |
| 55. | Malone | 46.6% | 18.3%(+28.2)#55 | 16.9%(+29.6)#3,224 |
| 56. | Savannah | 46.5% | 18.3%(+28.1)#56 | 16.9%(+29.5)#3,239 |
| 57. | Downsville | 46.3% | 18.3%(+28.0)#57 | 16.9%(+29.4)#3,260 |
| 58. | Syracuse | 46.3% | 18.3%(+28.0)#58 | 16.9%(+29.4)#3,264 |
| 59. | Brewerton | 46.3% | 18.3%(+28.0)#59 | 16.9%(+29.4)#3,271 |
| 60. | Loch Sheldrake | 46.3% | 18.3%(+27.9)#60 | 16.9%(+29.4)#3,272 |
| 61. | Tupper Lake | 46.2% | 18.3%(+27.9)#61 | 16.9%(+29.3)#3,281 |
| 62. | Star Lake | 46.0% | 18.3%(+27.6)#62 | 16.9%(+29.0)#3,319 |
| 63. | Unionville | 45.7% | 18.3%(+27.3)#63 | 16.9%(+28.7)#3,365 |
| 64. | Wassaic | 45.6% | 18.3%(+27.3)#64 | 16.9%(+28.7)#3,378 |
| 65. | Kiryas Joel | 45.6% | 18.3%(+27.2)#65 | 16.9%(+28.6)#3,384 |
| 66. | Port Henry | 45.5% | 18.3%(+27.1)#66 | 16.9%(+28.5)#3,401 |
| 67. | Lorenz Park | 45.3% | 18.3%(+26.9)#67 | 16.9%(+28.3)#3,430 |
| 68. | Galway | 44.9% | 18.3%(+26.6)#68 | 16.9%(+28.0)#3,494 |
| 69. | Rensselaer | 44.9% | 18.3%(+26.5)#69 | 16.9%(+27.9)#3,498 |
| 70. | Unadilla | 44.6% | 18.3%(+26.3)#70 | 16.9%(+27.7)#3,529 |
| 71. | Dryden | 44.6% | 18.3%(+26.2)#71 | 16.9%(+27.7)#3,538 |
| 72. | Oxford | 44.1% | 18.3%(+25.8)#72 | 16.9%(+27.2)#3,608 |
| 73. | East Randolph | 44.0% | 18.3%(+25.7)#73 | 16.9%(+27.1)#3,613 |
| 74. | Granville | 44.0% | 18.3%(+25.6)#74 | 16.9%(+27.0)#3,621 |
| 75. | Northwest Harbor | 43.8% | 18.3%(+25.4)#75 | 16.9%(+26.8)#3,638 |
| 76. | Wellsburg | 43.8% | 18.3%(+25.4)#76 | 16.9%(+26.8)#3,642 |
| 77. | Dunkirk | 43.4% | 18.3%(+25.0)#77 | 16.9%(+26.4)#3,710 |
| 78. | Ruby | 43.3% | 18.3%(+25.0)#78 | 16.9%(+26.4)#3,713 |
| 79. | Philadelphia | 42.8% | 18.3%(+24.4)#79 | 16.9%(+25.8)#3,828 |
| 80. | East Kingston | 42.6% | 18.3%(+24.3)#80 | 16.9%(+25.7)#3,850 |
| 81. | Binghamton | 42.4% | 18.3%(+24.0)#81 | 16.9%(+25.4)#3,893 |
| 82. | Poestenkill | 42.3% | 18.3%(+24.0)#82 | 16.9%(+25.4)#3,906 |
| 83. | Rochester | 42.2% | 18.3%(+23.9)#83 | 16.9%(+25.3)#3,928 |
| 84. | Monticello | 42.2% | 18.3%(+23.8)#84 | 16.9%(+25.2)#3,939 |
| 85. | Oswego | 42.1% | 18.3%(+23.8)#85 | 16.9%(+25.2)#3,948 |
| 86. | Springwater | 41.7% | 18.3%(+23.3)#86 | 16.9%(+24.7)#4,018 |
| 87. | Barker | 41.2% | 18.3%(+22.8)#87 | 16.9%(+24.2)#4,103 |
| 88. | Elmira | 41.1% | 18.3%(+22.8)#88 | 16.9%(+24.2)#4,119 |
| 89. | New Hamburg | 41.1% | 18.3%(+22.8)#89 | 16.9%(+24.2)#4,121 |
| 90. | Niagara Falls | 41.0% | 18.3%(+22.7)#90 | 16.9%(+24.1)#4,141 |
| 91. | Watervliet | 40.8% | 18.3%(+22.5)#91 | 16.9%(+23.9)#4,171 |
| 92. | Troy | 40.8% | 18.3%(+22.5)#92 | 16.9%(+23.9)#4,172 |
| 93. | Buffalo | 40.6% | 18.3%(+22.2)#93 | 16.9%(+23.6)#4,210 |
| 94. | Port Ewen | 40.6% | 18.3%(+22.2)#94 | 16.9%(+23.6)#4,213 |
| 95. | Elmira Heights | 40.5% | 18.3%(+22.1)#95 | 16.9%(+23.5)#4,227 |
| 96. | Dekalb Junction | 40.2% | 18.3%(+21.9)#96 | 16.9%(+23.3)#4,273 |
| 97. | Utica | 40.2% | 18.3%(+21.9)#97 | 16.9%(+23.3)#4,274 |
| 98. | Lyncourt | 40.1% | 18.3%(+21.7)#98 | 16.9%(+23.1)#4,296 |
| 99. | Friendship | 39.7% | 18.3%(+21.4)#99 | 16.9%(+22.8)#4,376 |
| 100. | North Creek | 39.6% | 18.3%(+21.3)#100 | 16.9%(+22.7)#4,389 |
Common Questions
What are the Top 10 Cities with the Highest Poverty Level Among Children Under the Age of 16 in New York?
Top 10 Cities with the Highest Poverty Level Among Children Under the Age of 16 in New York are:
#1
100.0%
#2
100.0%
#3
100.0%
#4
77.5%
#5
76.2%
#6
72.3%
#7
70.4%
#8
70.0%
#9
67.6%
#10
67.3%
What city has the Highest Poverty Level Among Children Under the Age of 16 in New York?
Smallwood has the Highest Poverty Level Among Children Under the Age of 16 in New York with 100.0%.
What is the Poverty Level Among Children Under the Age of 16 in the State of New York?
Poverty Level Among Children Under the Age of 16 in New York is 18.3%.
What is the Poverty Level Among Children Under the Age of 16 in the United States?
Poverty Level Among Children Under the Age of 16 in the United States is 16.9%.