Cities with the Highest Poverty Level Among Children Under the Age of 16 in Michigan
RELATED REPORTS & OPTIONS
Highest Poverty | Child 0-16
Michigan
Compare Cities
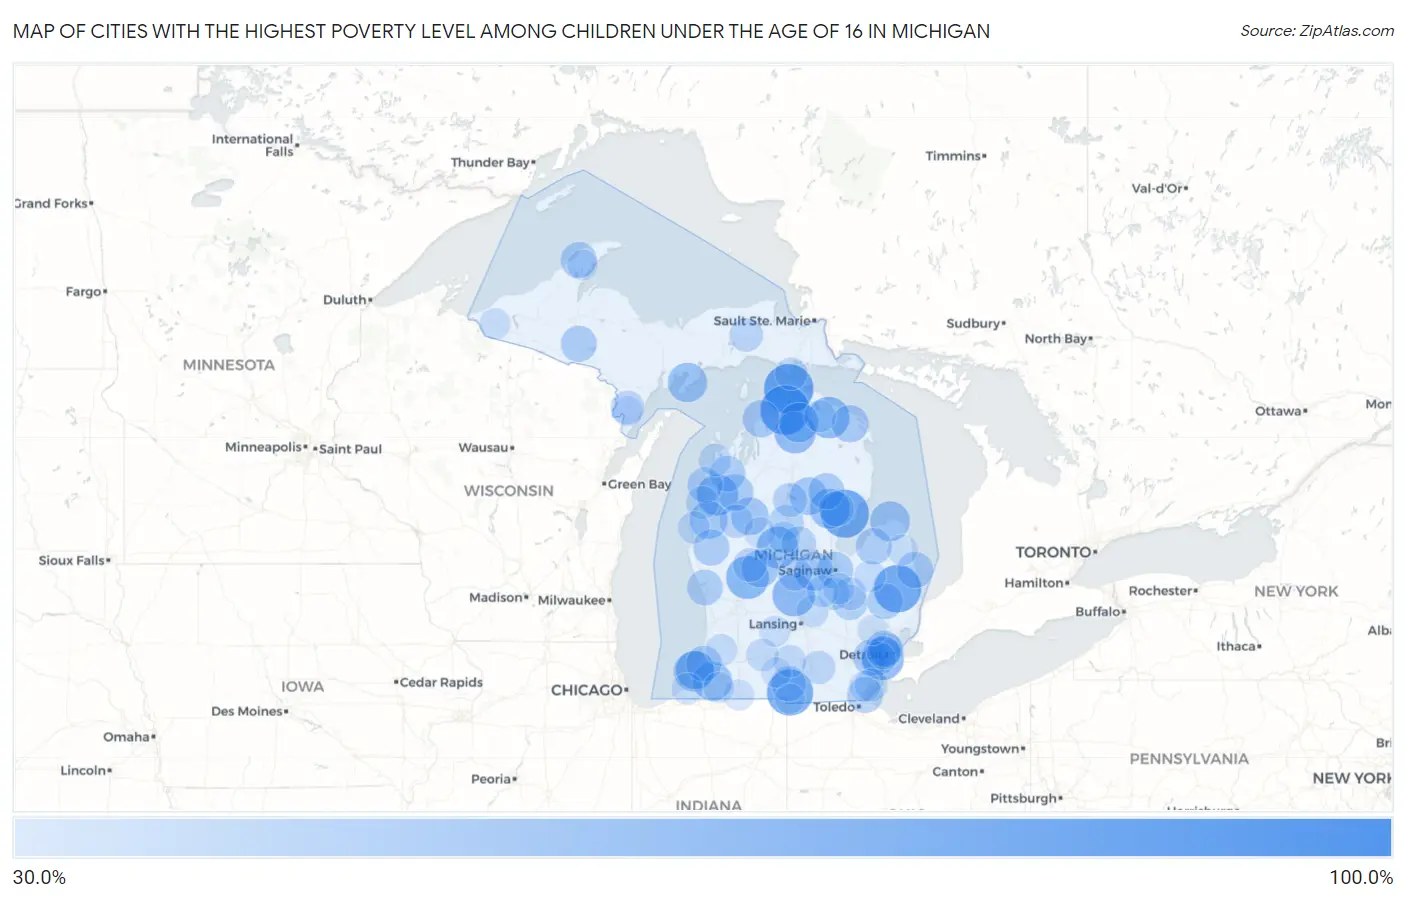
Map of Cities with the Highest Poverty Level Among Children Under the Age of 16 in Michigan
0.0%
100.0%
Cities with the Highest Poverty Level Among Children Under the Age of 16 in Michigan
| City | Child Poverty | vs State | vs National | |
| 1. | Paris | 100.0% | 18.2%(+81.8)#1 | 16.9%(+83.1)#161 |
| 2. | Riverdale | 100.0% | 18.2%(+81.8)#2 | 16.9%(+83.1)#198 |
| 3. | Cambria | 100.0% | 18.2%(+81.8)#3 | 16.9%(+83.1)#229 |
| 4. | Lake Gogebic | 100.0% | 18.2%(+81.8)#4 | 16.9%(+83.1)#311 |
| 5. | Naubinway | 100.0% | 18.2%(+81.8)#5 | 16.9%(+83.1)#385 |
| 6. | Rockland | 88.6% | 18.2%(+70.4)#6 | 16.9%(+71.7)#611 |
| 7. | Carp Lake | 85.0% | 18.2%(+66.8)#7 | 16.9%(+68.1)#707 |
| 8. | Oden | 84.6% | 18.2%(+66.4)#8 | 16.9%(+67.7)#720 |
| 9. | Turner | 81.2% | 18.2%(+63.0)#9 | 16.9%(+64.3)#807 |
| 10. | Winn | 80.6% | 18.2%(+62.4)#10 | 16.9%(+63.7)#822 |
| 11. | Melvin | 80.0% | 18.2%(+61.8)#11 | 16.9%(+63.1)#843 |
| 12. | Reading | 76.8% | 18.2%(+58.6)#12 | 16.9%(+59.9)#949 |
| 13. | Millburg | 73.9% | 18.2%(+55.7)#13 | 16.9%(+57.0)#1,063 |
| 14. | Pierson | 68.8% | 18.2%(+50.5)#14 | 16.9%(+51.8)#1,313 |
| 15. | River Rouge | 68.3% | 18.2%(+50.0)#15 | 16.9%(+51.4)#1,333 |
| 16. | Maple Rapids | 68.1% | 18.2%(+49.8)#16 | 16.9%(+51.1)#1,338 |
| 17. | Weidman | 65.9% | 18.2%(+47.6)#17 | 16.9%(+48.9)#1,455 |
| 18. | Millersburg | 65.2% | 18.2%(+47.0)#18 | 16.9%(+48.3)#1,495 |
| 19. | Vanderbilt | 65.1% | 18.2%(+46.8)#19 | 16.9%(+48.1)#1,501 |
| 20. | Kaleva | 64.4% | 18.2%(+46.1)#20 | 16.9%(+47.4)#1,544 |
| 21. | Kincheloe | 62.9% | 18.2%(+44.7)#21 | 16.9%(+46.0)#1,640 |
| 22. | Benton Harbor | 61.8% | 18.2%(+43.5)#22 | 16.9%(+44.9)#1,713 |
| 23. | Skidway Lake | 61.5% | 18.2%(+43.2)#23 | 16.9%(+44.5)#1,747 |
| 24. | Wolverine | 60.9% | 18.2%(+42.6)#24 | 16.9%(+43.9)#1,780 |
| 25. | Port Austin | 60.6% | 18.2%(+42.4)#25 | 16.9%(+43.7)#1,797 |
| 26. | Garden | 60.0% | 18.2%(+41.8)#26 | 16.9%(+43.1)#1,856 |
| 27. | Dowagiac | 59.4% | 18.2%(+41.2)#27 | 16.9%(+42.5)#1,908 |
| 28. | Merrill | 58.0% | 18.2%(+39.8)#28 | 16.9%(+41.1)#2,018 |
| 29. | Benton Heights | 57.8% | 18.2%(+39.5)#29 | 16.9%(+40.8)#2,037 |
| 30. | St Helen | 56.3% | 18.2%(+38.1)#30 | 16.9%(+39.4)#2,149 |
| 31. | Elm Hall | 56.2% | 18.2%(+38.0)#31 | 16.9%(+39.3)#2,159 |
| 32. | Fountain | 56.1% | 18.2%(+37.8)#32 | 16.9%(+39.2)#2,169 |
| 33. | Tustin | 55.8% | 18.2%(+37.5)#33 | 16.9%(+38.8)#2,197 |
| 34. | Lakeview | 54.8% | 18.2%(+36.6)#34 | 16.9%(+37.9)#2,284 |
| 35. | Posen | 54.7% | 18.2%(+36.5)#35 | 16.9%(+37.8)#2,296 |
| 36. | Charlevoix | 54.2% | 18.2%(+36.0)#36 | 16.9%(+37.3)#2,354 |
| 37. | Saginaw | 53.2% | 18.2%(+34.9)#37 | 16.9%(+36.2)#2,434 |
| 38. | Mesick | 52.8% | 18.2%(+34.6)#38 | 16.9%(+35.9)#2,472 |
| 39. | Owendale | 52.5% | 18.2%(+34.3)#39 | 16.9%(+35.6)#2,500 |
| 40. | Walkerville | 52.1% | 18.2%(+33.9)#40 | 16.9%(+35.2)#2,544 |
| 41. | Inkster | 52.0% | 18.2%(+33.8)#41 | 16.9%(+35.1)#2,550 |
| 42. | Pittsford | 51.9% | 18.2%(+33.7)#42 | 16.9%(+35.0)#2,562 |
| 43. | Port Sanilac | 51.9% | 18.2%(+33.6)#43 | 16.9%(+35.0)#2,564 |
| 44. | Calumet | 51.9% | 18.2%(+33.6)#44 | 16.9%(+34.9)#2,570 |
| 45. | Rose City | 51.9% | 18.2%(+33.6)#45 | 16.9%(+34.9)#2,571 |
| 46. | Amasa | 51.9% | 18.2%(+33.6)#46 | 16.9%(+34.9)#2,575 |
| 47. | Highland Park | 51.8% | 18.2%(+33.5)#47 | 16.9%(+34.8)#2,585 |
| 48. | Luna Pier | 51.5% | 18.2%(+33.2)#48 | 16.9%(+34.6)#2,607 |
| 49. | Imlay City | 51.2% | 18.2%(+32.9)#49 | 16.9%(+34.3)#2,648 |
| 50. | Muskegon Heights | 51.1% | 18.2%(+32.9)#50 | 16.9%(+34.2)#2,656 |
| 51. | Paw Paw Lake | 51.1% | 18.2%(+32.9)#51 | 16.9%(+34.2)#2,657 |
| 52. | Bendon | 51.0% | 18.2%(+32.8)#52 | 16.9%(+34.1)#2,665 |
| 53. | Allen | 50.0% | 18.2%(+31.8)#53 | 16.9%(+33.1)#2,786 |
| 54. | Arcadia | 50.0% | 18.2%(+31.8)#54 | 16.9%(+33.1)#2,797 |
| 55. | Prescott | 49.4% | 18.2%(+31.1)#55 | 16.9%(+32.4)#2,870 |
| 56. | Harrison | 49.3% | 18.2%(+31.0)#56 | 16.9%(+32.3)#2,880 |
| 57. | Flint | 49.2% | 18.2%(+31.0)#57 | 16.9%(+32.3)#2,882 |
| 58. | Tower | 48.8% | 18.2%(+30.6)#58 | 16.9%(+31.9)#2,927 |
| 59. | Coleman | 48.3% | 18.2%(+30.0)#59 | 16.9%(+31.3)#2,986 |
| 60. | Hamtramck | 47.4% | 18.2%(+29.2)#60 | 16.9%(+30.5)#3,098 |
| 61. | Mohawk | 47.4% | 18.2%(+29.1)#61 | 16.9%(+30.4)#3,105 |
| 62. | Houghton Lake | 47.1% | 18.2%(+28.9)#62 | 16.9%(+30.2)#3,140 |
| 63. | Alma | 46.3% | 18.2%(+28.1)#63 | 16.9%(+29.4)#3,265 |
| 64. | Morley | 46.3% | 18.2%(+28.0)#64 | 16.9%(+29.4)#3,269 |
| 65. | Luther | 45.9% | 18.2%(+27.7)#65 | 16.9%(+29.0)#3,325 |
| 66. | Daggett | 45.9% | 18.2%(+27.7)#66 | 16.9%(+29.0)#3,340 |
| 67. | Newberry | 45.6% | 18.2%(+27.4)#67 | 16.9%(+28.7)#3,373 |
| 68. | Melvindale | 45.5% | 18.2%(+27.2)#68 | 16.9%(+28.5)#3,398 |
| 69. | Napoleon | 45.1% | 18.2%(+26.8)#69 | 16.9%(+28.1)#3,457 |
| 70. | Detroit | 45.0% | 18.2%(+26.7)#70 | 16.9%(+28.0)#3,480 |
| 71. | Parkdale | 44.4% | 18.2%(+26.2)#71 | 16.9%(+27.5)#3,555 |
| 72. | Detroit Beach | 44.4% | 18.2%(+26.2)#72 | 16.9%(+27.5)#3,575 |
| 73. | Mount Morris | 44.2% | 18.2%(+25.9)#73 | 16.9%(+27.2)#3,600 |
| 74. | Empire | 43.7% | 18.2%(+25.4)#74 | 16.9%(+26.7)#3,661 |
| 75. | Albion | 43.2% | 18.2%(+25.0)#75 | 16.9%(+26.3)#3,736 |
| 76. | St Ignace | 43.2% | 18.2%(+24.9)#76 | 16.9%(+26.2)#3,748 |
| 77. | Springfield | 43.0% | 18.2%(+24.8)#77 | 16.9%(+26.1)#3,766 |
| 78. | New Lothrop | 43.0% | 18.2%(+24.7)#78 | 16.9%(+26.0)#3,777 |
| 79. | Ludington | 42.3% | 18.2%(+24.0)#79 | 16.9%(+25.4)#3,917 |
| 80. | Laingsburg | 42.1% | 18.2%(+23.9)#80 | 16.9%(+25.2)#3,947 |
| 81. | Onaway | 41.8% | 18.2%(+23.6)#81 | 16.9%(+24.9)#3,992 |
| 82. | Farwell | 41.8% | 18.2%(+23.6)#82 | 16.9%(+24.9)#3,994 |
| 83. | Bloomingdale | 41.4% | 18.2%(+23.1)#83 | 16.9%(+24.4)#4,070 |
| 84. | Oakley | 41.3% | 18.2%(+23.0)#84 | 16.9%(+24.3)#4,090 |
| 85. | New Troy | 41.2% | 18.2%(+22.9)#85 | 16.9%(+24.2)#4,107 |
| 86. | Mayville | 41.1% | 18.2%(+22.8)#86 | 16.9%(+24.1)#4,127 |
| 87. | Montrose | 40.8% | 18.2%(+22.5)#87 | 16.9%(+23.8)#4,178 |
| 88. | Vermontville | 40.1% | 18.2%(+21.9)#88 | 16.9%(+23.2)#4,291 |
| 89. | West Monroe | 40.0% | 18.2%(+21.8)#89 | 16.9%(+23.1)#4,301 |
| 90. | Wakefield | 40.0% | 18.2%(+21.8)#90 | 16.9%(+23.1)#4,302 |
| 91. | Lakeport | 39.9% | 18.2%(+21.6)#91 | 16.9%(+22.9)#4,356 |
| 92. | White Pigeon | 39.5% | 18.2%(+21.2)#92 | 16.9%(+22.6)#4,418 |
| 93. | Evart | 39.5% | 18.2%(+21.2)#93 | 16.9%(+22.5)#4,426 |
| 94. | Cassopolis | 39.4% | 18.2%(+21.2)#94 | 16.9%(+22.5)#4,431 |
| 95. | Minden City | 39.4% | 18.2%(+21.1)#95 | 16.9%(+22.5)#4,440 |
| 96. | Lake Linden | 39.0% | 18.2%(+20.7)#96 | 16.9%(+22.0)#4,522 |
| 97. | Tekonsha | 38.3% | 18.2%(+20.0)#97 | 16.9%(+21.3)#4,658 |
| 98. | Stephenson | 37.9% | 18.2%(+19.7)#98 | 16.9%(+21.0)#4,726 |
| 99. | Pontiac | 37.9% | 18.2%(+19.6)#99 | 16.9%(+21.0)#4,728 |
| 100. | Camden | 37.6% | 18.2%(+19.3)#100 | 16.9%(+20.6)#4,780 |
Common Questions
What are the Top 10 Cities with the Highest Poverty Level Among Children Under the Age of 16 in Michigan?
Top 10 Cities with the Highest Poverty Level Among Children Under the Age of 16 in Michigan are:
#1
85.0%
#2
84.6%
#3
81.2%
#4
80.0%
#5
76.8%
#6
68.8%
#7
68.3%
#8
68.1%
#9
65.9%
#10
65.2%
What city has the Highest Poverty Level Among Children Under the Age of 16 in Michigan?
Carp Lake has the Highest Poverty Level Among Children Under the Age of 16 in Michigan with 85.0%.
What is the Poverty Level Among Children Under the Age of 16 in the State of Michigan?
Poverty Level Among Children Under the Age of 16 in Michigan is 18.2%.
What is the Poverty Level Among Children Under the Age of 16 in the United States?
Poverty Level Among Children Under the Age of 16 in the United States is 16.9%.