Cities with the Highest Poverty Level Among Children Under the Age of 16 in Nevada
RELATED REPORTS & OPTIONS
Highest Poverty | Child 0-16
Nevada
Compare Cities
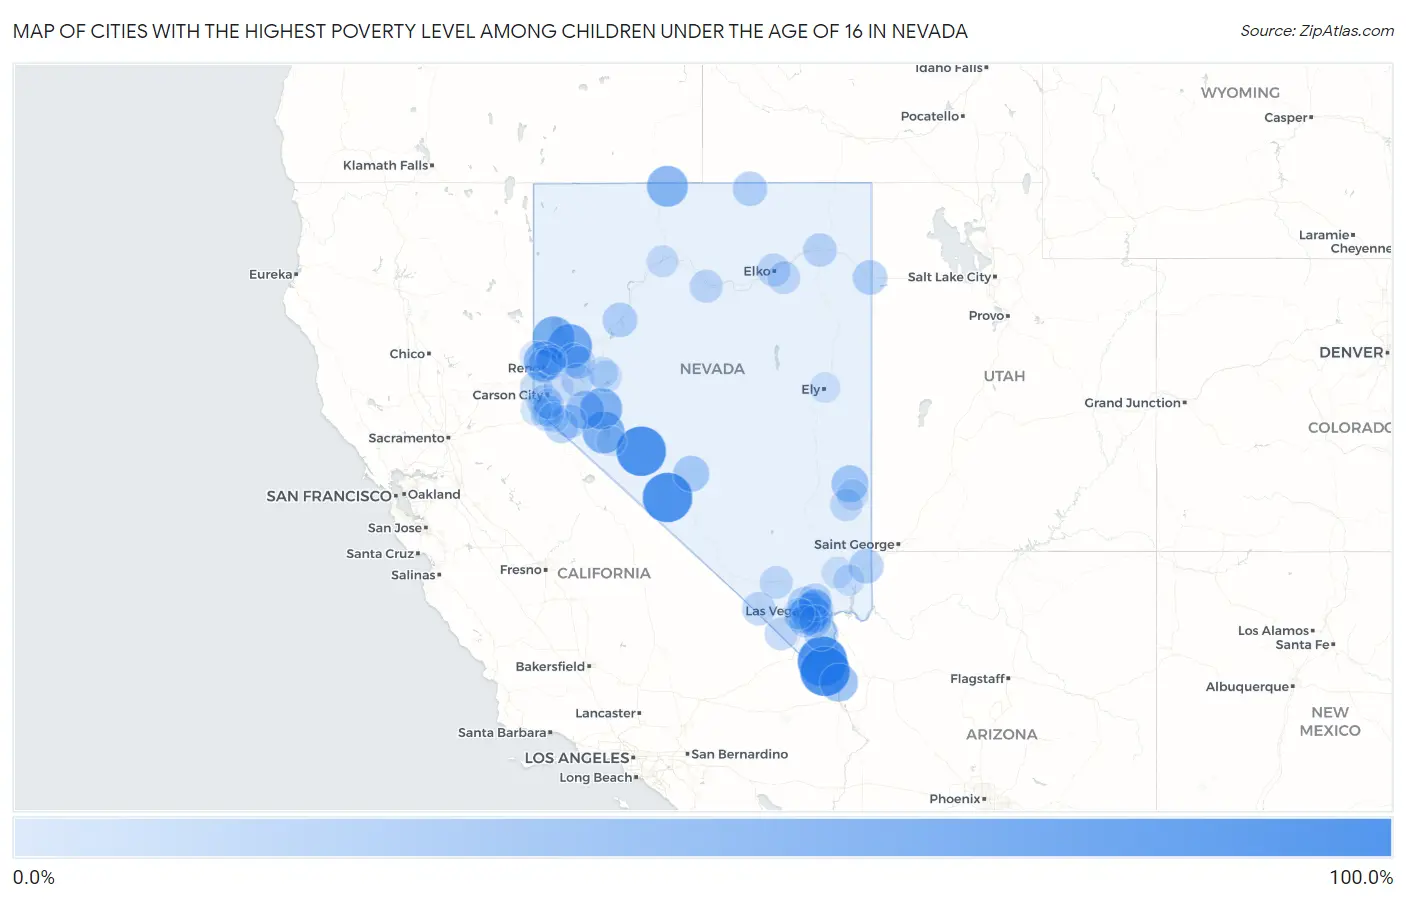
Map of Cities with the Highest Poverty Level Among Children Under the Age of 16 in Nevada
0.0%
100.0%
Cities with the Highest Poverty Level Among Children Under the Age of 16 in Nevada
| City | Child Poverty | vs State | vs National | |
| 1. | Searchlight | 100.0% | 17.2%(+82.8)#1 | 16.9%(+83.1)#162 |
| 2. | Cal Nev Ari | 100.0% | 17.2%(+82.8)#2 | 16.9%(+83.1)#171 |
| 3. | Silver Peak | 100.0% | 17.2%(+82.8)#3 | 16.9%(+83.1)#205 |
| 4. | Mina | 100.0% | 17.2%(+82.8)#4 | 16.9%(+83.1)#290 |
| 5. | Nixon | 71.8% | 17.2%(+54.6)#5 | 16.9%(+54.8)#1,153 |
| 6. | Sutcliffe | 61.9% | 17.2%(+44.7)#6 | 16.9%(+45.0)#1,708 |
| 7. | Walker Lake | 60.0% | 17.2%(+42.8)#7 | 16.9%(+43.1)#1,847 |
| 8. | Schurz | 59.9% | 17.2%(+42.7)#8 | 16.9%(+43.0)#1,869 |
| 9. | Fort Mcdermitt | 55.0% | 17.2%(+37.8)#9 | 16.9%(+38.1)#2,267 |
| 10. | Amargosa Valley | 50.4% | 17.2%(+33.2)#10 | 16.9%(+33.5)#2,720 |
| 11. | Golden Valley | 49.0% | 17.2%(+31.8)#11 | 16.9%(+32.0)#2,905 |
| 12. | Yerington | 41.2% | 17.2%(+24.0)#12 | 16.9%(+24.2)#4,100 |
| 13. | Winchester | 40.7% | 17.2%(+23.5)#13 | 16.9%(+23.8)#4,191 |
| 14. | Laughlin | 40.6% | 17.2%(+23.4)#14 | 16.9%(+23.6)#4,212 |
| 15. | Pioche | 34.2% | 17.2%(+17.0)#15 | 16.9%(+17.2)#5,537 |
| 16. | Sunrise Manor | 31.3% | 17.2%(+14.1)#16 | 16.9%(+14.3)#6,299 |
| 17. | Tonopah | 29.6% | 17.2%(+12.4)#17 | 16.9%(+12.6)#6,805 |
| 18. | Whitney | 25.7% | 17.2%(+8.56)#18 | 16.9%(+8.79)#8,105 |
| 19. | Paradise | 23.4% | 17.2%(+6.20)#19 | 16.9%(+6.43)#8,936 |
| 20. | Lovelock | 22.5% | 17.2%(+5.29)#20 | 16.9%(+5.52)#9,315 |
| 21. | Mesquite | 22.0% | 17.2%(+4.84)#21 | 16.9%(+5.07)#9,494 |
| 22. | West Wendover | 21.8% | 17.2%(+4.65)#22 | 16.9%(+4.88)#9,571 |
| 23. | Owyhee | 21.8% | 17.2%(+4.62)#23 | 16.9%(+4.85)#9,588 |
| 24. | Las Vegas | 20.4% | 17.2%(+3.21)#24 | 16.9%(+3.44)#10,200 |
| 25. | Boulder City | 19.5% | 17.2%(+2.34)#25 | 16.9%(+2.57)#10,600 |
| 26. | Spring Valley | 18.7% | 17.2%(+1.57)#26 | 16.9%(+1.79)#10,972 |
| 27. | Topaz Ranch Estates | 18.6% | 17.2%(+1.46)#27 | 16.9%(+1.69)#11,024 |
| 28. | Sun Valley | 18.2% | 17.2%(+0.983)#28 | 16.9%(+1.21)#11,269 |
| 29. | Wadsworth | 17.8% | 17.2%(+0.628)#29 | 16.9%(+0.858)#11,432 |
| 30. | Smith Valley | 17.5% | 17.2%(+0.307)#30 | 16.9%(+0.537)#11,561 |
| 31. | Wells | 17.0% | 17.2%(-0.169)#31 | 16.9%(+0.061)#11,814 |
| 32. | Pahrump | 16.0% | 17.2%(-1.16)#32 | 16.9%(-0.927)#12,321 |
| 33. | North Las Vegas | 15.7% | 17.2%(-1.44)#33 | 16.9%(-1.21)#12,477 |
| 34. | Indian Hills | 14.9% | 17.2%(-2.24)#34 | 16.9%(-2.01)#12,895 |
| 35. | Elko | 14.4% | 17.2%(-2.81)#35 | 16.9%(-2.58)#13,176 |
| 36. | Sandy Valley | 14.3% | 17.2%(-2.88)#36 | 16.9%(-2.65)#13,205 |
| 37. | Battle Mountain | 14.2% | 17.2%(-2.94)#37 | 16.9%(-2.71)#13,276 |
| 38. | Carson | 14.1% | 17.2%(-3.08)#38 | 16.9%(-2.85)#13,336 |
| 39. | Fernley | 13.9% | 17.2%(-3.22)#39 | 16.9%(-3.00)#13,426 |
| 40. | Reno | 13.9% | 17.2%(-3.23)#40 | 16.9%(-3.00)#13,429 |
| 41. | Indian Springs | 13.4% | 17.2%(-3.77)#41 | 16.9%(-3.54)#13,710 |
| 42. | Silver Springs | 13.2% | 17.2%(-3.92)#42 | 16.9%(-3.69)#13,793 |
| 43. | Spring Creek | 13.2% | 17.2%(-3.99)#43 | 16.9%(-3.76)#13,831 |
| 44. | Nellis Afb | 12.4% | 17.2%(-4.81)#44 | 16.9%(-4.58)#14,280 |
| 45. | Sparks | 11.6% | 17.2%(-5.57)#45 | 16.9%(-5.34)#14,738 |
| 46. | Incline Village | 11.4% | 17.2%(-5.78)#46 | 16.9%(-5.55)#14,862 |
| 47. | Gardnerville Ranchos | 11.2% | 17.2%(-6.00)#47 | 16.9%(-5.77)#14,993 |
| 48. | Caliente | 10.5% | 17.2%(-6.64)#48 | 16.9%(-6.41)#15,413 |
| 49. | Henderson | 10.3% | 17.2%(-6.88)#49 | 16.9%(-6.65)#15,549 |
| 50. | Enterprise | 9.9% | 17.2%(-7.26)#50 | 16.9%(-7.03)#15,788 |
| 51. | Winnemucca | 8.5% | 17.2%(-8.63)#51 | 16.9%(-8.40)#16,703 |
| 52. | Summerlin South | 8.4% | 17.2%(-8.72)#52 | 16.9%(-8.49)#16,762 |
| 53. | Fallon Station | 7.7% | 17.2%(-9.48)#53 | 16.9%(-9.25)#17,245 |
| 54. | Minden | 7.1% | 17.2%(-10.0)#54 | 16.9%(-9.80)#17,592 |
| 55. | Panaca | 7.0% | 17.2%(-10.1)#55 | 16.9%(-9.91)#17,688 |
| 56. | Gardnerville | 6.7% | 17.2%(-10.5)#56 | 16.9%(-10.3)#17,951 |
| 57. | Moapa Town | 6.4% | 17.2%(-10.7)#57 | 16.9%(-10.5)#18,104 |
| 58. | Fallon | 6.1% | 17.2%(-11.0)#58 | 16.9%(-10.8)#18,309 |
| 59. | Stateline | 5.6% | 17.2%(-11.6)#59 | 16.9%(-11.4)#18,723 |
| 60. | Moapa Valley | 5.3% | 17.2%(-11.9)#60 | 16.9%(-11.6)#18,907 |
| 61. | Cold Springs | 3.6% | 17.2%(-13.6)#61 | 16.9%(-13.4)#20,081 |
| 62. | Dayton | 3.2% | 17.2%(-14.0)#62 | 16.9%(-13.8)#20,369 |
| 63. | Ely | 2.9% | 17.2%(-14.3)#63 | 16.9%(-14.1)#20,567 |
| 64. | Spanish Springs | 2.5% | 17.2%(-14.7)#64 | 16.9%(-14.4)#20,846 |
| 65. | Johnson Lane | 1.6% | 17.2%(-15.6)#65 | 16.9%(-15.3)#21,453 |
| 66. | Carter Springs | 1.3% | 17.2%(-15.9)#66 | 16.9%(-15.7)#21,656 |
| 67. | Hawthorne | 1.0% | 17.2%(-16.1)#67 | 16.9%(-15.9)#21,794 |
1
2Common Questions
What are the Top 10 Cities with the Highest Poverty Level Among Children Under the Age of 16 in Nevada?
Top 10 Cities with the Highest Poverty Level Among Children Under the Age of 16 in Nevada are:
#1
100.0%
#2
100.0%
#3
100.0%
#4
100.0%
#5
71.8%
#6
61.9%
#7
60.0%
#8
59.9%
#9
55.0%
#10
49.0%
What city has the Highest Poverty Level Among Children Under the Age of 16 in Nevada?
Searchlight has the Highest Poverty Level Among Children Under the Age of 16 in Nevada with 100.0%.
What is the Poverty Level Among Children Under the Age of 16 in the State of Nevada?
Poverty Level Among Children Under the Age of 16 in Nevada is 17.2%.
What is the Poverty Level Among Children Under the Age of 16 in the United States?
Poverty Level Among Children Under the Age of 16 in the United States is 16.9%.