Cities with the Highest Poverty Level Among Children Under the Age of 16 in Utah
RELATED REPORTS & OPTIONS
Highest Poverty | Child 0-16
Utah
Compare Cities
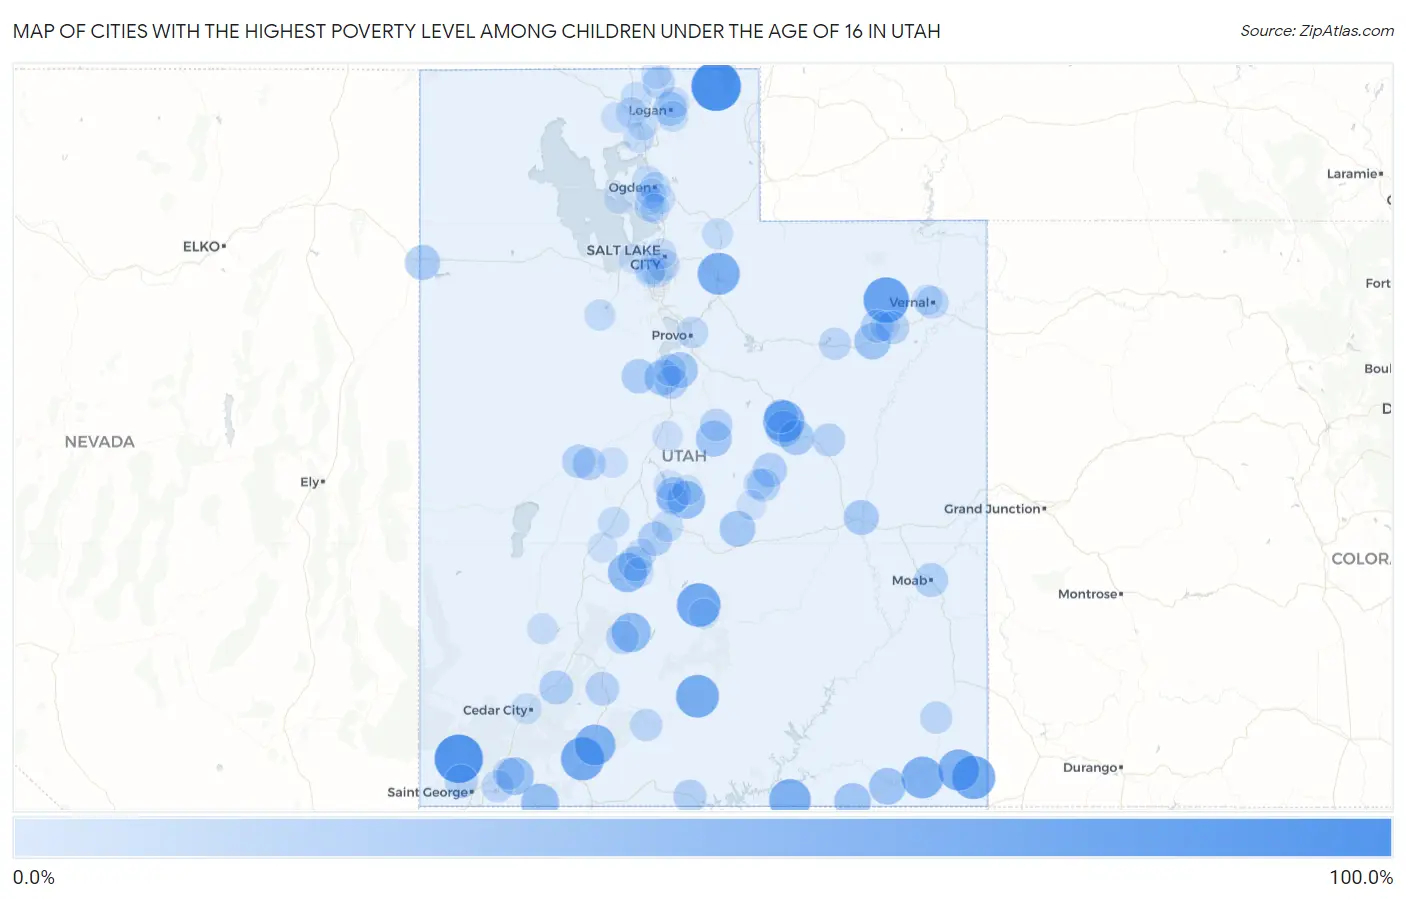
Map of Cities with the Highest Poverty Level Among Children Under the Age of 16 in Utah
0.0%
100.0%
Cities with the Highest Poverty Level Among Children Under the Age of 16 in Utah
| City | Child Poverty | vs State | vs National | |
| 1. | Garden | 100.0% | 9.0%(+91.0)#1 | 16.9%(+83.1)#304 |
| 2. | Veyo | 94.4% | 9.0%(+85.4)#2 | 16.9%(+77.4)#523 |
| 3. | Whiterocks | 79.8% | 9.0%(+70.9)#3 | 16.9%(+62.9)#849 |
| 4. | Lyman | 72.2% | 9.0%(+63.3)#4 | 16.9%(+55.3)#1,137 |
| 5. | Aneth | 70.2% | 9.0%(+61.2)#5 | 16.9%(+53.3)#1,234 |
| 6. | Glendale | 69.7% | 9.0%(+60.8)#6 | 16.9%(+52.8)#1,259 |
| 7. | Escalante | 68.6% | 9.0%(+59.6)#7 | 16.9%(+51.6)#1,318 |
| 8. | Hideout | 65.1% | 9.0%(+56.1)#8 | 16.9%(+48.1)#1,500 |
| 9. | Navajo Mountain | 63.4% | 9.0%(+54.5)#9 | 16.9%(+46.5)#1,604 |
| 10. | Tselakai Dezza | 63.3% | 9.0%(+54.4)#10 | 16.9%(+46.4)#1,615 |
| 11. | Spring Glen | 62.3% | 9.0%(+53.4)#11 | 16.9%(+45.4)#1,686 |
| 12. | Montezuma Creek | 61.5% | 9.0%(+52.6)#12 | 16.9%(+44.6)#1,742 |
| 13. | Alton | 59.7% | 9.0%(+50.7)#13 | 16.9%(+42.8)#1,892 |
| 14. | Kingston | 51.6% | 9.0%(+42.6)#14 | 16.9%(+34.6)#2,603 |
| 15. | Joseph | 51.5% | 9.0%(+42.5)#15 | 16.9%(+34.5)#2,612 |
| 16. | Hildale | 45.5% | 9.0%(+36.5)#16 | 16.9%(+28.5)#3,399 |
| 17. | Mayfield | 44.8% | 9.0%(+35.9)#17 | 16.9%(+27.9)#3,502 |
| 18. | Virgin | 44.2% | 9.0%(+35.2)#18 | 16.9%(+27.2)#3,598 |
| 19. | Halchita | 40.7% | 9.0%(+31.8)#19 | 16.9%(+23.8)#4,184 |
| 20. | Oljato Monument Valley | 39.0% | 9.0%(+30.0)#20 | 16.9%(+22.0)#4,520 |
| 21. | Myton | 38.9% | 9.0%(+29.9)#21 | 16.9%(+21.9)#4,538 |
| 22. | Mount Pleasant | 37.3% | 9.0%(+28.3)#22 | 16.9%(+20.3)#4,853 |
| 23. | West Wood | 36.8% | 9.0%(+27.8)#23 | 16.9%(+19.8)#4,957 |
| 24. | Goshen | 36.7% | 9.0%(+27.8)#24 | 16.9%(+19.8)#4,963 |
| 25. | Emery | 36.7% | 9.0%(+27.8)#25 | 16.9%(+19.8)#4,968 |
| 26. | Spring Lake | 35.6% | 9.0%(+26.6)#26 | 16.9%(+18.7)#5,200 |
| 27. | Gunnison | 34.7% | 9.0%(+25.7)#27 | 16.9%(+17.8)#5,423 |
| 28. | Wellington | 33.4% | 9.0%(+24.5)#28 | 16.9%(+16.5)#5,699 |
| 29. | Wendover | 33.1% | 9.0%(+24.2)#29 | 16.9%(+16.2)#5,816 |
| 30. | Green River | 32.6% | 9.0%(+23.6)#30 | 16.9%(+15.7)#5,932 |
| 31. | Elsinore | 31.1% | 9.0%(+22.1)#31 | 16.9%(+14.2)#6,359 |
| 32. | Eureka | 30.1% | 9.0%(+21.2)#32 | 16.9%(+13.2)#6,657 |
| 33. | Sigurd | 29.1% | 9.0%(+20.1)#33 | 16.9%(+12.1)#6,952 |
| 34. | Huntington | 28.7% | 9.0%(+19.7)#34 | 16.9%(+11.8)#7,053 |
| 35. | Parowan | 28.1% | 9.0%(+19.2)#35 | 16.9%(+11.2)#7,217 |
| 36. | Helper | 28.1% | 9.0%(+19.1)#36 | 16.9%(+11.1)#7,237 |
| 37. | Moab | 27.7% | 9.0%(+18.7)#37 | 16.9%(+10.8)#7,372 |
| 38. | Logan | 27.6% | 9.0%(+18.7)#38 | 16.9%(+10.7)#7,391 |
| 39. | Panguitch | 26.2% | 9.0%(+17.3)#39 | 16.9%(+9.27)#7,918 |
| 40. | Big Water | 25.5% | 9.0%(+16.5)#40 | 16.9%(+8.52)#8,192 |
| 41. | Sutherland | 25.5% | 9.0%(+16.5)#41 | 16.9%(+8.52)#8,193 |
| 42. | Ivins | 25.3% | 9.0%(+16.4)#42 | 16.9%(+8.40)#8,235 |
| 43. | Fort Duchesne | 25.0% | 9.0%(+16.0)#43 | 16.9%(+8.06)#8,342 |
| 44. | Rocky Ridge | 24.8% | 9.0%(+15.9)#44 | 16.9%(+7.90)#8,426 |
| 45. | Delta | 24.5% | 9.0%(+15.5)#45 | 16.9%(+7.55)#8,541 |
| 46. | East Carbon | 24.3% | 9.0%(+15.3)#46 | 16.9%(+7.32)#8,627 |
| 47. | Roosevelt | 24.2% | 9.0%(+15.2)#47 | 16.9%(+7.26)#8,650 |
| 48. | Castle Dale | 24.1% | 9.0%(+15.2)#48 | 16.9%(+7.21)#8,664 |
| 49. | Circleville | 23.9% | 9.0%(+14.9)#49 | 16.9%(+6.94)#8,755 |
| 50. | Fairview | 22.3% | 9.0%(+13.3)#50 | 16.9%(+5.33)#9,381 |
| 51. | Vernal | 21.2% | 9.0%(+12.2)#51 | 16.9%(+4.23)#9,850 |
| 52. | Cannonville | 20.8% | 9.0%(+11.8)#52 | 16.9%(+3.82)#10,026 |
| 53. | Blanding | 20.7% | 9.0%(+11.8)#53 | 16.9%(+3.80)#10,028 |
| 54. | Hurricane | 20.5% | 9.0%(+11.5)#54 | 16.9%(+3.57)#10,144 |
| 55. | Duchesne | 20.4% | 9.0%(+11.4)#55 | 16.9%(+3.46)#10,191 |
| 56. | Genola | 20.3% | 9.0%(+11.3)#56 | 16.9%(+3.37)#10,236 |
| 57. | Trenton | 20.0% | 9.0%(+11.0)#57 | 16.9%(+3.06)#10,362 |
| 58. | La Verkin | 19.7% | 9.0%(+10.8)#58 | 16.9%(+2.80)#10,509 |
| 59. | South Salt Lake | 19.6% | 9.0%(+10.7)#59 | 16.9%(+2.67)#10,560 |
| 60. | Centerfield | 19.3% | 9.0%(+10.3)#60 | 16.9%(+2.34)#10,710 |
| 61. | Provo | 17.6% | 9.0%(+8.65)#61 | 16.9%(+0.668)#11,513 |
| 62. | Clearfield | 17.3% | 9.0%(+8.37)#62 | 16.9%(+0.394)#11,644 |
| 63. | Marriott Slaterville | 16.9% | 9.0%(+7.89)#63 | 16.9%(-0.088)#11,877 |
| 64. | Salina | 16.3% | 9.0%(+7.31)#64 | 16.9%(-0.669)#12,166 |
| 65. | Fillmore | 16.2% | 9.0%(+7.27)#65 | 16.9%(-0.703)#12,177 |
| 66. | Rush Valley | 16.1% | 9.0%(+7.17)#66 | 16.9%(-0.810)#12,255 |
| 67. | West Valley City | 15.6% | 9.0%(+6.60)#67 | 16.9%(-1.38)#12,552 |
| 68. | Coalville | 15.3% | 9.0%(+6.36)#68 | 16.9%(-1.62)#12,685 |
| 69. | Orangeville | 15.1% | 9.0%(+6.16)#69 | 16.9%(-1.82)#12,802 |
| 70. | North Logan | 15.1% | 9.0%(+6.15)#70 | 16.9%(-1.83)#12,805 |
| 71. | Riverside | 14.9% | 9.0%(+5.97)#71 | 16.9%(-2.01)#12,898 |
| 72. | Millville | 14.9% | 9.0%(+5.95)#72 | 16.9%(-2.03)#12,905 |
| 73. | Ogden | 14.9% | 9.0%(+5.90)#73 | 16.9%(-2.08)#12,934 |
| 74. | Tremonton | 14.8% | 9.0%(+5.79)#74 | 16.9%(-2.19)#12,987 |
| 75. | Richfield | 13.8% | 9.0%(+4.85)#75 | 16.9%(-3.13)#13,488 |
| 76. | Cedar City | 13.8% | 9.0%(+4.80)#76 | 16.9%(-3.18)#13,523 |
| 77. | Minersville | 13.7% | 9.0%(+4.70)#77 | 16.9%(-3.28)#13,564 |
| 78. | Corinne | 13.5% | 9.0%(+4.57)#78 | 16.9%(-3.41)#13,638 |
| 79. | Honeyville | 13.3% | 9.0%(+4.33)#79 | 16.9%(-3.65)#13,773 |
| 80. | Taylorsville | 13.3% | 9.0%(+4.29)#80 | 16.9%(-3.69)#13,790 |
| 81. | Salt Lake City | 13.2% | 9.0%(+4.26)#81 | 16.9%(-3.71)#13,802 |
| 82. | Maeser | 13.1% | 9.0%(+4.19)#82 | 16.9%(-3.79)#13,846 |
| 83. | Thatcher | 13.0% | 9.0%(+4.06)#83 | 16.9%(-3.92)#13,918 |
| 84. | Fayette | 13.0% | 9.0%(+4.00)#84 | 16.9%(-3.98)#13,943 |
| 85. | Cornish | 12.9% | 9.0%(+3.90)#85 | 16.9%(-4.08)#14,000 |
| 86. | Uintah | 12.8% | 9.0%(+3.81)#86 | 16.9%(-4.17)#14,041 |
| 87. | Sunset | 12.4% | 9.0%(+3.47)#87 | 16.9%(-4.51)#14,244 |
| 88. | Oak City | 12.3% | 9.0%(+3.34)#88 | 16.9%(-4.64)#14,316 |
| 89. | Levan | 12.1% | 9.0%(+3.12)#89 | 16.9%(-4.86)#14,450 |
| 90. | Sterling | 11.8% | 9.0%(+2.80)#90 | 16.9%(-5.17)#14,642 |
| 91. | Kearns | 11.6% | 9.0%(+2.62)#91 | 16.9%(-5.36)#14,757 |
| 92. | Riverdale | 11.5% | 9.0%(+2.56)#92 | 16.9%(-5.42)#14,794 |
| 93. | Monroe | 11.3% | 9.0%(+2.37)#93 | 16.9%(-5.61)#14,900 |
| 94. | Ballard | 11.3% | 9.0%(+2.33)#94 | 16.9%(-5.65)#14,924 |
| 95. | Bicknell | 11.3% | 9.0%(+2.29)#95 | 16.9%(-5.69)#14,944 |
| 96. | Layton | 11.2% | 9.0%(+2.27)#96 | 16.9%(-5.71)#14,957 |
| 97. | Magna | 11.1% | 9.0%(+2.14)#97 | 16.9%(-5.84)#15,065 |
| 98. | Hooper | 11.0% | 9.0%(+2.04)#98 | 16.9%(-5.94)#15,127 |
| 99. | Kanosh | 11.0% | 9.0%(+2.03)#99 | 16.9%(-5.94)#15,130 |
| 100. | Ferron | 10.9% | 9.0%(+1.93)#100 | 16.9%(-6.05)#15,188 |
Common Questions
What are the Top 10 Cities with the Highest Poverty Level Among Children Under the Age of 16 in Utah?
Top 10 Cities with the Highest Poverty Level Among Children Under the Age of 16 in Utah are:
#1
100.0%
#2
94.4%
#3
79.8%
#4
72.2%
#5
70.2%
#6
69.7%
#7
68.6%
#8
65.1%
#9
63.4%
#10
63.3%
What city has the Highest Poverty Level Among Children Under the Age of 16 in Utah?
Garden has the Highest Poverty Level Among Children Under the Age of 16 in Utah with 100.0%.
What is the Poverty Level Among Children Under the Age of 16 in the State of Utah?
Poverty Level Among Children Under the Age of 16 in Utah is 9.0%.
What is the Poverty Level Among Children Under the Age of 16 in the United States?
Poverty Level Among Children Under the Age of 16 in the United States is 16.9%.