Cities with the Highest Poverty Level Among Children Under the Age of 16 in North Carolina
RELATED REPORTS & OPTIONS
Highest Poverty | Child 0-16
North Carolina
Compare Cities
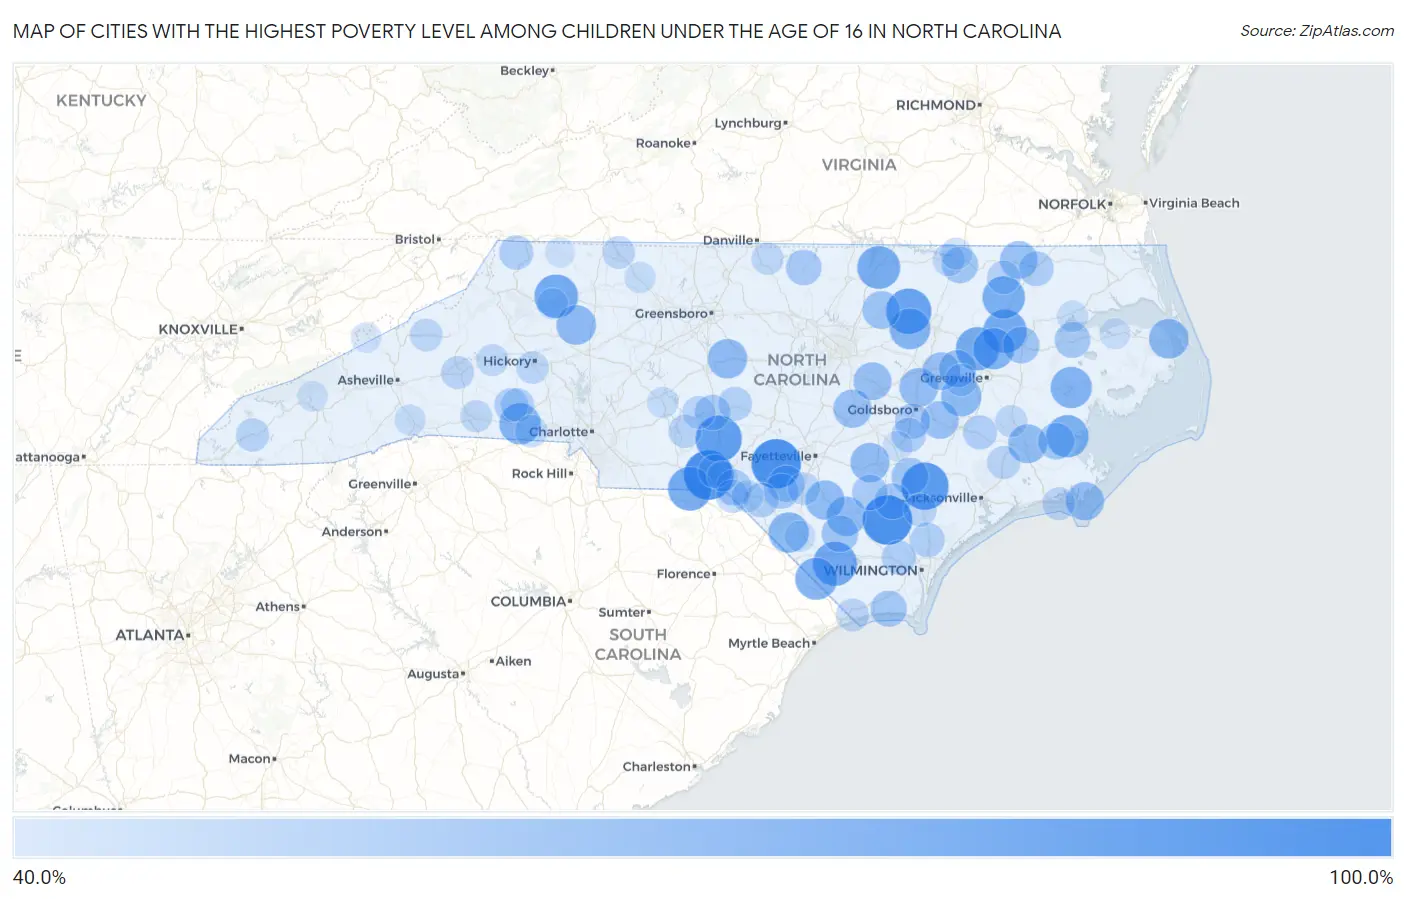
Map of Cities with the Highest Poverty Level Among Children Under the Age of 16 in North Carolina
0.0%
100.0%
Cities with the Highest Poverty Level Among Children Under the Age of 16 in North Carolina
| City | Child Poverty | vs State | vs National | |
| 1. | Cordova | 100.0% | 18.9%(+81.1)#1 | 16.9%(+83.1)#13 |
| 2. | Silver City | 100.0% | 18.9%(+81.1)#2 | 16.9%(+83.1)#45 |
| 3. | Ivanhoe | 100.0% | 18.9%(+81.1)#3 | 16.9%(+83.1)#100 |
| 4. | Chowan Beach | 100.0% | 18.9%(+81.1)#4 | 16.9%(+83.1)#113 |
| 5. | Greenevers | 93.8% | 18.9%(+74.9)#5 | 16.9%(+76.9)#527 |
| 6. | Norman | 90.9% | 18.9%(+72.0)#6 | 16.9%(+74.0)#561 |
| 7. | Castalia | 88.4% | 18.9%(+69.4)#7 | 16.9%(+71.4)#616 |
| 8. | Brunswick | 85.2% | 18.9%(+66.3)#8 | 16.9%(+68.3)#702 |
| 9. | Mcfarlan | 83.9% | 18.9%(+64.9)#9 | 16.9%(+66.9)#739 |
| 10. | Fairplains | 83.6% | 18.9%(+64.7)#10 | 16.9%(+66.7)#743 |
| 11. | Hamilton | 83.3% | 18.9%(+64.4)#11 | 16.9%(+66.4)#754 |
| 12. | Conetoe | 82.8% | 18.9%(+63.9)#12 | 16.9%(+65.9)#765 |
| 13. | Middleburg | 81.7% | 18.9%(+62.8)#13 | 16.9%(+64.8)#795 |
| 14. | Kelford | 80.6% | 18.9%(+61.6)#14 | 16.9%(+63.6)#824 |
| 15. | Vandemere | 80.0% | 18.9%(+61.1)#15 | 16.9%(+63.1)#841 |
| 16. | Tabor City | 79.3% | 18.9%(+60.3)#16 | 16.9%(+62.3)#864 |
| 17. | Light Oak | 77.5% | 18.9%(+58.5)#17 | 16.9%(+60.5)#916 |
| 18. | Parmele | 77.3% | 18.9%(+58.3)#18 | 16.9%(+60.3)#926 |
| 19. | Belhaven | 77.0% | 18.9%(+58.1)#19 | 16.9%(+60.1)#943 |
| 20. | Momeyer | 76.0% | 18.9%(+57.0)#20 | 16.9%(+59.0)#983 |
| 21. | Fairmont | 74.7% | 18.9%(+55.7)#21 | 16.9%(+57.7)#1,034 |
| 22. | Maury | 74.1% | 18.9%(+55.1)#22 | 16.9%(+57.1)#1,057 |
| 23. | Manns Harbor | 72.7% | 18.9%(+53.8)#23 | 16.9%(+55.8)#1,110 |
| 24. | Love Valley | 72.7% | 18.9%(+53.8)#24 | 16.9%(+55.8)#1,114 |
| 25. | Ramseur | 72.4% | 18.9%(+53.4)#25 | 16.9%(+55.4)#1,129 |
| 26. | Elizabethtown | 71.5% | 18.9%(+52.6)#26 | 16.9%(+54.6)#1,158 |
| 27. | Tar Heel | 71.4% | 18.9%(+52.5)#27 | 16.9%(+54.5)#1,170 |
| 28. | Bonnetsville | 71.3% | 18.9%(+52.4)#28 | 16.9%(+54.4)#1,184 |
| 29. | Bridgeton | 70.7% | 18.9%(+51.8)#29 | 16.9%(+53.8)#1,211 |
| 30. | Fremont | 70.5% | 18.9%(+51.5)#30 | 16.9%(+53.5)#1,226 |
| 31. | Marshallberg | 69.0% | 18.9%(+50.0)#31 | 16.9%(+52.0)#1,301 |
| 32. | Benson | 68.9% | 18.9%(+49.9)#32 | 16.9%(+51.9)#1,307 |
| 33. | Saratoga | 68.3% | 18.9%(+49.4)#33 | 16.9%(+51.4)#1,331 |
| 34. | Wilson S Mills | 68.1% | 18.9%(+49.1)#34 | 16.9%(+51.1)#1,340 |
| 35. | Murfreesboro | 67.6% | 18.9%(+48.6)#35 | 16.9%(+50.6)#1,354 |
| 36. | La Grange | 67.4% | 18.9%(+48.5)#36 | 16.9%(+50.5)#1,368 |
| 37. | Louisburg | 67.1% | 18.9%(+48.2)#37 | 16.9%(+50.2)#1,382 |
| 38. | Fountain | 66.7% | 18.9%(+47.7)#38 | 16.9%(+49.7)#1,396 |
| 39. | Magnolia | 65.2% | 18.9%(+46.2)#39 | 16.9%(+48.2)#1,497 |
| 40. | Williamston | 64.5% | 18.9%(+45.6)#40 | 16.9%(+47.6)#1,526 |
| 41. | Clarkton | 64.5% | 18.9%(+45.6)#41 | 16.9%(+47.6)#1,528 |
| 42. | Bayboro | 64.4% | 18.9%(+45.5)#42 | 16.9%(+47.5)#1,535 |
| 43. | Shannon | 64.2% | 18.9%(+45.2)#43 | 16.9%(+47.2)#1,561 |
| 44. | South Weldon | 63.8% | 18.9%(+44.9)#44 | 16.9%(+46.9)#1,572 |
| 45. | Varnamtown | 63.2% | 18.9%(+44.3)#45 | 16.9%(+46.3)#1,620 |
| 46. | Roper | 62.5% | 18.9%(+43.6)#46 | 16.9%(+45.6)#1,662 |
| 47. | Old Hundred | 62.5% | 18.9%(+43.6)#47 | 16.9%(+45.6)#1,665 |
| 48. | Harrells | 62.2% | 18.9%(+43.3)#48 | 16.9%(+45.3)#1,695 |
| 49. | Garland | 61.7% | 18.9%(+42.8)#49 | 16.9%(+44.8)#1,719 |
| 50. | Roxboro | 61.6% | 18.9%(+42.7)#50 | 16.9%(+44.7)#1,725 |
| 51. | Brogden | 61.4% | 18.9%(+42.4)#51 | 16.9%(+44.4)#1,752 |
| 52. | Biscoe | 61.2% | 18.9%(+42.3)#52 | 16.9%(+44.3)#1,757 |
| 53. | Red Springs | 60.6% | 18.9%(+41.7)#53 | 16.9%(+43.7)#1,795 |
| 54. | Winton | 59.8% | 18.9%(+40.8)#54 | 16.9%(+42.8)#1,881 |
| 55. | Mount Olive | 59.1% | 18.9%(+40.2)#55 | 16.9%(+42.2)#1,929 |
| 56. | Maxton | 59.1% | 18.9%(+40.2)#56 | 16.9%(+42.2)#1,930 |
| 57. | Rocky Point | 58.8% | 18.9%(+39.8)#57 | 16.9%(+41.8)#1,957 |
| 58. | Lansing | 58.3% | 18.9%(+39.4)#58 | 16.9%(+41.4)#1,990 |
| 59. | Lawndale | 57.7% | 18.9%(+38.7)#59 | 16.9%(+40.7)#2,045 |
| 60. | Northwest | 57.6% | 18.9%(+38.7)#60 | 16.9%(+40.7)#2,050 |
| 61. | Dover | 57.6% | 18.9%(+38.6)#61 | 16.9%(+40.6)#2,053 |
| 62. | Robbins | 57.4% | 18.9%(+38.4)#62 | 16.9%(+40.4)#2,070 |
| 63. | Arrowhead Beach | 57.2% | 18.9%(+38.3)#63 | 16.9%(+40.3)#2,084 |
| 64. | Rockingham | 56.5% | 18.9%(+37.6)#64 | 16.9%(+39.6)#2,140 |
| 65. | Fallston | 56.3% | 18.9%(+37.4)#65 | 16.9%(+39.4)#2,151 |
| 66. | Woodland | 56.2% | 18.9%(+37.3)#66 | 16.9%(+39.3)#2,165 |
| 67. | Gibson | 55.6% | 18.9%(+36.7)#67 | 16.9%(+38.7)#2,204 |
| 68. | Andrews | 55.6% | 18.9%(+36.6)#68 | 16.9%(+38.6)#2,212 |
| 69. | Pollocksville | 55.4% | 18.9%(+36.4)#69 | 16.9%(+38.4)#2,238 |
| 70. | Mount Gilead | 55.3% | 18.9%(+36.3)#70 | 16.9%(+38.3)#2,241 |
| 71. | Watha | 55.3% | 18.9%(+36.3)#71 | 16.9%(+38.3)#2,245 |
| 72. | Calabash | 54.7% | 18.9%(+35.8)#72 | 16.9%(+37.8)#2,294 |
| 73. | West Marion | 54.7% | 18.9%(+35.7)#73 | 16.9%(+37.7)#2,299 |
| 74. | Atlantic Beach | 54.6% | 18.9%(+35.7)#74 | 16.9%(+37.7)#2,303 |
| 75. | Troy | 54.5% | 18.9%(+35.5)#75 | 16.9%(+37.5)#2,327 |
| 76. | Mount Airy | 54.0% | 18.9%(+35.1)#76 | 16.9%(+37.1)#2,369 |
| 77. | Burnsville | 53.9% | 18.9%(+34.9)#77 | 16.9%(+36.9)#2,379 |
| 78. | St Pauls | 53.7% | 18.9%(+34.8)#78 | 16.9%(+36.8)#2,395 |
| 79. | Kings Mountain | 53.5% | 18.9%(+34.6)#79 | 16.9%(+36.6)#2,399 |
| 80. | Mountain View | 53.3% | 18.9%(+34.4)#80 | 16.9%(+36.4)#2,411 |
| 81. | South Rosemary | 53.0% | 18.9%(+34.1)#81 | 16.9%(+36.1)#2,451 |
| 82. | Yanceyville | 53.0% | 18.9%(+34.1)#82 | 16.9%(+36.1)#2,453 |
| 83. | Farmville | 52.9% | 18.9%(+34.0)#83 | 16.9%(+36.0)#2,462 |
| 84. | Vanceboro | 52.4% | 18.9%(+33.5)#84 | 16.9%(+35.5)#2,506 |
| 85. | Forest City | 52.2% | 18.9%(+33.3)#85 | 16.9%(+35.3)#2,529 |
| 86. | Laurinburg | 52.1% | 18.9%(+33.2)#86 | 16.9%(+35.2)#2,542 |
| 87. | Morganton | 52.0% | 18.9%(+33.1)#87 | 16.9%(+35.1)#2,554 |
| 88. | Gaston | 51.6% | 18.9%(+32.7)#88 | 16.9%(+34.7)#2,592 |
| 89. | Edenton | 50.4% | 18.9%(+31.4)#89 | 16.9%(+33.4)#2,721 |
| 90. | Wilkesboro | 50.2% | 18.9%(+31.3)#90 | 16.9%(+33.3)#2,731 |
| 91. | Pinnacle | 50.0% | 18.9%(+31.1)#91 | 16.9%(+33.1)#2,755 |
| 92. | New London | 50.0% | 18.9%(+31.1)#92 | 16.9%(+33.1)#2,758 |
| 93. | Orrum | 50.0% | 18.9%(+31.1)#93 | 16.9%(+33.1)#2,819 |
| 94. | Barker Heights | 49.7% | 18.9%(+30.8)#94 | 16.9%(+32.8)#2,843 |
| 95. | Columbia | 49.3% | 18.9%(+30.3)#95 | 16.9%(+32.3)#2,878 |
| 96. | Cherokee | 48.6% | 18.9%(+29.7)#96 | 16.9%(+31.7)#2,950 |
| 97. | Dobbins Heights | 48.5% | 18.9%(+29.6)#97 | 16.9%(+31.6)#2,958 |
| 98. | Hot Springs | 48.4% | 18.9%(+29.5)#98 | 16.9%(+31.5)#2,969 |
| 99. | Faison | 48.3% | 18.9%(+29.4)#99 | 16.9%(+31.4)#2,983 |
| 100. | Sparta | 47.4% | 18.9%(+28.5)#100 | 16.9%(+30.5)#3,101 |
Common Questions
What are the Top 10 Cities with the Highest Poverty Level Among Children Under the Age of 16 in North Carolina?
Top 10 Cities with the Highest Poverty Level Among Children Under the Age of 16 in North Carolina are:
#1
100.0%
#2
100.0%
#3
100.0%
#4
93.8%
#5
90.9%
#6
88.4%
#7
85.2%
#8
83.9%
#9
83.6%
#10
83.3%
What city has the Highest Poverty Level Among Children Under the Age of 16 in North Carolina?
Cordova has the Highest Poverty Level Among Children Under the Age of 16 in North Carolina with 100.0%.
What is the Poverty Level Among Children Under the Age of 16 in the State of North Carolina?
Poverty Level Among Children Under the Age of 16 in North Carolina is 18.9%.
What is the Poverty Level Among Children Under the Age of 16 in the United States?
Poverty Level Among Children Under the Age of 16 in the United States is 16.9%.