Cities with the Highest Percentage of Population with a Degree in Arts and Humanities in Connecticut
RELATED REPORTS & OPTIONS
Arts and Humanities
Connecticut
Compare Cities
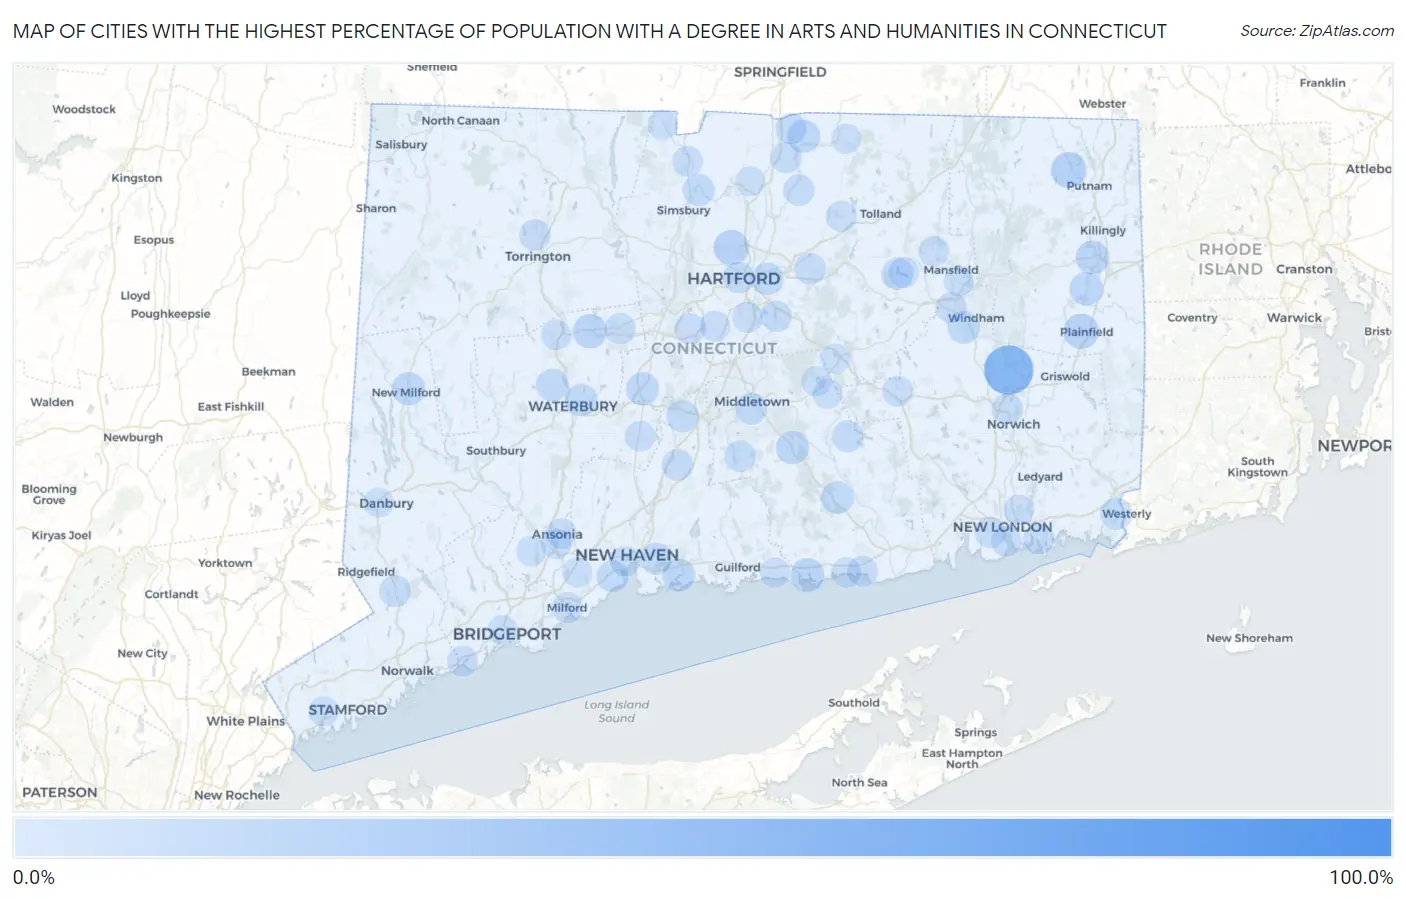
Map of Cities with the Highest Percentage of Population with a Degree in Arts and Humanities in Connecticut
0.0%
100.0%
Cities with the Highest Percentage of Population with a Degree in Arts and Humanities in Connecticut
| City | % Graduates | vs State | vs National | |
| 1. | Quinnipiac University | 100.0% | 5.5%(+94.5)#1 | 6.0%(+94.0)#1 |
| 2. | Witches Woods | 85.4% | 5.5%(+79.8)#2 | 6.0%(+79.4)#139 |
| 3. | Baltic | 54.8% | 5.5%(+49.3)#3 | 6.0%(+48.8)#309 |
| 4. | Jewett City Borough | 21.3% | 5.5%(+15.8)#4 | 6.0%(+15.3)#1,951 |
| 5. | Lakeside Woods | 20.1% | 5.5%(+14.6)#5 | 6.0%(+14.1)#2,127 |
| 6. | Bigelow Corners | 19.8% | 5.5%(+14.2)#6 | 6.0%(+13.8)#2,250 |
| 7. | Sacred Heart University | 19.0% | 5.5%(+13.5)#7 | 6.0%(+13.1)#2,389 |
| 8. | South Woodstock | 18.8% | 5.5%(+13.2)#8 | 6.0%(+12.8)#2,442 |
| 9. | Gaylordsville | 18.5% | 5.5%(+13.0)#9 | 6.0%(+12.5)#2,493 |
| 10. | Pleasant Valley | 18.5% | 5.5%(+12.9)#10 | 6.0%(+12.5)#2,512 |
| 11. | Blue Hills | 17.8% | 5.5%(+12.3)#11 | 6.0%(+11.8)#2,663 |
| 12. | Plainfield Village | 17.6% | 5.5%(+12.0)#12 | 6.0%(+11.6)#2,731 |
| 13. | Terryville | 15.4% | 5.5%(+9.85)#13 | 6.0%(+9.39)#3,408 |
| 14. | Clinton | 14.4% | 5.5%(+8.83)#14 | 6.0%(+8.37)#3,855 |
| 15. | East Brooklyn | 14.1% | 5.5%(+8.52)#15 | 6.0%(+8.07)#4,016 |
| 16. | Wauregan | 13.5% | 5.5%(+7.94)#16 | 6.0%(+7.49)#4,275 |
| 17. | New Milford | 13.2% | 5.5%(+7.68)#17 | 6.0%(+7.22)#4,434 |
| 18. | Higganum | 13.1% | 5.5%(+7.59)#18 | 6.0%(+7.13)#4,488 |
| 19. | Hazardville | 13.0% | 5.5%(+7.45)#19 | 6.0%(+6.99)#4,564 |
| 20. | Quasset Lake | 12.5% | 5.5%(+6.96)#20 | 6.0%(+6.50)#4,872 |
| 21. | Danielson Borough | 12.5% | 5.5%(+6.93)#21 | 6.0%(+6.48)#4,898 |
| 22. | Plantsville | 12.4% | 5.5%(+6.86)#22 | 6.0%(+6.40)#4,924 |
| 23. | Branford Center | 12.4% | 5.5%(+6.84)#23 | 6.0%(+6.39)#4,937 |
| 24. | Chester Center | 12.2% | 5.5%(+6.62)#24 | 6.0%(+6.16)#5,075 |
| 25. | Hawleyville | 12.0% | 5.5%(+6.46)#25 | 6.0%(+6.00)#5,205 |
| 26. | Oakville | 11.6% | 5.5%(+6.08)#26 | 6.0%(+5.62)#5,469 |
| 27. | Lake Bungee | 11.4% | 5.5%(+5.87)#27 | 6.0%(+5.41)#5,625 |
| 28. | South Windham | 11.4% | 5.5%(+5.84)#28 | 6.0%(+5.38)#5,640 |
| 29. | Waterbury | 11.3% | 5.5%(+5.77)#29 | 6.0%(+5.31)#5,695 |
| 30. | East Hartford | 10.7% | 5.5%(+5.14)#30 | 6.0%(+4.68)#6,199 |
| 31. | Meriden | 10.6% | 5.5%(+5.02)#31 | 6.0%(+4.57)#6,310 |
| 32. | Tariffville | 10.2% | 5.5%(+4.67)#32 | 6.0%(+4.21)#6,644 |
| 33. | Pawcatuck | 10.0% | 5.5%(+4.45)#33 | 6.0%(+3.99)#6,920 |
| 34. | Naugatuck Borough | 9.9% | 5.5%(+4.37)#34 | 6.0%(+3.91)#6,984 |
| 35. | Lordship | 9.8% | 5.5%(+4.31)#35 | 6.0%(+3.85)#7,045 |
| 36. | East Haven | 9.8% | 5.5%(+4.28)#36 | 6.0%(+3.83)#7,073 |
| 37. | West Haven | 9.5% | 5.5%(+3.99)#37 | 6.0%(+3.53)#7,377 |
| 38. | Coventry Lake | 9.5% | 5.5%(+3.97)#38 | 6.0%(+3.51)#7,428 |
| 39. | Middletown | 9.2% | 5.5%(+3.68)#39 | 6.0%(+3.22)#7,765 |
| 40. | Taylor Corners | 9.0% | 5.5%(+3.46)#40 | 6.0%(+3.00)#8,047 |
| 41. | Moodus | 9.0% | 5.5%(+3.44)#41 | 6.0%(+2.98)#8,071 |
| 42. | Georgetown | 8.9% | 5.5%(+3.38)#42 | 6.0%(+2.93)#8,150 |
| 43. | Hartford | 8.9% | 5.5%(+3.33)#43 | 6.0%(+2.87)#8,214 |
| 44. | Wallingford Center | 8.8% | 5.5%(+3.23)#44 | 6.0%(+2.77)#8,338 |
| 45. | Redding Center | 8.7% | 5.5%(+3.16)#45 | 6.0%(+2.70)#8,426 |
| 46. | Manchester | 8.6% | 5.5%(+3.10)#46 | 6.0%(+2.64)#8,499 |
| 47. | Durham | 8.5% | 5.5%(+3.01)#47 | 6.0%(+2.55)#8,641 |
| 48. | Southwood Acres | 8.4% | 5.5%(+2.90)#48 | 6.0%(+2.44)#8,774 |
| 49. | Bristol | 8.3% | 5.5%(+2.80)#49 | 6.0%(+2.34)#8,880 |
| 50. | Torrington | 8.3% | 5.5%(+2.76)#50 | 6.0%(+2.31)#8,991 |
| 51. | Broad Brook | 8.2% | 5.5%(+2.67)#51 | 6.0%(+2.21)#9,097 |
| 52. | Norwich | 8.0% | 5.5%(+2.51)#52 | 6.0%(+2.05)#9,320 |
| 53. | Stepney | 7.9% | 5.5%(+2.39)#53 | 6.0%(+1.94)#9,512 |
| 54. | Sherwood Manor | 7.9% | 5.5%(+2.35)#54 | 6.0%(+1.90)#9,565 |
| 55. | Glastonbury Center | 7.6% | 5.5%(+2.10)#55 | 6.0%(+1.64)#9,973 |
| 56. | Bantam Borough | 7.4% | 5.5%(+1.90)#56 | 6.0%(+1.44)#10,287 |
| 57. | Botsford | 7.3% | 5.5%(+1.79)#57 | 6.0%(+1.33)#10,473 |
| 58. | Milford City Balance | 7.3% | 5.5%(+1.72)#58 | 6.0%(+1.26)#10,595 |
| 59. | Poquonock Bridge | 7.1% | 5.5%(+1.58)#59 | 6.0%(+1.12)#10,908 |
| 60. | Saybrook Manor | 7.1% | 5.5%(+1.56)#60 | 6.0%(+1.10)#10,934 |
| 61. | New Britain | 7.1% | 5.5%(+1.51)#61 | 6.0%(+1.06)#11,015 |
| 62. | Salmon Brook | 7.0% | 5.5%(+1.50)#62 | 6.0%(+1.04)#11,039 |
| 63. | Storrs | 6.9% | 5.5%(+1.37)#63 | 6.0%(+0.909)#11,261 |
| 64. | Waterford | 6.9% | 5.5%(+1.35)#64 | 6.0%(+0.890)#11,306 |
| 65. | Willimantic | 6.9% | 5.5%(+1.33)#65 | 6.0%(+0.877)#11,324 |
| 66. | Riverton | 6.9% | 5.5%(+1.33)#66 | 6.0%(+0.875)#11,327 |
| 67. | Colchester | 6.8% | 5.5%(+1.31)#67 | 6.0%(+0.848)#11,368 |
| 68. | Rockville | 6.8% | 5.5%(+1.26)#68 | 6.0%(+0.807)#11,417 |
| 69. | Lakes West | 6.7% | 5.5%(+1.15)#69 | 6.0%(+0.690)#11,599 |
| 70. | Ansonia | 6.6% | 5.5%(+1.07)#70 | 6.0%(+0.611)#11,777 |
| 71. | Sandy Hook | 6.6% | 5.5%(+1.04)#71 | 6.0%(+0.580)#11,837 |
| 72. | New London | 6.5% | 5.5%(+0.973)#72 | 6.0%(+0.516)#11,948 |
| 73. | Cornwall Bridge | 6.5% | 5.5%(+0.913)#73 | 6.0%(+0.456)#12,073 |
| 74. | Southport | 6.4% | 5.5%(+0.865)#74 | 6.0%(+0.408)#12,143 |
| 75. | South Coventry | 6.4% | 5.5%(+0.858)#75 | 6.0%(+0.401)#12,152 |
| 76. | Newington | 6.4% | 5.5%(+0.815)#76 | 6.0%(+0.358)#12,236 |
| 77. | Wethersfield | 6.3% | 5.5%(+0.726)#77 | 6.0%(+0.269)#12,374 |
| 78. | Conning Towers Nautilus Park | 6.1% | 5.5%(+0.550)#78 | 6.0%(+0.093)#12,763 |
| 79. | Derby | 6.1% | 5.5%(+0.513)#79 | 6.0%(+0.056)#12,835 |
| 80. | Thomaston | 6.0% | 5.5%(+0.508)#80 | 6.0%(+0.051)#12,840 |
| 81. | Cheshire Village | 6.0% | 5.5%(+0.443)#81 | 6.0%(-0.015)#12,967 |
| 82. | Mansfield Center | 5.8% | 5.5%(+0.287)#82 | 6.0%(-0.170)#13,244 |
| 83. | New Haven | 5.7% | 5.5%(+0.160)#83 | 6.0%(-0.298)#13,505 |
| 84. | Lake Pocotopaug | 5.6% | 5.5%(+0.060)#84 | 6.0%(-0.398)#13,698 |
| 85. | Indian Field | 5.6% | 5.5%(+0.033)#85 | 6.0%(-0.425)#13,737 |
| 86. | Westport | 5.5% | 5.5%(-0.035)#86 | 6.0%(-0.493)#13,882 |
| 87. | Somers | 5.4% | 5.5%(-0.114)#87 | 6.0%(-0.571)#14,021 |
| 88. | Westbrook Center | 5.4% | 5.5%(-0.155)#88 | 6.0%(-0.612)#14,102 |
| 89. | Windsor Locks | 5.4% | 5.5%(-0.156)#89 | 6.0%(-0.614)#14,107 |
| 90. | North Granby | 5.4% | 5.5%(-0.178)#90 | 6.0%(-0.636)#14,143 |
| 91. | East Hampton | 5.3% | 5.5%(-0.211)#91 | 6.0%(-0.669)#14,189 |
| 92. | Shelton | 5.3% | 5.5%(-0.220)#92 | 6.0%(-0.678)#14,209 |
| 93. | Cos Cob | 5.2% | 5.5%(-0.288)#93 | 6.0%(-0.746)#14,372 |
| 94. | Bridgeport | 5.2% | 5.5%(-0.314)#94 | 6.0%(-0.771)#14,399 |
| 95. | Plattsville | 5.2% | 5.5%(-0.316)#95 | 6.0%(-0.774)#14,402 |
| 96. | Orange | 5.2% | 5.5%(-0.386)#96 | 6.0%(-0.844)#14,532 |
| 97. | Terramuggus | 5.2% | 5.5%(-0.387)#97 | 6.0%(-0.844)#14,533 |
| 98. | Madison Center | 5.1% | 5.5%(-0.390)#98 | 6.0%(-0.848)#14,539 |
| 99. | Danbury | 5.1% | 5.5%(-0.440)#99 | 6.0%(-0.897)#14,632 |
| 100. | Northford | 5.1% | 5.5%(-0.465)#100 | 6.0%(-0.922)#14,685 |
Common Questions
What are the Top 10 Cities with the Highest Percentage of Population with a Degree in Arts and Humanities in Connecticut?
Top 10 Cities with the Highest Percentage of Population with a Degree in Arts and Humanities in Connecticut are:
#1
54.8%
#2
18.8%
#3
17.8%
#4
17.6%
#5
15.4%
#6
14.4%
#7
14.1%
#8
13.5%
#9
13.2%
#10
13.1%
What city has the Highest Percentage of Population with a Degree in Arts and Humanities in Connecticut?
Baltic has the Highest Percentage of Population with a Degree in Arts and Humanities in Connecticut with 54.8%.
What is the Percentage of Population with a Degree in Arts and Humanities in the State of Connecticut?
Percentage of Population with a Degree in Arts and Humanities in Connecticut is 5.5%.
What is the Percentage of Population with a Degree in Arts and Humanities in the United States?
Percentage of Population with a Degree in Arts and Humanities in the United States is 6.0%.