Cities with the Highest Percentage of Population with a Degree in Arts and Humanities in Virginia
RELATED REPORTS & OPTIONS
Arts and Humanities
Virginia
Compare Cities
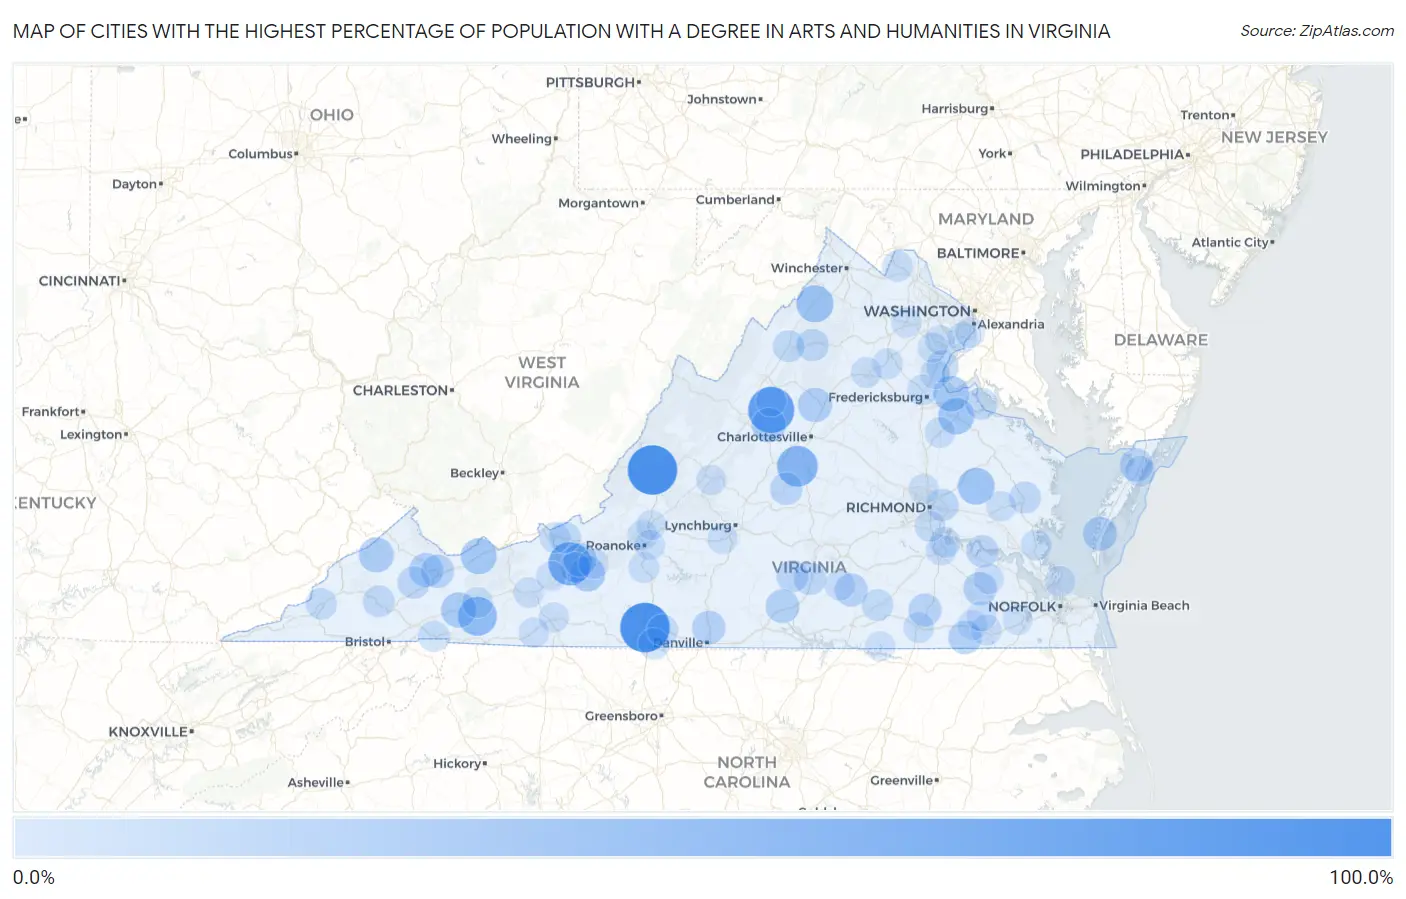
Map of Cities with the Highest Percentage of Population with a Degree in Arts and Humanities in Virginia
0.0%
100.0%
Cities with the Highest Percentage of Population with a Degree in Arts and Humanities in Virginia
| City | % Graduates | vs State | vs National | |
| 1. | Fieldale | 100.0% | 6.4%(+93.6)#1 | 6.0%(+94.0)#9 |
| 2. | Low Moor | 100.0% | 6.4%(+93.6)#2 | 6.0%(+94.0)#26 |
| 3. | Ripplemead | 100.0% | 6.4%(+93.6)#3 | 6.0%(+94.0)#38 |
| 4. | Schooner Bay | 100.0% | 6.4%(+93.6)#4 | 6.0%(+94.0)#110 |
| 5. | Mechanicsburg | 100.0% | 6.4%(+93.6)#5 | 6.0%(+94.0)#125 |
| 6. | Harriston | 83.3% | 6.4%(+76.9)#6 | 6.0%(+77.3)#144 |
| 7. | New River | 69.3% | 6.4%(+62.9)#7 | 6.0%(+63.3)#197 |
| 8. | Esmont | 58.3% | 6.4%(+51.9)#8 | 6.0%(+52.3)#274 |
| 9. | Sugar Grove | 50.0% | 6.4%(+43.6)#9 | 6.0%(+44.0)#351 |
| 10. | Rose Hill Cdp Lee County | 50.0% | 6.4%(+43.6)#10 | 6.0%(+44.0)#353 |
| 11. | Innovation | 48.2% | 6.4%(+41.8)#11 | 6.0%(+42.2)#418 |
| 12. | Toms Brook | 41.2% | 6.4%(+34.8)#12 | 6.0%(+35.2)#532 |
| 13. | King William | 40.0% | 6.4%(+33.6)#13 | 6.0%(+34.0)#577 |
| 14. | Mcdowell | 40.0% | 6.4%(+33.6)#14 | 6.0%(+34.0)#587 |
| 15. | Port Royal | 37.5% | 6.4%(+31.1)#15 | 6.0%(+31.5)#664 |
| 16. | Springville | 35.6% | 6.4%(+29.2)#16 | 6.0%(+29.6)#729 |
| 17. | Fairview Beach | 34.9% | 6.4%(+28.5)#17 | 6.0%(+28.9)#760 |
| 18. | Riner | 33.5% | 6.4%(+27.1)#18 | 6.0%(+27.5)#799 |
| 19. | Mcmullin | 33.3% | 6.4%(+26.9)#19 | 6.0%(+27.3)#833 |
| 20. | Haysi | 31.8% | 6.4%(+25.4)#20 | 6.0%(+25.8)#929 |
| 21. | Dooms | 29.6% | 6.4%(+23.2)#21 | 6.0%(+23.6)#1,070 |
| 22. | Twin Lakes | 28.5% | 6.4%(+22.1)#22 | 6.0%(+22.5)#1,159 |
| 23. | Eastville | 28.2% | 6.4%(+21.8)#23 | 6.0%(+22.2)#1,179 |
| 24. | Raven | 27.4% | 6.4%(+21.0)#24 | 6.0%(+21.4)#1,241 |
| 25. | Clover | 26.5% | 6.4%(+20.1)#25 | 6.0%(+20.5)#1,330 |
| 26. | Wakefield | 25.0% | 6.4%(+18.6)#26 | 6.0%(+19.0)#1,426 |
| 27. | Belview | 25.0% | 6.4%(+18.6)#27 | 6.0%(+19.0)#1,427 |
| 28. | Blairs | 25.0% | 6.4%(+18.6)#28 | 6.0%(+19.0)#1,429 |
| 29. | Rio | 24.9% | 6.4%(+18.5)#29 | 6.0%(+18.9)#1,517 |
| 30. | Newsoms | 24.6% | 6.4%(+18.2)#30 | 6.0%(+18.6)#1,530 |
| 31. | Singers Glen | 24.3% | 6.4%(+17.9)#31 | 6.0%(+18.3)#1,553 |
| 32. | Cedar Bluff | 24.1% | 6.4%(+17.7)#32 | 6.0%(+18.1)#1,579 |
| 33. | Kenbridge | 23.8% | 6.4%(+17.5)#33 | 6.0%(+17.9)#1,611 |
| 34. | Bloxom | 23.5% | 6.4%(+17.1)#34 | 6.0%(+17.5)#1,642 |
| 35. | Jarratt | 23.0% | 6.4%(+16.6)#35 | 6.0%(+17.0)#1,715 |
| 36. | Yogaville | 21.3% | 6.4%(+14.9)#36 | 6.0%(+15.3)#1,949 |
| 37. | Keysville | 20.1% | 6.4%(+13.8)#37 | 6.0%(+14.1)#2,126 |
| 38. | Claremont | 19.8% | 6.4%(+13.4)#38 | 6.0%(+13.8)#2,248 |
| 39. | Quantico Base | 19.7% | 6.4%(+13.3)#39 | 6.0%(+13.7)#2,263 |
| 40. | Honaker | 19.6% | 6.4%(+13.2)#40 | 6.0%(+13.6)#2,267 |
| 41. | Luray | 19.6% | 6.4%(+13.2)#41 | 6.0%(+13.6)#2,270 |
| 42. | Highland Springs | 19.4% | 6.4%(+13.0)#42 | 6.0%(+13.4)#2,307 |
| 43. | Charlotte Court House | 18.9% | 6.4%(+12.5)#43 | 6.0%(+12.9)#2,429 |
| 44. | Saluda | 18.2% | 6.4%(+11.8)#44 | 6.0%(+12.2)#2,562 |
| 45. | Colonial Beach | 17.9% | 6.4%(+11.5)#45 | 6.0%(+11.9)#2,641 |
| 46. | Castlewood | 17.8% | 6.4%(+11.4)#46 | 6.0%(+11.8)#2,665 |
| 47. | New Market | 17.1% | 6.4%(+10.7)#47 | 6.0%(+11.1)#2,855 |
| 48. | Pembroke | 16.9% | 6.4%(+10.5)#48 | 6.0%(+10.9)#2,898 |
| 49. | Alberta | 16.7% | 6.4%(+10.3)#49 | 6.0%(+10.7)#2,994 |
| 50. | Big Stone Gap | 16.6% | 6.4%(+10.2)#50 | 6.0%(+10.6)#3,060 |
| 51. | Dinwiddie | 16.2% | 6.4%(+9.77)#51 | 6.0%(+10.2)#3,166 |
| 52. | Ridgeway | 16.1% | 6.4%(+9.71)#52 | 6.0%(+10.1)#3,188 |
| 53. | Chatmoss | 15.2% | 6.4%(+8.78)#53 | 6.0%(+9.17)#3,525 |
| 54. | Damascus | 14.0% | 6.4%(+7.64)#54 | 6.0%(+8.04)#4,025 |
| 55. | Hillsboro | 13.8% | 6.4%(+7.45)#55 | 6.0%(+7.85)#4,107 |
| 56. | Boones Mill | 13.6% | 6.4%(+7.17)#56 | 6.0%(+7.56)#4,244 |
| 57. | Emporia | 13.3% | 6.4%(+6.94)#57 | 6.0%(+7.34)#4,335 |
| 58. | Remington | 13.1% | 6.4%(+6.70)#58 | 6.0%(+7.09)#4,510 |
| 59. | Atkins | 13.0% | 6.4%(+6.59)#59 | 6.0%(+6.99)#4,566 |
| 60. | Culpeper | 13.0% | 6.4%(+6.56)#60 | 6.0%(+6.96)#4,586 |
| 61. | Gloucester Point | 12.9% | 6.4%(+6.47)#61 | 6.0%(+6.87)#4,646 |
| 62. | Camp Barrett | 12.8% | 6.4%(+6.41)#62 | 6.0%(+6.81)#4,676 |
| 63. | Fort Lee | 12.8% | 6.4%(+6.37)#63 | 6.0%(+6.77)#4,690 |
| 64. | Bowling Green | 12.8% | 6.4%(+6.37)#64 | 6.0%(+6.77)#4,692 |
| 65. | Pearisburg | 12.8% | 6.4%(+6.36)#65 | 6.0%(+6.76)#4,700 |
| 66. | Victoria | 12.7% | 6.4%(+6.28)#66 | 6.0%(+6.68)#4,743 |
| 67. | Franklin | 12.6% | 6.4%(+6.18)#67 | 6.0%(+6.58)#4,792 |
| 68. | Southern Gateway | 12.5% | 6.4%(+6.15)#68 | 6.0%(+6.54)#4,799 |
| 69. | Gargatha | 12.5% | 6.4%(+6.11)#69 | 6.0%(+6.50)#4,832 |
| 70. | Hopewell | 12.5% | 6.4%(+6.10)#70 | 6.0%(+6.50)#4,896 |
| 71. | Bellwood | 12.4% | 6.4%(+6.06)#71 | 6.0%(+6.45)#4,905 |
| 72. | Fort Chiswell | 12.4% | 6.4%(+5.98)#72 | 6.0%(+6.38)#4,947 |
| 73. | Aldie | 12.4% | 6.4%(+5.97)#73 | 6.0%(+6.36)#4,951 |
| 74. | Radford | 12.3% | 6.4%(+5.95)#74 | 6.0%(+6.35)#4,960 |
| 75. | Hampton | 12.1% | 6.4%(+5.75)#75 | 6.0%(+6.14)#5,088 |
| 76. | Big Stone Gap East | 11.8% | 6.4%(+5.37)#76 | 6.0%(+5.77)#5,358 |
| 77. | Hollins | 11.7% | 6.4%(+5.35)#77 | 6.0%(+5.75)#5,396 |
| 78. | Buena Vista | 11.5% | 6.4%(+5.15)#78 | 6.0%(+5.55)#5,519 |
| 79. | Grottoes | 11.4% | 6.4%(+5.02)#79 | 6.0%(+5.42)#5,617 |
| 80. | Hutchison | 11.3% | 6.4%(+4.96)#80 | 6.0%(+5.35)#5,662 |
| 81. | Fort Belvoir | 11.3% | 6.4%(+4.88)#81 | 6.0%(+5.28)#5,718 |
| 82. | Timberlake | 11.3% | 6.4%(+4.86)#82 | 6.0%(+5.26)#5,729 |
| 83. | Galax | 11.1% | 6.4%(+4.73)#83 | 6.0%(+5.13)#5,798 |
| 84. | Dendron | 11.1% | 6.4%(+4.72)#84 | 6.0%(+5.12)#5,851 |
| 85. | Hillsville | 11.0% | 6.4%(+4.65)#85 | 6.0%(+5.05)#5,910 |
| 86. | West Point | 11.0% | 6.4%(+4.61)#86 | 6.0%(+5.00)#5,946 |
| 87. | Christiansburg | 10.9% | 6.4%(+4.51)#87 | 6.0%(+4.91)#6,013 |
| 88. | Vinton | 10.7% | 6.4%(+4.34)#88 | 6.0%(+4.74)#6,132 |
| 89. | Hybla Valley | 10.7% | 6.4%(+4.26)#89 | 6.0%(+4.66)#6,214 |
| 90. | Courtland | 10.6% | 6.4%(+4.20)#90 | 6.0%(+4.60)#6,277 |
| 91. | Aquia Harbour | 10.5% | 6.4%(+4.14)#91 | 6.0%(+4.54)#6,326 |
| 92. | Sedley | 10.5% | 6.4%(+4.08)#92 | 6.0%(+4.48)#6,410 |
| 93. | Glen Allen | 10.5% | 6.4%(+4.08)#93 | 6.0%(+4.47)#6,413 |
| 94. | Gasburg | 10.4% | 6.4%(+4.04)#94 | 6.0%(+4.44)#6,442 |
| 95. | Haymarket | 10.4% | 6.4%(+4.00)#95 | 6.0%(+4.40)#6,475 |
| 96. | Troutville | 10.3% | 6.4%(+3.90)#96 | 6.0%(+4.30)#6,548 |
| 97. | Suffolk | 10.3% | 6.4%(+3.87)#97 | 6.0%(+4.26)#6,576 |
| 98. | Pulaski | 10.2% | 6.4%(+3.84)#98 | 6.0%(+4.24)#6,615 |
| 99. | Independent Hill | 10.1% | 6.4%(+3.74)#99 | 6.0%(+4.13)#6,724 |
| 100. | County Center | 10.1% | 6.4%(+3.73)#100 | 6.0%(+4.13)#6,734 |
Common Questions
What are the Top 10 Cities with the Highest Percentage of Population with a Degree in Arts and Humanities in Virginia?
Top 10 Cities with the Highest Percentage of Population with a Degree in Arts and Humanities in Virginia are:
#1
100.0%
#2
100.0%
#3
83.3%
#4
69.3%
#5
58.3%
#6
50.0%
#7
41.2%
#8
40.0%
#9
37.5%
#10
35.6%
What city has the Highest Percentage of Population with a Degree in Arts and Humanities in Virginia?
Fieldale has the Highest Percentage of Population with a Degree in Arts and Humanities in Virginia with 100.0%.
What is the Percentage of Population with a Degree in Arts and Humanities in the State of Virginia?
Percentage of Population with a Degree in Arts and Humanities in Virginia is 6.4%.
What is the Percentage of Population with a Degree in Arts and Humanities in the United States?
Percentage of Population with a Degree in Arts and Humanities in the United States is 6.0%.