Cities with the Highest Percentage of Population with a Degree in Arts and Humanities in Massachusetts
RELATED REPORTS & OPTIONS
Arts and Humanities
Massachusetts
Compare Cities
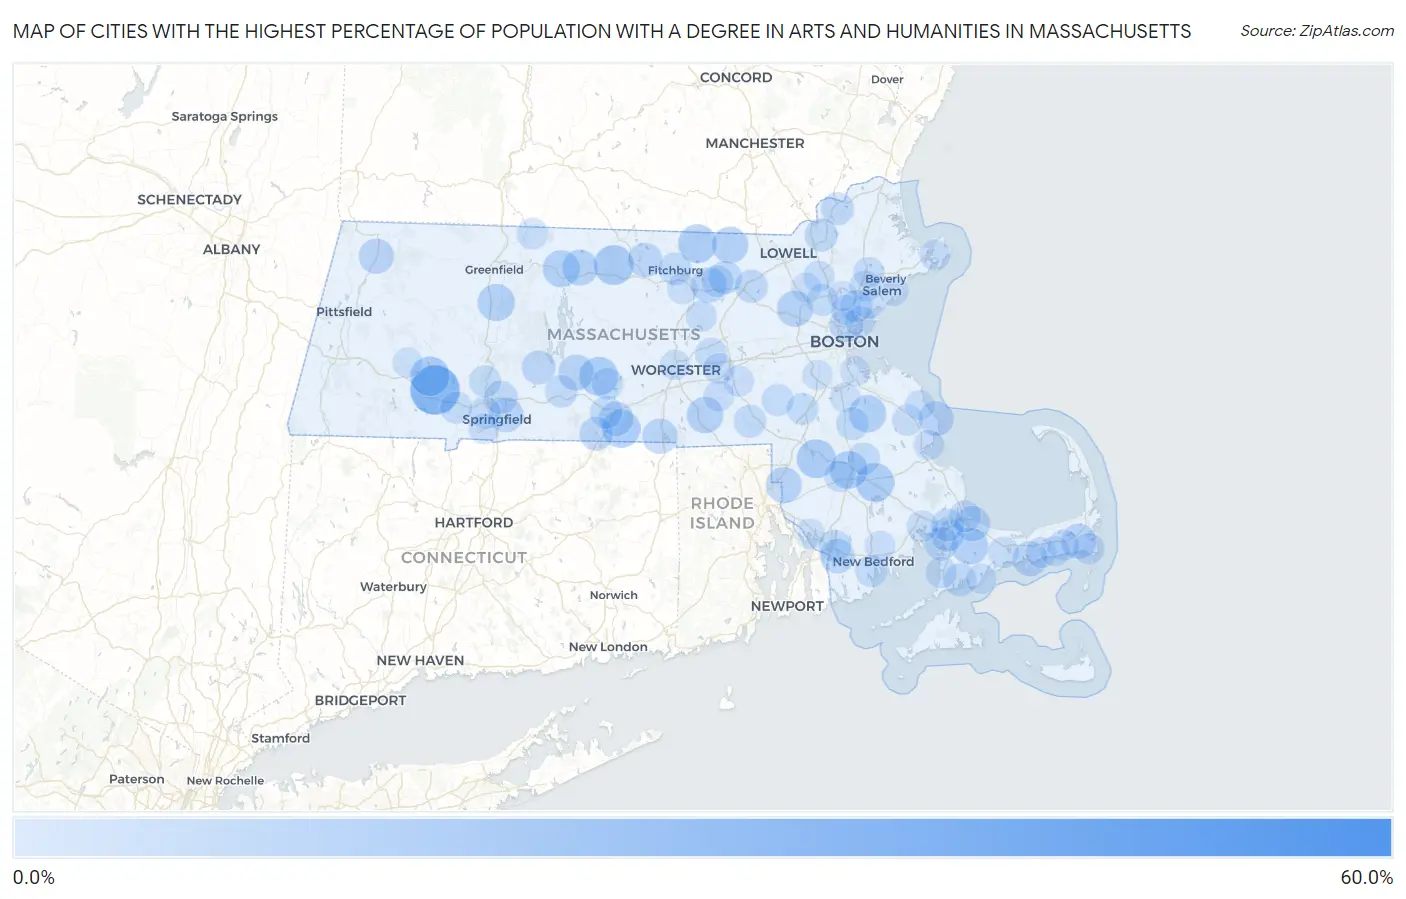
Map of Cities with the Highest Percentage of Population with a Degree in Arts and Humanities in Massachusetts
0.0%
60.0%
Cities with the Highest Percentage of Population with a Degree in Arts and Humanities in Massachusetts
| City | % Graduates | vs State | vs National | |
| 1. | Lenox Dale | 53.2% | 5.2%(+48.0)#1 | 6.0%(+47.2)#328 |
| 2. | Russell | 30.1% | 5.2%(+24.9)#2 | 6.0%(+24.1)#1,032 |
| 3. | Baldwinville | 17.8% | 5.2%(+12.6)#3 | 6.0%(+11.8)#2,667 |
| 4. | Huntington | 17.5% | 5.2%(+12.3)#4 | 6.0%(+11.5)#2,758 |
| 5. | Norton Center | 16.7% | 5.2%(+11.5)#5 | 6.0%(+10.7)#2,948 |
| 6. | West Brookfield | 16.6% | 5.2%(+11.5)#6 | 6.0%(+10.6)#3,053 |
| 7. | Middleborough Center | 16.2% | 5.2%(+11.0)#7 | 6.0%(+10.2)#3,167 |
| 8. | Townsend | 16.1% | 5.2%(+10.9)#8 | 6.0%(+10.1)#3,192 |
| 9. | Southbridge Town | 15.7% | 5.2%(+10.5)#9 | 6.0%(+9.70)#3,321 |
| 10. | Raynham Center | 15.3% | 5.2%(+10.2)#10 | 6.0%(+9.33)#3,471 |
| 11. | Abington | 14.8% | 5.2%(+9.63)#11 | 6.0%(+8.79)#3,687 |
| 12. | South Deerfield | 14.6% | 5.2%(+9.40)#12 | 6.0%(+8.56)#3,784 |
| 13. | Orange | 14.3% | 5.2%(+9.13)#13 | 6.0%(+8.29)#3,869 |
| 14. | Forestdale | 14.0% | 5.2%(+8.82)#14 | 6.0%(+7.98)#4,049 |
| 15. | East Pepperell | 13.7% | 5.2%(+8.59)#15 | 6.0%(+7.75)#4,163 |
| 16. | Whitinsville | 13.7% | 5.2%(+8.58)#16 | 6.0%(+7.74)#4,167 |
| 17. | Hanscom Afb | 13.2% | 5.2%(+8.04)#17 | 6.0%(+7.20)#4,451 |
| 18. | Athol | 13.1% | 5.2%(+7.91)#18 | 6.0%(+7.07)#4,520 |
| 19. | North Seekonk | 12.9% | 5.2%(+7.77)#19 | 6.0%(+6.94)#4,596 |
| 20. | Ware | 12.9% | 5.2%(+7.77)#20 | 6.0%(+6.93)#4,600 |
| 21. | Sandwich | 12.5% | 5.2%(+7.30)#21 | 6.0%(+6.46)#4,903 |
| 22. | Webster | 12.2% | 5.2%(+7.09)#22 | 6.0%(+6.25)#5,019 |
| 23. | Shirley | 12.2% | 5.2%(+7.00)#23 | 6.0%(+6.16)#5,078 |
| 24. | East Harwich | 12.0% | 5.2%(+6.83)#24 | 6.0%(+5.99)#5,208 |
| 25. | West Yarmouth | 12.0% | 5.2%(+6.83)#25 | 6.0%(+5.99)#5,210 |
| 26. | Ocean Bluff Brant Rock | 11.9% | 5.2%(+6.76)#26 | 6.0%(+5.92)#5,253 |
| 27. | Adams | 11.8% | 5.2%(+6.65)#27 | 6.0%(+5.81)#5,328 |
| 28. | Springfield | 11.7% | 5.2%(+6.50)#28 | 6.0%(+5.67)#5,451 |
| 29. | North Westport | 11.4% | 5.2%(+6.28)#29 | 6.0%(+5.44)#5,594 |
| 30. | Sturbridge | 11.1% | 5.2%(+5.97)#30 | 6.0%(+5.14)#5,795 |
| 31. | South Ashburnham | 11.0% | 5.2%(+5.85)#31 | 6.0%(+5.01)#5,933 |
| 32. | Green Harbor | 10.6% | 5.2%(+5.47)#32 | 6.0%(+4.63)#6,249 |
| 33. | Belchertown | 10.5% | 5.2%(+5.31)#33 | 6.0%(+4.47)#6,414 |
| 34. | Holland | 10.4% | 5.2%(+5.24)#34 | 6.0%(+4.40)#6,473 |
| 35. | Everett | 10.4% | 5.2%(+5.20)#35 | 6.0%(+4.36)#6,493 |
| 36. | Ayer | 10.0% | 5.2%(+4.81)#36 | 6.0%(+3.98)#6,925 |
| 37. | Pocasset | 9.9% | 5.2%(+4.77)#37 | 6.0%(+3.93)#6,975 |
| 38. | Monument Beach | 9.9% | 5.2%(+4.74)#38 | 6.0%(+3.90)#7,004 |
| 39. | Lawrence | 9.7% | 5.2%(+4.58)#39 | 6.0%(+3.74)#7,172 |
| 40. | Littleton Common | 9.6% | 5.2%(+4.47)#40 | 6.0%(+3.63)#7,282 |
| 41. | Chicopee | 9.6% | 5.2%(+4.45)#41 | 6.0%(+3.62)#7,302 |
| 42. | Haverhill | 9.4% | 5.2%(+4.28)#42 | 6.0%(+3.45)#7,491 |
| 43. | East Falmouth | 9.4% | 5.2%(+4.23)#43 | 6.0%(+3.39)#7,558 |
| 44. | Fitchburg | 9.2% | 5.2%(+4.04)#44 | 6.0%(+3.20)#7,794 |
| 45. | Brockton | 9.1% | 5.2%(+3.99)#45 | 6.0%(+3.15)#7,850 |
| 46. | Bellingham | 9.1% | 5.2%(+3.93)#46 | 6.0%(+3.09)#7,976 |
| 47. | Fiskdale | 9.0% | 5.2%(+3.83)#47 | 6.0%(+2.99)#8,061 |
| 48. | Bridgewater Town | 9.0% | 5.2%(+3.81)#48 | 6.0%(+2.97)#8,089 |
| 49. | Palmer Town | 9.0% | 5.2%(+3.80)#49 | 6.0%(+2.96)#8,109 |
| 50. | Buzzards Bay | 8.9% | 5.2%(+3.75)#50 | 6.0%(+2.92)#8,158 |
| 51. | Fall River | 8.8% | 5.2%(+3.69)#51 | 6.0%(+2.85)#8,241 |
| 52. | Saugus | 8.5% | 5.2%(+3.38)#52 | 6.0%(+2.54)#8,651 |
| 53. | West Springfield Town | 8.3% | 5.2%(+3.19)#53 | 6.0%(+2.35)#8,872 |
| 54. | Sagamore | 8.3% | 5.2%(+3.18)#54 | 6.0%(+2.34)#8,883 |
| 55. | Northborough | 8.3% | 5.2%(+3.16)#55 | 6.0%(+2.32)#8,973 |
| 56. | Holyoke | 8.3% | 5.2%(+3.16)#56 | 6.0%(+2.32)#8,975 |
| 57. | Devens | 8.3% | 5.2%(+3.13)#57 | 6.0%(+2.29)#9,005 |
| 58. | Millis Clicquot | 8.3% | 5.2%(+3.12)#58 | 6.0%(+2.28)#9,008 |
| 59. | Westfield | 8.2% | 5.2%(+3.09)#59 | 6.0%(+2.25)#9,051 |
| 60. | Bliss Corner | 8.2% | 5.2%(+3.08)#60 | 6.0%(+2.24)#9,066 |
| 61. | Brookfield | 8.0% | 5.2%(+2.88)#61 | 6.0%(+2.04)#9,334 |
| 62. | Walpole | 7.9% | 5.2%(+2.70)#62 | 6.0%(+1.86)#9,620 |
| 63. | Woburn | 7.8% | 5.2%(+2.65)#63 | 6.0%(+1.81)#9,706 |
| 64. | Wareham Center | 7.8% | 5.2%(+2.60)#64 | 6.0%(+1.76)#9,776 |
| 65. | Taunton | 7.6% | 5.2%(+2.45)#65 | 6.0%(+1.62)#10,004 |
| 66. | Northfield | 7.6% | 5.2%(+2.44)#66 | 6.0%(+1.61)#10,017 |
| 67. | West Falmouth | 7.5% | 5.2%(+2.37)#67 | 6.0%(+1.53)#10,139 |
| 68. | West Chatham | 7.5% | 5.2%(+2.36)#68 | 6.0%(+1.53)#10,144 |
| 69. | Northwest Harwich | 7.4% | 5.2%(+2.23)#69 | 6.0%(+1.39)#10,385 |
| 70. | North Pembroke | 7.3% | 5.2%(+2.16)#70 | 6.0%(+1.33)#10,480 |
| 71. | Barnstable Town | 7.3% | 5.2%(+2.14)#71 | 6.0%(+1.30)#10,537 |
| 72. | Peabody | 7.3% | 5.2%(+2.10)#72 | 6.0%(+1.26)#10,601 |
| 73. | Wilmington | 7.1% | 5.2%(+1.97)#73 | 6.0%(+1.14)#10,881 |
| 74. | Danvers | 7.1% | 5.2%(+1.96)#74 | 6.0%(+1.12)#10,909 |
| 75. | Westborough | 7.1% | 5.2%(+1.91)#75 | 6.0%(+1.07)#10,979 |
| 76. | South Lancaster | 7.0% | 5.2%(+1.88)#76 | 6.0%(+1.04)#11,032 |
| 77. | North Attleborough | 7.0% | 5.2%(+1.87)#77 | 6.0%(+1.03)#11,058 |
| 78. | Revere | 7.0% | 5.2%(+1.84)#78 | 6.0%(+1.01)#11,094 |
| 79. | Gloucester | 7.0% | 5.2%(+1.82)#79 | 6.0%(+0.987)#11,129 |
| 80. | Leominster | 6.9% | 5.2%(+1.75)#80 | 6.0%(+0.915)#11,248 |
| 81. | Upton | 6.9% | 5.2%(+1.73)#81 | 6.0%(+0.892)#11,302 |
| 82. | Agawam Town | 6.9% | 5.2%(+1.71)#82 | 6.0%(+0.873)#11,328 |
| 83. | South Yarmouth | 6.8% | 5.2%(+1.68)#83 | 6.0%(+0.837)#11,384 |
| 84. | Hopkinton | 6.6% | 5.2%(+1.42)#84 | 6.0%(+0.582)#11,834 |
| 85. | Acushnet Center | 6.6% | 5.2%(+1.42)#85 | 6.0%(+0.579)#11,838 |
| 86. | South Duxbury | 6.4% | 5.2%(+1.22)#86 | 6.0%(+0.378)#12,198 |
| 87. | Melrose | 6.3% | 5.2%(+1.13)#87 | 6.0%(+0.289)#12,345 |
| 88. | Worcester | 6.3% | 5.2%(+1.11)#88 | 6.0%(+0.270)#12,372 |
| 89. | Popponesset | 6.2% | 5.2%(+1.06)#89 | 6.0%(+0.227)#12,509 |
| 90. | Ocean Grove | 6.2% | 5.2%(+1.00)#90 | 6.0%(+0.163)#12,628 |
| 91. | Marshfield Hills | 6.1% | 5.2%(+0.947)#91 | 6.0%(+0.109)#12,732 |
| 92. | Quincy | 6.1% | 5.2%(+0.934)#92 | 6.0%(+0.096)#12,755 |
| 93. | Dedham | 6.1% | 5.2%(+0.909)#93 | 6.0%(+0.071)#12,798 |
| 94. | Randolph Town | 6.0% | 5.2%(+0.891)#94 | 6.0%(+0.053)#12,838 |
| 95. | Pinehurst | 6.0% | 5.2%(+0.856)#95 | 6.0%(+0.018)#12,896 |
| 96. | Lynn | 6.0% | 5.2%(+0.842)#96 | 6.0%(+0.004)#12,925 |
| 97. | Wakefield | 6.0% | 5.2%(+0.835)#97 | 6.0%(-0.002)#12,935 |
| 98. | Dennis Port | 6.0% | 5.2%(+0.835)#98 | 6.0%(-0.003)#12,936 |
| 99. | Chester | 5.9% | 5.2%(+0.725)#99 | 6.0%(-0.113)#13,148 |
| 100. | Salem | 5.8% | 5.2%(+0.650)#100 | 6.0%(-0.188)#13,279 |
Common Questions
What are the Top 10 Cities with the Highest Percentage of Population with a Degree in Arts and Humanities in Massachusetts?
Top 10 Cities with the Highest Percentage of Population with a Degree in Arts and Humanities in Massachusetts are:
#1
30.1%
#2
17.8%
#3
17.5%
#4
16.7%
#5
16.6%
#6
16.2%
#7
16.1%
#8
15.7%
#9
15.3%
#10
14.8%
What city has the Highest Percentage of Population with a Degree in Arts and Humanities in Massachusetts?
Russell has the Highest Percentage of Population with a Degree in Arts and Humanities in Massachusetts with 30.1%.
What is the Percentage of Population with a Degree in Arts and Humanities in the State of Massachusetts?
Percentage of Population with a Degree in Arts and Humanities in Massachusetts is 5.2%.
What is the Percentage of Population with a Degree in Arts and Humanities in the United States?
Percentage of Population with a Degree in Arts and Humanities in the United States is 6.0%.