Cities with the Highest Percentage of Population with a Degree in Arts and Humanities in Indiana
RELATED REPORTS & OPTIONS
Arts and Humanities
Indiana
Compare Cities
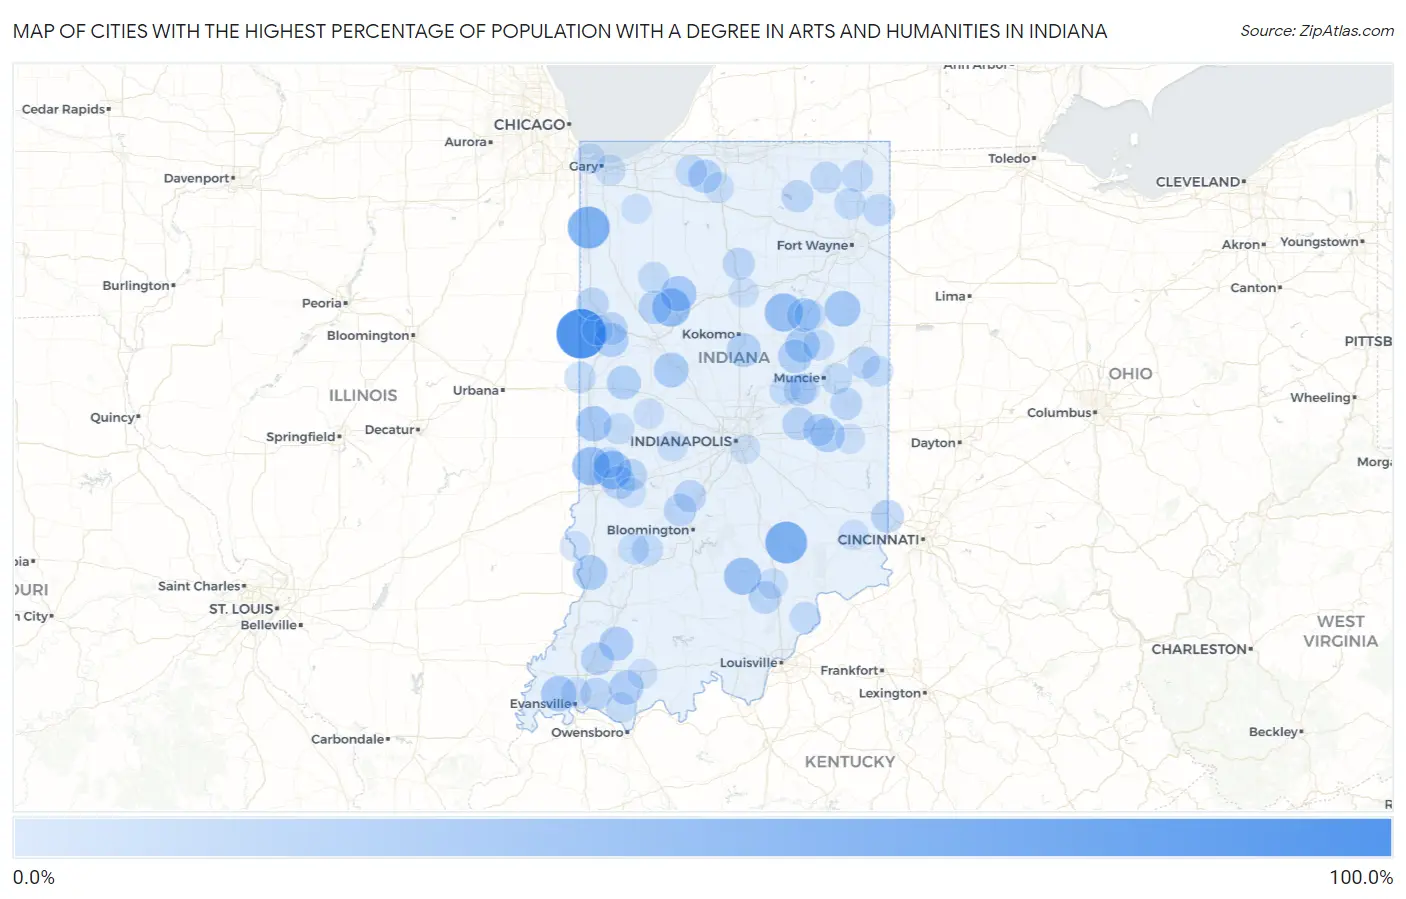
Map of Cities with the Highest Percentage of Population with a Degree in Arts and Humanities in Indiana
0.0%
100.0%
Cities with the Highest Percentage of Population with a Degree in Arts and Humanities in Indiana
| City | % Graduates | vs State | vs National | |
| 1. | Gwynneville | 100.0% | 6.3%(+93.7)#1 | 6.0%(+94.0)#29 |
| 2. | Twelve Mile | 100.0% | 6.3%(+93.7)#2 | 6.0%(+94.0)#32 |
| 3. | Ambia | 100.0% | 6.3%(+93.7)#3 | 6.0%(+94.0)#43 |
| 4. | Stone Bluff | 100.0% | 6.3%(+93.7)#4 | 6.0%(+94.0)#59 |
| 5. | Eden | 100.0% | 6.3%(+93.7)#5 | 6.0%(+94.0)#72 |
| 6. | Stroh | 86.7% | 6.3%(+80.4)#6 | 6.0%(+80.7)#137 |
| 7. | Paxton | 68.4% | 6.3%(+62.1)#7 | 6.0%(+62.4)#201 |
| 8. | Schneider | 66.7% | 6.3%(+60.4)#8 | 6.0%(+60.7)#214 |
| 9. | Scipio | 66.1% | 6.3%(+59.8)#9 | 6.0%(+60.1)#227 |
| 10. | Lake Eliza | 64.0% | 6.3%(+57.7)#10 | 6.0%(+58.0)#232 |
| 11. | Yeoman | 50.0% | 6.3%(+43.7)#11 | 6.0%(+44.0)#374 |
| 12. | Fontanet | 50.0% | 6.3%(+43.7)#12 | 6.0%(+44.0)#377 |
| 13. | Shepardsville | 50.0% | 6.3%(+43.7)#13 | 6.0%(+44.0)#385 |
| 14. | Jalapa | 50.0% | 6.3%(+43.7)#14 | 6.0%(+44.0)#403 |
| 15. | Cree Lake | 47.2% | 6.3%(+40.9)#15 | 6.0%(+41.2)#429 |
| 16. | Vallonia | 45.7% | 6.3%(+39.4)#16 | 6.0%(+39.7)#448 |
| 17. | Prairieton | 44.2% | 6.3%(+37.9)#17 | 6.0%(+38.2)#470 |
| 18. | Lyford | 41.4% | 6.3%(+35.1)#18 | 6.0%(+35.4)#528 |
| 19. | Big Lake | 40.7% | 6.3%(+34.3)#19 | 6.0%(+34.7)#544 |
| 20. | Hartz Lake | 40.0% | 6.3%(+33.7)#20 | 6.0%(+34.0)#569 |
| 21. | Poneto | 40.0% | 6.3%(+33.7)#21 | 6.0%(+34.0)#575 |
| 22. | Idaville | 38.5% | 6.3%(+32.2)#22 | 6.0%(+32.5)#628 |
| 23. | Newport | 38.5% | 6.3%(+32.2)#23 | 6.0%(+32.5)#629 |
| 24. | Parkers Settlement | 38.1% | 6.3%(+31.7)#24 | 6.0%(+32.1)#643 |
| 25. | Oaktown | 36.4% | 6.3%(+30.1)#25 | 6.0%(+30.4)#695 |
| 26. | Clarks Hill | 35.7% | 6.3%(+29.4)#26 | 6.0%(+29.7)#720 |
| 27. | Fowlerton | 35.3% | 6.3%(+29.0)#27 | 6.0%(+29.3)#741 |
| 28. | South Center | 34.5% | 6.3%(+28.2)#28 | 6.0%(+28.5)#775 |
| 29. | Lewisville | 33.9% | 6.3%(+27.6)#29 | 6.0%(+27.9)#790 |
| 30. | Pine Village | 33.3% | 6.3%(+27.0)#30 | 6.0%(+27.3)#830 |
| 31. | Wyatt | 33.3% | 6.3%(+27.0)#31 | 6.0%(+27.3)#840 |
| 32. | Tennyson | 33.3% | 6.3%(+27.0)#32 | 6.0%(+27.3)#841 |
| 33. | Winslow | 32.7% | 6.3%(+26.4)#33 | 6.0%(+26.7)#891 |
| 34. | Stanford | 32.4% | 6.3%(+26.0)#34 | 6.0%(+26.4)#904 |
| 35. | Antioch | 32.2% | 6.3%(+25.9)#35 | 6.0%(+26.2)#911 |
| 36. | Sharpsville | 32.1% | 6.3%(+25.8)#36 | 6.0%(+26.1)#919 |
| 37. | Summitville | 31.6% | 6.3%(+25.3)#37 | 6.0%(+25.6)#936 |
| 38. | Mellott | 31.6% | 6.3%(+25.3)#38 | 6.0%(+25.6)#946 |
| 39. | Landess | 31.2% | 6.3%(+24.9)#39 | 6.0%(+25.3)#973 |
| 40. | North Liberty | 30.2% | 6.3%(+23.9)#40 | 6.0%(+24.2)#1,031 |
| 41. | Chalmers | 29.7% | 6.3%(+23.4)#41 | 6.0%(+23.7)#1,063 |
| 42. | Staunton | 29.4% | 6.3%(+23.1)#42 | 6.0%(+23.4)#1,084 |
| 43. | West Harrison | 28.6% | 6.3%(+22.3)#43 | 6.0%(+22.6)#1,127 |
| 44. | Somerville | 28.6% | 6.3%(+22.3)#44 | 6.0%(+22.6)#1,134 |
| 45. | Wilkinson | 27.8% | 6.3%(+21.5)#45 | 6.0%(+21.8)#1,209 |
| 46. | Oxford | 27.1% | 6.3%(+20.8)#46 | 6.0%(+21.1)#1,284 |
| 47. | Little York | 26.7% | 6.3%(+20.4)#47 | 6.0%(+20.7)#1,317 |
| 48. | Earl Park | 26.5% | 6.3%(+20.2)#48 | 6.0%(+20.5)#1,339 |
| 49. | Stinesville | 26.4% | 6.3%(+20.1)#49 | 6.0%(+20.4)#1,345 |
| 50. | Bretzville | 25.9% | 6.3%(+19.6)#50 | 6.0%(+19.9)#1,379 |
| 51. | Chesterfield | 25.2% | 6.3%(+18.9)#51 | 6.0%(+19.2)#1,419 |
| 52. | Cromwell | 25.0% | 6.3%(+18.7)#52 | 6.0%(+19.0)#1,437 |
| 53. | Paragon | 25.0% | 6.3%(+18.7)#53 | 6.0%(+19.0)#1,438 |
| 54. | Macy | 25.0% | 6.3%(+18.7)#54 | 6.0%(+19.0)#1,467 |
| 55. | Harmony | 24.4% | 6.3%(+18.1)#55 | 6.0%(+18.4)#1,539 |
| 56. | Spiceland | 24.3% | 6.3%(+18.0)#56 | 6.0%(+18.3)#1,550 |
| 57. | Chandler | 24.3% | 6.3%(+18.0)#57 | 6.0%(+18.3)#1,556 |
| 58. | Ridgeville | 24.0% | 6.3%(+17.7)#58 | 6.0%(+18.0)#1,594 |
| 59. | Losantville | 24.0% | 6.3%(+17.7)#59 | 6.0%(+18.0)#1,598 |
| 60. | St Joe | 23.5% | 6.3%(+17.2)#60 | 6.0%(+17.5)#1,641 |
| 61. | Wolcottville | 23.3% | 6.3%(+17.0)#61 | 6.0%(+17.3)#1,671 |
| 62. | Fish Lake | 23.2% | 6.3%(+16.9)#62 | 6.0%(+17.2)#1,682 |
| 63. | Hudson | 22.9% | 6.3%(+16.6)#63 | 6.0%(+16.9)#1,730 |
| 64. | State Line City | 22.2% | 6.3%(+15.9)#64 | 6.0%(+16.2)#1,820 |
| 65. | Mineral Springs | 21.8% | 6.3%(+15.5)#65 | 6.0%(+15.8)#1,885 |
| 66. | Selma | 21.7% | 6.3%(+15.4)#66 | 6.0%(+15.7)#1,888 |
| 67. | Bloomfield | 21.7% | 6.3%(+15.4)#67 | 6.0%(+15.7)#1,896 |
| 68. | Altona | 21.4% | 6.3%(+15.1)#68 | 6.0%(+15.4)#1,936 |
| 69. | New Washington | 21.3% | 6.3%(+15.0)#69 | 6.0%(+15.3)#1,956 |
| 70. | Monon | 21.2% | 6.3%(+14.9)#70 | 6.0%(+15.2)#1,974 |
| 71. | Charlottesville | 21.1% | 6.3%(+14.7)#71 | 6.0%(+15.1)#1,996 |
| 72. | Marshall | 21.1% | 6.3%(+14.7)#72 | 6.0%(+15.1)#1,998 |
| 73. | Otter Lake | 20.8% | 6.3%(+14.5)#73 | 6.0%(+14.8)#2,032 |
| 74. | Shamrock Lakes | 20.6% | 6.3%(+14.3)#74 | 6.0%(+14.6)#2,056 |
| 75. | Rosedale | 20.3% | 6.3%(+14.0)#75 | 6.0%(+14.3)#2,102 |
| 76. | Van Buren | 20.3% | 6.3%(+14.0)#76 | 6.0%(+14.3)#2,104 |
| 77. | Saratoga | 20.0% | 6.3%(+13.7)#77 | 6.0%(+14.0)#2,178 |
| 78. | Switz City | 20.0% | 6.3%(+13.7)#78 | 6.0%(+14.0)#2,180 |
| 79. | River Forest | 20.0% | 6.3%(+13.7)#79 | 6.0%(+14.0)#2,220 |
| 80. | Boswell | 19.6% | 6.3%(+13.3)#80 | 6.0%(+13.6)#2,277 |
| 81. | Lake Station | 19.2% | 6.3%(+12.9)#81 | 6.0%(+13.2)#2,361 |
| 82. | Richland | 19.0% | 6.3%(+12.7)#82 | 6.0%(+13.0)#2,410 |
| 83. | La Paz | 18.9% | 6.3%(+12.6)#83 | 6.0%(+12.9)#2,422 |
| 84. | Crothersville | 18.5% | 6.3%(+12.2)#84 | 6.0%(+12.5)#2,495 |
| 85. | East Chicago | 18.5% | 6.3%(+12.2)#85 | 6.0%(+12.5)#2,508 |
| 86. | Heritage Lake | 18.4% | 6.3%(+12.1)#86 | 6.0%(+12.4)#2,525 |
| 87. | Highland | 18.4% | 6.3%(+12.1)#87 | 6.0%(+12.4)#2,532 |
| 88. | Merom | 18.2% | 6.3%(+11.9)#88 | 6.0%(+12.2)#2,579 |
| 89. | Benton | 18.1% | 6.3%(+11.8)#89 | 6.0%(+12.1)#2,604 |
| 90. | Milan | 18.0% | 6.3%(+11.7)#90 | 6.0%(+12.0)#2,626 |
| 91. | Haysville | 17.9% | 6.3%(+11.6)#91 | 6.0%(+11.9)#2,651 |
| 92. | New Market | 17.8% | 6.3%(+11.5)#92 | 6.0%(+11.8)#2,668 |
| 93. | Daleville | 17.7% | 6.3%(+11.4)#93 | 6.0%(+11.7)#2,695 |
| 94. | Peru | 16.9% | 6.3%(+10.6)#94 | 6.0%(+10.9)#2,904 |
| 95. | Beech Grove | 16.8% | 6.3%(+10.5)#95 | 6.0%(+10.8)#2,924 |
| 96. | Milton | 16.7% | 6.3%(+10.4)#96 | 6.0%(+10.7)#2,985 |
| 97. | Underwood | 16.4% | 6.3%(+10.1)#97 | 6.0%(+10.4)#3,089 |
| 98. | Center Point | 16.4% | 6.3%(+10.1)#98 | 6.0%(+10.4)#3,100 |
| 99. | Dale | 16.3% | 6.3%(+10.00)#99 | 6.0%(+10.3)#3,126 |
| 100. | Kouts | 16.2% | 6.3%(+9.93)#100 | 6.0%(+10.2)#3,148 |
Common Questions
What are the Top 10 Cities with the Highest Percentage of Population with a Degree in Arts and Humanities in Indiana?
Top 10 Cities with the Highest Percentage of Population with a Degree in Arts and Humanities in Indiana are:
What city has the Highest Percentage of Population with a Degree in Arts and Humanities in Indiana?
Ambia has the Highest Percentage of Population with a Degree in Arts and Humanities in Indiana with 100.0%.
What is the Percentage of Population with a Degree in Arts and Humanities in the State of Indiana?
Percentage of Population with a Degree in Arts and Humanities in Indiana is 6.3%.
What is the Percentage of Population with a Degree in Arts and Humanities in the United States?
Percentage of Population with a Degree in Arts and Humanities in the United States is 6.0%.