Cities with the Highest Percentage of Population with a Degree in Arts and Humanities in New Hampshire
RELATED REPORTS & OPTIONS
Arts and Humanities
New Hampshire
Compare Cities
Map of Cities with the Highest Percentage of Population with a Degree in Arts and Humanities in New Hampshire
0.0%
40.0%
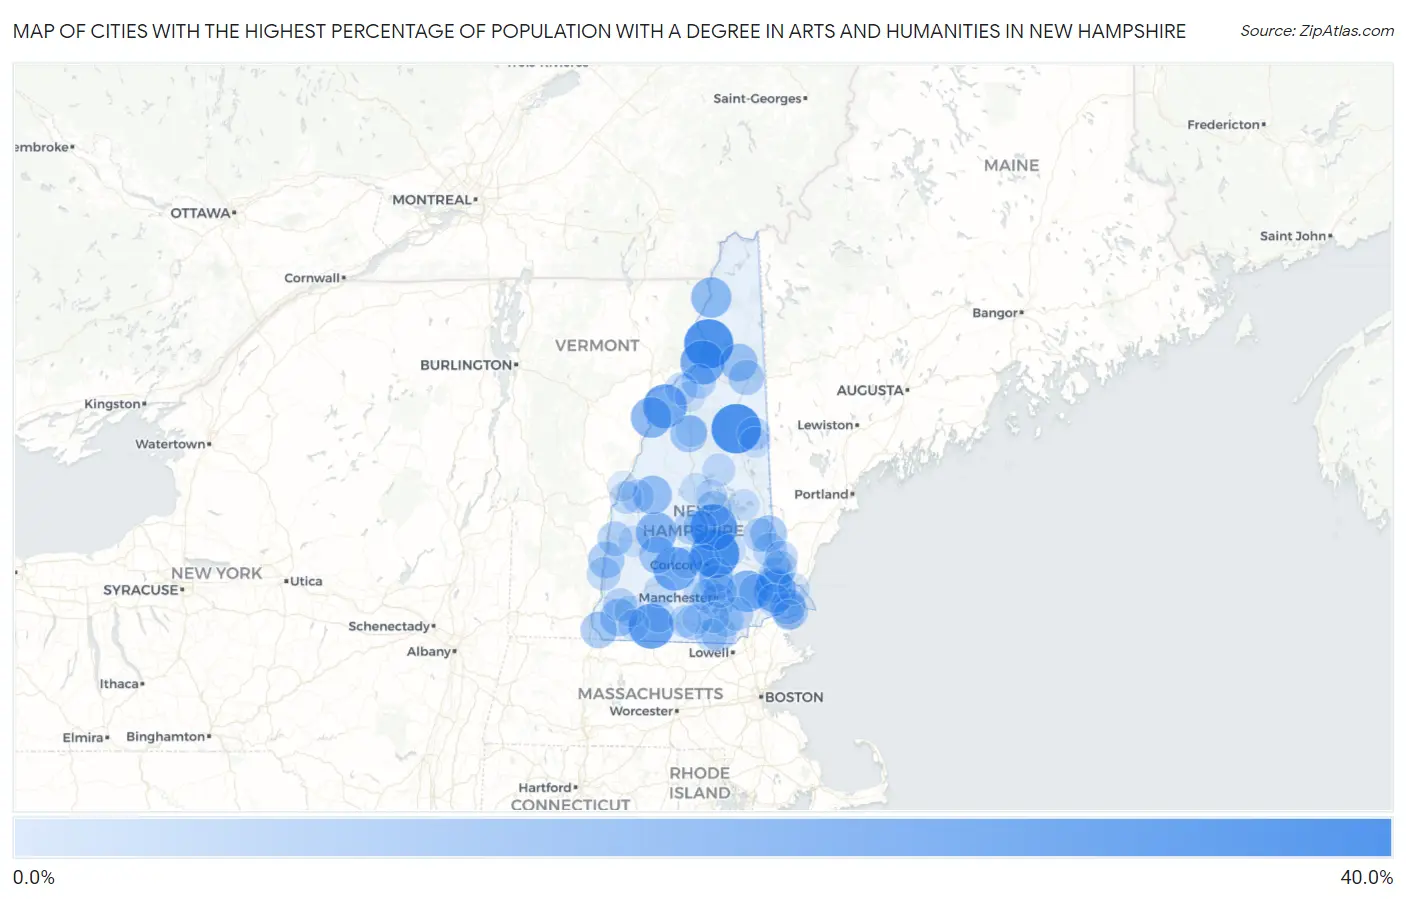
Cities with the Highest Percentage of Population with a Degree in Arts and Humanities in New Hampshire
| City | % Graduates | vs State | vs National | |
| 1. | Bartlett | 33.3% | 5.9%(+27.4)#1 | 6.0%(+27.3)#831 |
| 2. | Groveton | 32.6% | 5.9%(+26.7)#2 | 6.0%(+26.6)#894 |
| 3. | Loudon | 31.5% | 5.9%(+25.5)#3 | 6.0%(+25.5)#954 |
| 4. | Belmont | 28.3% | 5.9%(+22.4)#4 | 6.0%(+22.3)#1,167 |
| 5. | Jaffrey | 25.6% | 5.9%(+19.6)#5 | 6.0%(+19.6)#1,400 |
| 6. | Lancaster | 24.0% | 5.9%(+18.0)#6 | 6.0%(+18.0)#1,601 |
| 7. | Lisbon | 23.3% | 5.9%(+17.3)#7 | 6.0%(+17.3)#1,672 |
| 8. | Henniker | 23.0% | 5.9%(+17.1)#8 | 6.0%(+17.0)#1,710 |
| 9. | Newfields | 20.6% | 5.9%(+14.7)#9 | 6.0%(+14.6)#2,062 |
| 10. | Raymond | 19.3% | 5.9%(+13.4)#10 | 6.0%(+13.3)#2,330 |
| 11. | New London | 18.1% | 5.9%(+12.2)#11 | 6.0%(+12.1)#2,598 |
| 12. | Woodsville | 17.9% | 5.9%(+12.0)#12 | 6.0%(+11.9)#2,637 |
| 13. | Colebrook | 17.2% | 5.9%(+11.2)#13 | 6.0%(+11.2)#2,844 |
| 14. | Canaan | 14.3% | 5.9%(+8.35)#14 | 6.0%(+8.29)#3,929 |
| 15. | Berlin | 12.4% | 5.9%(+6.48)#15 | 6.0%(+6.42)#4,920 |
| 16. | West Swanzey | 12.4% | 5.9%(+6.46)#16 | 6.0%(+6.40)#4,928 |
| 17. | Bradford | 11.8% | 5.9%(+5.89)#17 | 6.0%(+5.83)#5,320 |
| 18. | North Woodstock | 11.6% | 5.9%(+5.61)#18 | 6.0%(+5.56)#5,511 |
| 19. | Milton | 11.3% | 5.9%(+5.31)#19 | 6.0%(+5.25)#5,735 |
| 20. | Newmarket | 10.8% | 5.9%(+4.82)#20 | 6.0%(+4.76)#6,118 |
| 21. | Charlestown | 10.6% | 5.9%(+4.69)#21 | 6.0%(+4.63)#6,250 |
| 22. | Hinsdale | 10.4% | 5.9%(+4.51)#22 | 6.0%(+4.45)#6,435 |
| 23. | Hampton Beach | 10.2% | 5.9%(+4.28)#23 | 6.0%(+4.22)#6,639 |
| 24. | Hampton | 10.2% | 5.9%(+4.25)#24 | 6.0%(+4.19)#6,662 |
| 25. | Gorham | 9.0% | 5.9%(+3.03)#25 | 6.0%(+2.97)#8,088 |
| 26. | Laconia | 8.8% | 5.9%(+2.82)#26 | 6.0%(+2.76)#8,349 |
| 27. | Durham | 8.6% | 5.9%(+2.68)#27 | 6.0%(+2.62)#8,531 |
| 28. | Hudson | 8.3% | 5.9%(+2.40)#28 | 6.0%(+2.34)#8,877 |
| 29. | Hooksett | 7.9% | 5.9%(+2.01)#29 | 6.0%(+1.95)#9,488 |
| 30. | Milford | 7.9% | 5.9%(+2.00)#30 | 6.0%(+1.94)#9,504 |
| 31. | Klondike Corner | 7.8% | 5.9%(+1.86)#31 | 6.0%(+1.80)#9,713 |
| 32. | Pinardville | 7.7% | 5.9%(+1.75)#32 | 6.0%(+1.70)#9,852 |
| 33. | Epping | 7.7% | 5.9%(+1.71)#33 | 6.0%(+1.66)#9,946 |
| 34. | Claremont | 7.6% | 5.9%(+1.68)#34 | 6.0%(+1.62)#10,001 |
| 35. | Franklin | 7.2% | 5.9%(+1.27)#35 | 6.0%(+1.21)#10,681 |
| 36. | Whitefield | 7.1% | 5.9%(+1.20)#36 | 6.0%(+1.15)#10,792 |
| 37. | Manchester | 7.0% | 5.9%(+1.09)#37 | 6.0%(+1.03)#11,051 |
| 38. | New Boston | 7.0% | 5.9%(+1.04)#38 | 6.0%(+0.981)#11,148 |
| 39. | Rochester | 7.0% | 5.9%(+1.03)#39 | 6.0%(+0.975)#11,157 |
| 40. | Londonderry | 6.6% | 5.9%(+0.684)#40 | 6.0%(+0.627)#11,750 |
| 41. | Suncook | 6.6% | 5.9%(+0.683)#41 | 6.0%(+0.626)#11,752 |
| 42. | Derry | 6.5% | 5.9%(+0.512)#42 | 6.0%(+0.455)#12,075 |
| 43. | Dover | 6.2% | 5.9%(+0.273)#43 | 6.0%(+0.216)#12,523 |
| 44. | Tilton Northfield | 6.2% | 5.9%(+0.265)#44 | 6.0%(+0.207)#12,539 |
| 45. | Farmington | 6.2% | 5.9%(+0.235)#45 | 6.0%(+0.177)#12,593 |
| 46. | Keene | 6.0% | 5.9%(+0.044)#46 | 6.0%(-0.013)#12,963 |
| 47. | North Walpole | 6.0% | 5.9%(+0.032)#47 | 6.0%(-0.025)#12,989 |
| 48. | Concord | 6.0% | 5.9%(+0.023)#48 | 6.0%(-0.035)#13,007 |
| 49. | Enfield | 5.8% | 5.9%(-0.122)#49 | 6.0%(-0.179)#13,260 |
| 50. | South Hooksett | 5.6% | 5.9%(-0.387)#50 | 6.0%(-0.444)#13,808 |
| 51. | Somersworth | 5.4% | 5.9%(-0.587)#51 | 6.0%(-0.644)#14,168 |
| 52. | North Conway | 5.2% | 5.9%(-0.735)#52 | 6.0%(-0.793)#14,443 |
| 53. | Nashua | 4.7% | 5.9%(-1.21)#53 | 6.0%(-1.27)#15,355 |
| 54. | Exeter | 4.6% | 5.9%(-1.32)#54 | 6.0%(-1.38)#15,558 |
| 55. | Center Sandwich | 4.6% | 5.9%(-1.32)#55 | 6.0%(-1.38)#15,574 |
| 56. | Littleton | 4.4% | 5.9%(-1.55)#56 | 6.0%(-1.61)#16,011 |
| 57. | Goffstown | 4.3% | 5.9%(-1.59)#57 | 6.0%(-1.65)#16,133 |
| 58. | Peterborough | 4.1% | 5.9%(-1.80)#58 | 6.0%(-1.86)#16,527 |
| 59. | Lebanon | 4.1% | 5.9%(-1.86)#59 | 6.0%(-1.92)#16,626 |
| 60. | Wilton | 3.9% | 5.9%(-2.07)#60 | 6.0%(-2.12)#16,978 |
| 61. | Portsmouth | 3.0% | 5.9%(-2.93)#61 | 6.0%(-2.98)#18,491 |
| 62. | Lincoln | 3.0% | 5.9%(-2.94)#62 | 6.0%(-3.00)#18,521 |
| 63. | Antrim | 2.9% | 5.9%(-3.02)#63 | 6.0%(-3.07)#18,639 |
| 64. | Contoocook | 2.8% | 5.9%(-3.10)#64 | 6.0%(-3.16)#18,777 |
| 65. | Pittsfield | 2.6% | 5.9%(-3.35)#65 | 6.0%(-3.40)#19,147 |
| 66. | Wolfeboro | 2.6% | 5.9%(-3.35)#66 | 6.0%(-3.41)#19,156 |
| 67. | Ashland | 2.5% | 5.9%(-3.48)#67 | 6.0%(-3.53)#19,319 |
| 68. | Marlborough | 2.4% | 5.9%(-3.54)#68 | 6.0%(-3.59)#19,424 |
| 69. | East Merrimack | 2.4% | 5.9%(-3.57)#69 | 6.0%(-3.63)#19,474 |
| 70. | Newport | 2.1% | 5.9%(-3.83)#70 | 6.0%(-3.89)#19,809 |
| 71. | Meredith | 2.1% | 5.9%(-3.85)#71 | 6.0%(-3.91)#19,833 |
| 72. | Conway | 1.8% | 5.9%(-4.12)#72 | 6.0%(-4.18)#20,143 |
| 73. | Troy | 1.7% | 5.9%(-4.22)#73 | 6.0%(-4.28)#20,269 |
| 74. | Seabrook Beach | 1.5% | 5.9%(-4.48)#74 | 6.0%(-4.53)#20,486 |
| 75. | Bethlehem | 1.4% | 5.9%(-4.55)#75 | 6.0%(-4.61)#20,553 |
| 76. | Amherst | 1.0% | 5.9%(-4.90)#76 | 6.0%(-4.96)#20,795 |
| 77. | Hanover | 0.81% | 5.9%(-5.13)#77 | 6.0%(-5.19)#20,918 |
1
Common Questions
What are the Top 10 Cities with the Highest Percentage of Population with a Degree in Arts and Humanities in New Hampshire?
Top 10 Cities with the Highest Percentage of Population with a Degree in Arts and Humanities in New Hampshire are:
What city has the Highest Percentage of Population with a Degree in Arts and Humanities in New Hampshire?
Bartlett has the Highest Percentage of Population with a Degree in Arts and Humanities in New Hampshire with 33.3%.
What is the Percentage of Population with a Degree in Arts and Humanities in the State of New Hampshire?
Percentage of Population with a Degree in Arts and Humanities in New Hampshire is 5.9%.
What is the Percentage of Population with a Degree in Arts and Humanities in the United States?
Percentage of Population with a Degree in Arts and Humanities in the United States is 6.0%.