Cities with the Highest Percentage of Population with a Degree in Arts and Humanities in North Dakota
RELATED REPORTS & OPTIONS
Arts and Humanities
North Dakota
Compare Cities
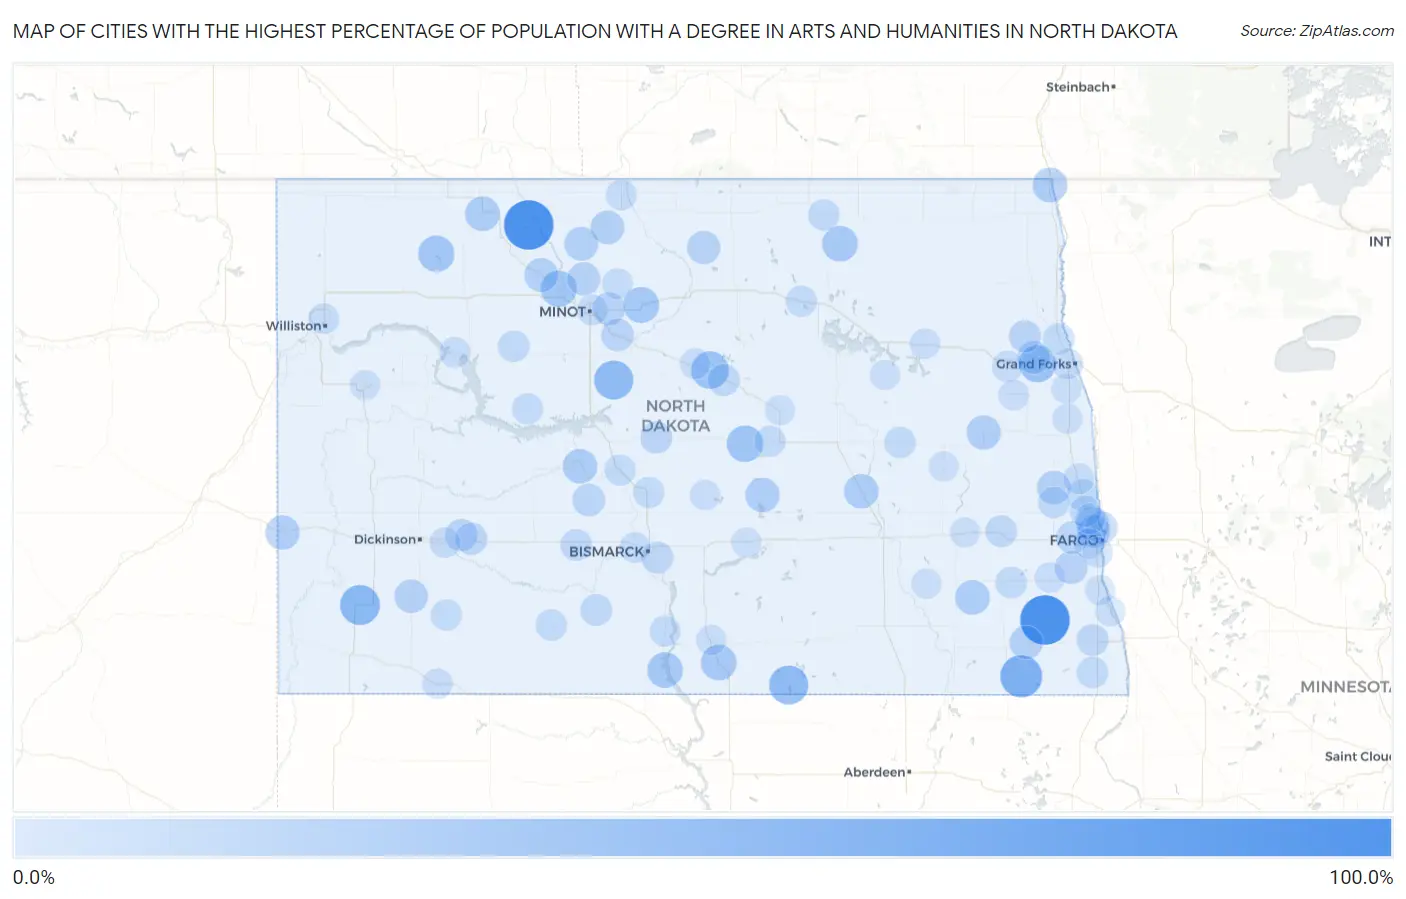
Map of Cities with the Highest Percentage of Population with a Degree in Arts and Humanities in North Dakota
0.0%
100.0%
Cities with the Highest Percentage of Population with a Degree in Arts and Humanities in North Dakota
| City | % Graduates | vs State | vs National | |
| 1. | Mcleod | 100.0% | 9.0%(+91.0)#1 | 6.0%(+94.0)#114 |
| 2. | Tolley | 100.0% | 9.0%(+91.0)#2 | 6.0%(+94.0)#124 |
| 3. | Rutland | 63.6% | 9.0%(+54.6)#3 | 6.0%(+57.6)#238 |
| 4. | Amidon | 53.8% | 9.0%(+44.8)#4 | 6.0%(+47.9)#323 |
| 5. | Benedict | 50.0% | 9.0%(+41.0)#5 | 6.0%(+44.0)#366 |
| 6. | Venturia | 50.0% | 9.0%(+41.0)#6 | 6.0%(+44.0)#409 |
| 7. | Anamoose | 42.4% | 9.0%(+33.4)#7 | 6.0%(+36.4)#505 |
| 8. | Emerado | 40.0% | 9.0%(+31.0)#8 | 6.0%(+34.0)#561 |
| 9. | Hurdsfield | 37.5% | 9.0%(+28.5)#9 | 6.0%(+31.5)#671 |
| 10. | Powers Lake | 36.2% | 9.0%(+27.2)#10 | 6.0%(+30.2)#710 |
| 11. | Foxholm | 35.7% | 9.0%(+26.7)#11 | 6.0%(+29.7)#726 |
| 12. | Granville | 34.6% | 9.0%(+25.6)#12 | 6.0%(+28.6)#770 |
| 13. | Strasburg | 33.3% | 9.0%(+24.3)#13 | 6.0%(+27.3)#807 |
| 14. | Fort Yates | 33.3% | 9.0%(+24.3)#14 | 6.0%(+27.3)#852 |
| 15. | Egeland | 33.3% | 9.0%(+24.3)#15 | 6.0%(+27.3)#863 |
| 16. | Trenton | 31.9% | 9.0%(+22.9)#16 | 6.0%(+25.9)#925 |
| 17. | Pembina | 29.2% | 9.0%(+20.2)#17 | 6.0%(+23.2)#1,094 |
| 18. | Bowbells | 29.1% | 9.0%(+20.1)#18 | 6.0%(+23.1)#1,099 |
| 19. | Stanton | 28.6% | 9.0%(+19.6)#19 | 6.0%(+22.6)#1,120 |
| 20. | Fort Ransom | 28.6% | 9.0%(+19.6)#20 | 6.0%(+22.6)#1,146 |
| 21. | Pingree | 28.6% | 9.0%(+19.6)#21 | 6.0%(+22.6)#1,154 |
| 22. | Beach | 27.4% | 9.0%(+18.4)#22 | 6.0%(+21.4)#1,245 |
| 23. | Robinson | 27.3% | 9.0%(+18.3)#23 | 6.0%(+21.3)#1,270 |
| 24. | Finley | 26.6% | 9.0%(+17.6)#24 | 6.0%(+20.6)#1,323 |
| 25. | Lansford | 25.0% | 9.0%(+16.0)#25 | 6.0%(+19.0)#1,460 |
| 26. | Carpio | 25.0% | 9.0%(+16.0)#26 | 6.0%(+19.0)#1,480 |
| 27. | Maxbass | 25.0% | 9.0%(+16.0)#27 | 6.0%(+19.0)#1,492 |
| 28. | Milnor | 23.5% | 9.0%(+14.5)#28 | 6.0%(+17.5)#1,640 |
| 29. | Hunter | 23.5% | 9.0%(+14.5)#29 | 6.0%(+17.5)#1,644 |
| 30. | New England | 23.4% | 9.0%(+14.4)#30 | 6.0%(+17.4)#1,659 |
| 31. | Willow City | 23.1% | 9.0%(+14.1)#31 | 6.0%(+17.1)#1,707 |
| 32. | Harwood | 22.5% | 9.0%(+13.5)#32 | 6.0%(+16.5)#1,772 |
| 33. | Minot Afb | 22.2% | 9.0%(+13.2)#33 | 6.0%(+16.2)#1,827 |
| 34. | Grand Forks Afb | 21.3% | 9.0%(+12.2)#34 | 6.0%(+15.3)#1,959 |
| 35. | Davenport | 20.8% | 9.0%(+11.8)#35 | 6.0%(+14.8)#2,026 |
| 36. | Surrey | 20.5% | 9.0%(+11.5)#36 | 6.0%(+14.6)#2,066 |
| 37. | Reile S Acres | 20.5% | 9.0%(+11.5)#37 | 6.0%(+14.5)#2,080 |
| 38. | Center | 20.0% | 9.0%(+11.0)#38 | 6.0%(+14.0)#2,160 |
| 39. | Sawyer | 20.0% | 9.0%(+11.0)#39 | 6.0%(+14.0)#2,185 |
| 40. | Mapleton | 19.2% | 9.0%(+10.2)#40 | 6.0%(+13.2)#2,358 |
| 41. | North River | 18.2% | 9.0%(+9.17)#41 | 6.0%(+12.2)#2,591 |
| 42. | Taylor | 17.9% | 9.0%(+8.85)#42 | 6.0%(+11.9)#2,655 |
| 43. | Gilby | 17.8% | 9.0%(+8.77)#43 | 6.0%(+11.8)#2,670 |
| 44. | Mercer | 17.2% | 9.0%(+8.23)#44 | 6.0%(+11.2)#2,833 |
| 45. | Richardton | 17.1% | 9.0%(+8.08)#45 | 6.0%(+11.1)#2,863 |
| 46. | Mooreton | 16.7% | 9.0%(+7.66)#46 | 6.0%(+10.7)#3,026 |
| 47. | Martin | 16.7% | 9.0%(+7.66)#47 | 6.0%(+10.7)#3,047 |
| 48. | Apple Valley | 16.4% | 9.0%(+7.41)#48 | 6.0%(+10.4)#3,094 |
| 49. | Lincoln | 16.3% | 9.0%(+7.29)#49 | 6.0%(+10.3)#3,129 |
| 50. | Flasher | 15.9% | 9.0%(+6.90)#50 | 6.0%(+9.91)#3,249 |
| 51. | New Salem | 15.6% | 9.0%(+6.56)#51 | 6.0%(+9.58)#3,357 |
| 52. | Tower City | 15.6% | 9.0%(+6.54)#52 | 6.0%(+9.56)#3,370 |
| 53. | Enderlin | 15.4% | 9.0%(+6.37)#53 | 6.0%(+9.39)#3,413 |
| 54. | Gardner | 15.4% | 9.0%(+6.37)#54 | 6.0%(+9.39)#3,455 |
| 55. | Hankinson | 15.3% | 9.0%(+6.27)#55 | 6.0%(+9.28)#3,490 |
| 56. | Rocklake | 14.8% | 9.0%(+5.80)#56 | 6.0%(+8.82)#3,682 |
| 57. | Arthur | 14.3% | 9.0%(+5.27)#57 | 6.0%(+8.29)#3,901 |
| 58. | Plaza | 14.3% | 9.0%(+5.27)#58 | 6.0%(+8.29)#3,916 |
| 59. | Glenfield | 14.3% | 9.0%(+5.27)#59 | 6.0%(+8.29)#3,946 |
| 60. | Leith | 14.3% | 9.0%(+5.27)#60 | 6.0%(+8.29)#3,949 |
| 61. | Manvel | 13.9% | 9.0%(+4.88)#61 | 6.0%(+7.89)#4,088 |
| 62. | Regent | 13.8% | 9.0%(+4.78)#62 | 6.0%(+7.80)#4,143 |
| 63. | Wilton | 13.8% | 9.0%(+4.75)#63 | 6.0%(+7.77)#4,156 |
| 64. | Leeds | 13.7% | 9.0%(+4.67)#64 | 6.0%(+7.69)#4,190 |
| 65. | Washburn | 13.6% | 9.0%(+4.54)#65 | 6.0%(+7.56)#4,246 |
| 66. | Argusville | 13.0% | 9.0%(+4.03)#66 | 6.0%(+7.05)#4,535 |
| 67. | Bowdon | 13.0% | 9.0%(+4.03)#67 | 6.0%(+7.05)#4,543 |
| 68. | White Shield | 12.8% | 9.0%(+3.81)#68 | 6.0%(+6.82)#4,673 |
| 69. | Cannon Ball | 12.7% | 9.0%(+3.72)#69 | 6.0%(+6.73)#4,715 |
| 70. | Larimore | 12.3% | 9.0%(+3.29)#70 | 6.0%(+6.30)#4,989 |
| 71. | New Town | 12.3% | 9.0%(+3.26)#71 | 6.0%(+6.28)#5,006 |
| 72. | Grandin | 11.8% | 9.0%(+2.75)#72 | 6.0%(+5.77)#5,385 |
| 73. | Grand Forks | 11.7% | 9.0%(+2.70)#73 | 6.0%(+5.71)#5,423 |
| 74. | Williston | 11.7% | 9.0%(+2.67)#74 | 6.0%(+5.68)#5,438 |
| 75. | Minot | 11.6% | 9.0%(+2.63)#75 | 6.0%(+5.65)#5,456 |
| 76. | Mandan | 11.6% | 9.0%(+2.59)#76 | 6.0%(+5.60)#5,478 |
| 77. | Gladstone | 11.1% | 9.0%(+2.10)#77 | 6.0%(+5.12)#5,847 |
| 78. | Deering | 11.1% | 9.0%(+2.10)#78 | 6.0%(+5.12)#5,879 |
| 79. | Westhope | 11.0% | 9.0%(+1.96)#79 | 6.0%(+4.98)#5,961 |
| 80. | Northwood | 10.8% | 9.0%(+1.83)#80 | 6.0%(+4.85)#6,059 |
| 81. | Drake | 10.7% | 9.0%(+1.70)#81 | 6.0%(+4.72)#6,157 |
| 82. | Brooktree Park | 10.7% | 9.0%(+1.66)#82 | 6.0%(+4.67)#6,209 |
| 83. | Leonard | 10.5% | 9.0%(+1.52)#83 | 6.0%(+4.53)#6,366 |
| 84. | Wing | 10.5% | 9.0%(+1.52)#84 | 6.0%(+4.53)#6,371 |
| 85. | West Fargo | 10.3% | 9.0%(+1.25)#85 | 6.0%(+4.26)#6,579 |
| 86. | Hettinger | 10.2% | 9.0%(+1.16)#86 | 6.0%(+4.17)#6,682 |
| 87. | Lakota | 10.0% | 9.0%(+0.989)#87 | 6.0%(+4.00)#6,852 |
| 88. | Frontier | 9.6% | 9.0%(+0.604)#88 | 6.0%(+3.62)#7,301 |
| 89. | Linton | 9.6% | 9.0%(+0.558)#89 | 6.0%(+3.57)#7,340 |
| 90. | Abercrombie | 9.4% | 9.0%(+0.364)#90 | 6.0%(+3.38)#7,575 |
| 91. | Warwick | 9.4% | 9.0%(+0.364)#91 | 6.0%(+3.38)#7,578 |
| 92. | Christine | 9.1% | 9.0%(+0.080)#92 | 6.0%(+3.10)#7,960 |
| 93. | Marion | 9.1% | 9.0%(+0.080)#93 | 6.0%(+3.10)#7,967 |
| 94. | Hannaford | 9.1% | 9.0%(+0.080)#94 | 6.0%(+3.10)#7,970 |
| 95. | Steele | 9.0% | 9.0%(+0.016)#95 | 6.0%(+3.03)#8,016 |
| 96. | Thompson | 8.9% | 9.0%(-0.130)#96 | 6.0%(+2.89)#8,198 |
| 97. | Buxton | 8.8% | 9.0%(-0.188)#97 | 6.0%(+2.83)#8,266 |
| 98. | Valley City | 8.8% | 9.0%(-0.232)#98 | 6.0%(+2.78)#8,319 |
| 99. | Fessenden | 8.8% | 9.0%(-0.239)#99 | 6.0%(+2.78)#8,333 |
| 100. | Watford City | 8.6% | 9.0%(-0.392)#100 | 6.0%(+2.62)#8,534 |
Common Questions
What are the Top 10 Cities with the Highest Percentage of Population with a Degree in Arts and Humanities in North Dakota?
Top 10 Cities with the Highest Percentage of Population with a Degree in Arts and Humanities in North Dakota are:
#1
100.0%
#2
100.0%
#3
63.6%
#4
53.8%
#5
50.0%
#6
50.0%
#7
42.4%
#8
40.0%
#9
37.5%
#10
36.2%
What city has the Highest Percentage of Population with a Degree in Arts and Humanities in North Dakota?
Mcleod has the Highest Percentage of Population with a Degree in Arts and Humanities in North Dakota with 100.0%.
What is the Percentage of Population with a Degree in Arts and Humanities in the State of North Dakota?
Percentage of Population with a Degree in Arts and Humanities in North Dakota is 9.0%.
What is the Percentage of Population with a Degree in Arts and Humanities in the United States?
Percentage of Population with a Degree in Arts and Humanities in the United States is 6.0%.