Cities with the Highest Percentage of Population with a Degree in Arts and Humanities in Illinois
RELATED REPORTS & OPTIONS
Arts and Humanities
Illinois
Compare Cities
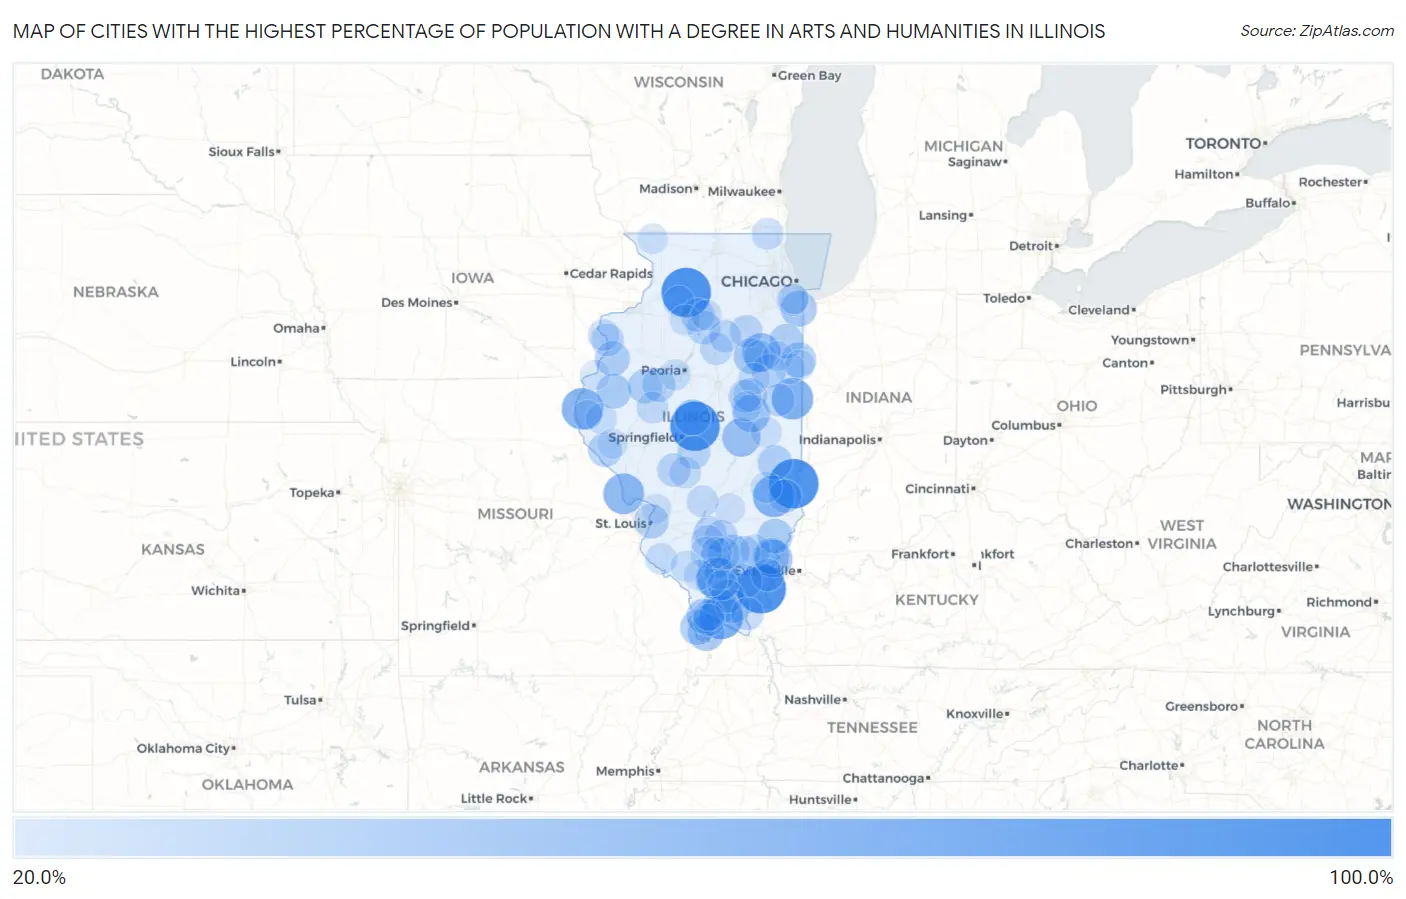
Map of Cities with the Highest Percentage of Population with a Degree in Arts and Humanities in Illinois
0.0%
100.0%
Cities with the Highest Percentage of Population with a Degree in Arts and Humanities in Illinois
| City | % Graduates | vs State | vs National | |
| 1. | Nachusa | 100.0% | 5.5%(+94.5)#1 | 6.0%(+94.0)#66 |
| 2. | West York | 100.0% | 5.5%(+94.5)#2 | 6.0%(+94.0)#68 |
| 3. | Burton | 100.0% | 5.5%(+94.5)#3 | 6.0%(+94.0)#76 |
| 4. | Harmon | 100.0% | 5.5%(+94.5)#4 | 6.0%(+94.0)#90 |
| 5. | Elwin | 100.0% | 5.5%(+94.5)#5 | 6.0%(+94.0)#98 |
| 6. | Junction | 100.0% | 5.5%(+94.5)#6 | 6.0%(+94.0)#100 |
| 7. | Cornland | 100.0% | 5.5%(+94.5)#7 | 6.0%(+94.0)#111 |
| 8. | Freeman Spur | 75.0% | 5.5%(+69.5)#8 | 6.0%(+69.0)#174 |
| 9. | Belknap | 75.0% | 5.5%(+69.5)#9 | 6.0%(+69.0)#180 |
| 10. | Henning | 66.7% | 5.5%(+61.2)#10 | 6.0%(+60.7)#208 |
| 11. | Willow Hill | 66.7% | 5.5%(+61.2)#11 | 6.0%(+60.7)#210 |
| 12. | Lima | 66.7% | 5.5%(+61.2)#12 | 6.0%(+60.7)#215 |
| 13. | Batchtown | 63.3% | 5.5%(+57.8)#13 | 6.0%(+57.3)#240 |
| 14. | Kempton | 54.5% | 5.5%(+49.1)#14 | 6.0%(+48.5)#311 |
| 15. | Hammond | 53.1% | 5.5%(+47.6)#15 | 6.0%(+47.1)#329 |
| 16. | Seymour | 50.0% | 5.5%(+44.5)#16 | 6.0%(+44.0)#365 |
| 17. | Phillipstown | 50.0% | 5.5%(+44.5)#17 | 6.0%(+44.0)#399 |
| 18. | Mounds | 46.8% | 5.5%(+41.3)#18 | 6.0%(+40.8)#434 |
| 19. | Broadwell | 44.4% | 5.5%(+39.0)#19 | 6.0%(+38.4)#464 |
| 20. | Ford Heights | 44.3% | 5.5%(+38.8)#20 | 6.0%(+38.3)#469 |
| 21. | Crossville | 43.2% | 5.5%(+37.7)#21 | 6.0%(+37.2)#488 |
| 22. | Saunemin | 41.4% | 5.5%(+35.9)#22 | 6.0%(+35.4)#526 |
| 23. | Buncombe | 41.4% | 5.5%(+35.9)#23 | 6.0%(+35.4)#527 |
| 24. | Olive Branch | 40.0% | 5.5%(+34.5)#24 | 6.0%(+34.0)#559 |
| 25. | Iroquois | 40.0% | 5.5%(+34.5)#25 | 6.0%(+34.0)#570 |
| 26. | Bone Gap | 40.0% | 5.5%(+34.5)#26 | 6.0%(+34.0)#572 |
| 27. | Tennessee | 40.0% | 5.5%(+34.5)#27 | 6.0%(+34.0)#582 |
| 28. | Mill Creek | 40.0% | 5.5%(+34.5)#28 | 6.0%(+34.0)#588 |
| 29. | Biggsville | 39.3% | 5.5%(+33.8)#29 | 6.0%(+33.3)#606 |
| 30. | Aroma Park | 38.5% | 5.5%(+33.0)#30 | 6.0%(+32.5)#625 |
| 31. | Brooklyn | 38.5% | 5.5%(+33.0)#31 | 6.0%(+32.5)#626 |
| 32. | Westfield | 38.2% | 5.5%(+32.7)#32 | 6.0%(+32.2)#634 |
| 33. | Smithfield | 38.1% | 5.5%(+32.6)#33 | 6.0%(+32.1)#642 |
| 34. | Baileyville | 37.1% | 5.5%(+31.6)#34 | 6.0%(+31.1)#675 |
| 35. | Raleigh | 36.8% | 5.5%(+31.3)#35 | 6.0%(+30.8)#686 |
| 36. | Thawville | 36.4% | 5.5%(+30.9)#36 | 6.0%(+30.4)#701 |
| 37. | El Dara | 36.4% | 5.5%(+30.9)#37 | 6.0%(+30.4)#704 |
| 38. | Simpson | 35.7% | 5.5%(+30.2)#38 | 6.0%(+29.7)#727 |
| 39. | Mark | 35.6% | 5.5%(+30.1)#39 | 6.0%(+29.6)#731 |
| 40. | Belle Rive | 35.5% | 5.5%(+30.0)#40 | 6.0%(+29.5)#733 |
| 41. | Malden | 34.8% | 5.5%(+29.3)#41 | 6.0%(+28.8)#764 |
| 42. | Taylor Ridge | 34.6% | 5.5%(+29.1)#42 | 6.0%(+28.6)#771 |
| 43. | St David | 34.3% | 5.5%(+28.8)#43 | 6.0%(+28.3)#781 |
| 44. | Creal Springs | 33.3% | 5.5%(+27.8)#44 | 6.0%(+27.3)#817 |
| 45. | Bulpitt | 33.3% | 5.5%(+27.8)#45 | 6.0%(+27.3)#834 |
| 46. | Standard City | 33.3% | 5.5%(+27.8)#46 | 6.0%(+27.3)#839 |
| 47. | Stoy | 33.3% | 5.5%(+27.8)#47 | 6.0%(+27.3)#843 |
| 48. | Belle Prairie City | 33.3% | 5.5%(+27.8)#48 | 6.0%(+27.3)#868 |
| 49. | Foosland | 33.3% | 5.5%(+27.8)#49 | 6.0%(+27.3)#876 |
| 50. | Sesser | 32.8% | 5.5%(+27.3)#50 | 6.0%(+26.8)#889 |
| 51. | Bellflower | 32.5% | 5.5%(+27.0)#51 | 6.0%(+26.5)#897 |
| 52. | Wamac | 31.2% | 5.5%(+25.8)#52 | 6.0%(+25.3)#966 |
| 53. | Golconda | 31.0% | 5.5%(+25.5)#53 | 6.0%(+25.0)#981 |
| 54. | Verona | 31.0% | 5.5%(+25.5)#54 | 6.0%(+25.0)#982 |
| 55. | Dix | 31.0% | 5.5%(+25.5)#55 | 6.0%(+25.0)#988 |
| 56. | Keithsburg | 30.8% | 5.5%(+25.3)#56 | 6.0%(+24.8)#995 |
| 57. | New Haven | 30.8% | 5.5%(+25.3)#57 | 6.0%(+24.8)#997 |
| 58. | Richview | 30.8% | 5.5%(+25.3)#58 | 6.0%(+24.8)#1,002 |
| 59. | Bonnie | 30.6% | 5.5%(+25.1)#59 | 6.0%(+24.6)#1,011 |
| 60. | Bush | 30.0% | 5.5%(+24.5)#60 | 6.0%(+24.0)#1,039 |
| 61. | Rutland | 30.0% | 5.5%(+24.5)#61 | 6.0%(+24.0)#1,047 |
| 62. | Penfield | 30.0% | 5.5%(+24.5)#62 | 6.0%(+24.0)#1,048 |
| 63. | Kangley | 29.7% | 5.5%(+24.2)#63 | 6.0%(+23.7)#1,064 |
| 64. | Ullin | 28.4% | 5.5%(+22.9)#64 | 6.0%(+22.4)#1,165 |
| 65. | Cullom | 28.0% | 5.5%(+22.5)#65 | 6.0%(+22.0)#1,189 |
| 66. | Du Bois | 28.0% | 5.5%(+22.5)#66 | 6.0%(+22.0)#1,193 |
| 67. | Posen | 27.7% | 5.5%(+22.2)#67 | 6.0%(+21.7)#1,220 |
| 68. | Bath | 27.3% | 5.5%(+21.8)#68 | 6.0%(+21.3)#1,257 |
| 69. | Raymond | 27.2% | 5.5%(+21.7)#69 | 6.0%(+21.2)#1,272 |
| 70. | Mulberry Grove | 27.1% | 5.5%(+21.6)#70 | 6.0%(+21.1)#1,281 |
| 71. | Lake Catherine | 27.0% | 5.5%(+21.5)#71 | 6.0%(+21.0)#1,287 |
| 72. | Dongola | 26.8% | 5.5%(+21.3)#72 | 6.0%(+20.8)#1,300 |
| 73. | New Boston | 26.8% | 5.5%(+21.3)#73 | 6.0%(+20.8)#1,301 |
| 74. | Orient | 26.7% | 5.5%(+21.2)#74 | 6.0%(+20.7)#1,314 |
| 75. | Sibley | 26.7% | 5.5%(+21.2)#75 | 6.0%(+20.7)#1,316 |
| 76. | Ruma | 25.7% | 5.5%(+20.2)#76 | 6.0%(+19.7)#1,391 |
| 77. | Waltonville | 25.0% | 5.5%(+19.5)#77 | 6.0%(+19.0)#1,446 |
| 78. | Cutler | 25.0% | 5.5%(+19.5)#78 | 6.0%(+19.0)#1,449 |
| 79. | Mill Shoals | 25.0% | 5.5%(+19.5)#79 | 6.0%(+19.0)#1,475 |
| 80. | Deer Grove | 25.0% | 5.5%(+19.5)#80 | 6.0%(+19.0)#1,507 |
| 81. | Rose Hill | 25.0% | 5.5%(+19.5)#81 | 6.0%(+19.0)#1,511 |
| 82. | Lake Camelot | 24.1% | 5.5%(+18.6)#82 | 6.0%(+18.1)#1,576 |
| 83. | Camp Point | 24.1% | 5.5%(+18.6)#83 | 6.0%(+18.1)#1,585 |
| 84. | Wyanet | 23.9% | 5.5%(+18.4)#84 | 6.0%(+17.9)#1,608 |
| 85. | Villa Grove | 23.5% | 5.5%(+18.1)#85 | 6.0%(+17.6)#1,638 |
| 86. | Cherry | 23.1% | 5.5%(+17.6)#86 | 6.0%(+17.1)#1,697 |
| 87. | Apple Canyon Lake | 22.2% | 5.5%(+16.7)#87 | 6.0%(+16.2)#1,804 |
| 88. | Woodland | 22.2% | 5.5%(+16.7)#88 | 6.0%(+16.2)#1,813 |
| 89. | Vergennes | 22.2% | 5.5%(+16.7)#89 | 6.0%(+16.2)#1,814 |
| 90. | Plum Valley | 22.1% | 5.5%(+16.6)#90 | 6.0%(+16.1)#1,842 |
| 91. | Spillertown | 21.8% | 5.5%(+16.3)#91 | 6.0%(+15.8)#1,880 |
| 92. | Farina | 21.7% | 5.5%(+16.2)#92 | 6.0%(+15.7)#1,891 |
| 93. | Dixmoor | 21.7% | 5.5%(+16.2)#93 | 6.0%(+15.7)#1,897 |
| 94. | Hartford | 21.2% | 5.5%(+15.7)#94 | 6.0%(+15.2)#1,977 |
| 95. | Mendon | 21.1% | 5.5%(+15.6)#95 | 6.0%(+15.1)#1,988 |
| 96. | New Salem | 21.1% | 5.5%(+15.6)#96 | 6.0%(+15.1)#2,002 |
| 97. | Ashkum | 21.0% | 5.5%(+15.5)#97 | 6.0%(+15.0)#2,008 |
| 98. | Sheldon | 20.9% | 5.5%(+15.4)#98 | 6.0%(+14.9)#2,017 |
| 99. | Mansfield | 20.9% | 5.5%(+15.4)#99 | 6.0%(+14.9)#2,018 |
| 100. | Dallas City | 20.8% | 5.5%(+15.3)#100 | 6.0%(+14.8)#2,034 |
Common Questions
What are the Top 10 Cities with the Highest Percentage of Population with a Degree in Arts and Humanities in Illinois?
Top 10 Cities with the Highest Percentage of Population with a Degree in Arts and Humanities in Illinois are:
#1
100.0%
#2
100.0%
#3
100.0%
#4
100.0%
#5
75.0%
#6
75.0%
#7
66.7%
#8
66.7%
#9
66.7%
#10
63.3%
What city has the Highest Percentage of Population with a Degree in Arts and Humanities in Illinois?
West York has the Highest Percentage of Population with a Degree in Arts and Humanities in Illinois with 100.0%.
What is the Percentage of Population with a Degree in Arts and Humanities in the State of Illinois?
Percentage of Population with a Degree in Arts and Humanities in Illinois is 5.5%.
What is the Percentage of Population with a Degree in Arts and Humanities in the United States?
Percentage of Population with a Degree in Arts and Humanities in the United States is 6.0%.