Cities with the Highest Percentage of Population with a Degree in Arts and Humanities in Utah
RELATED REPORTS & OPTIONS
Arts and Humanities
Utah
Compare Cities
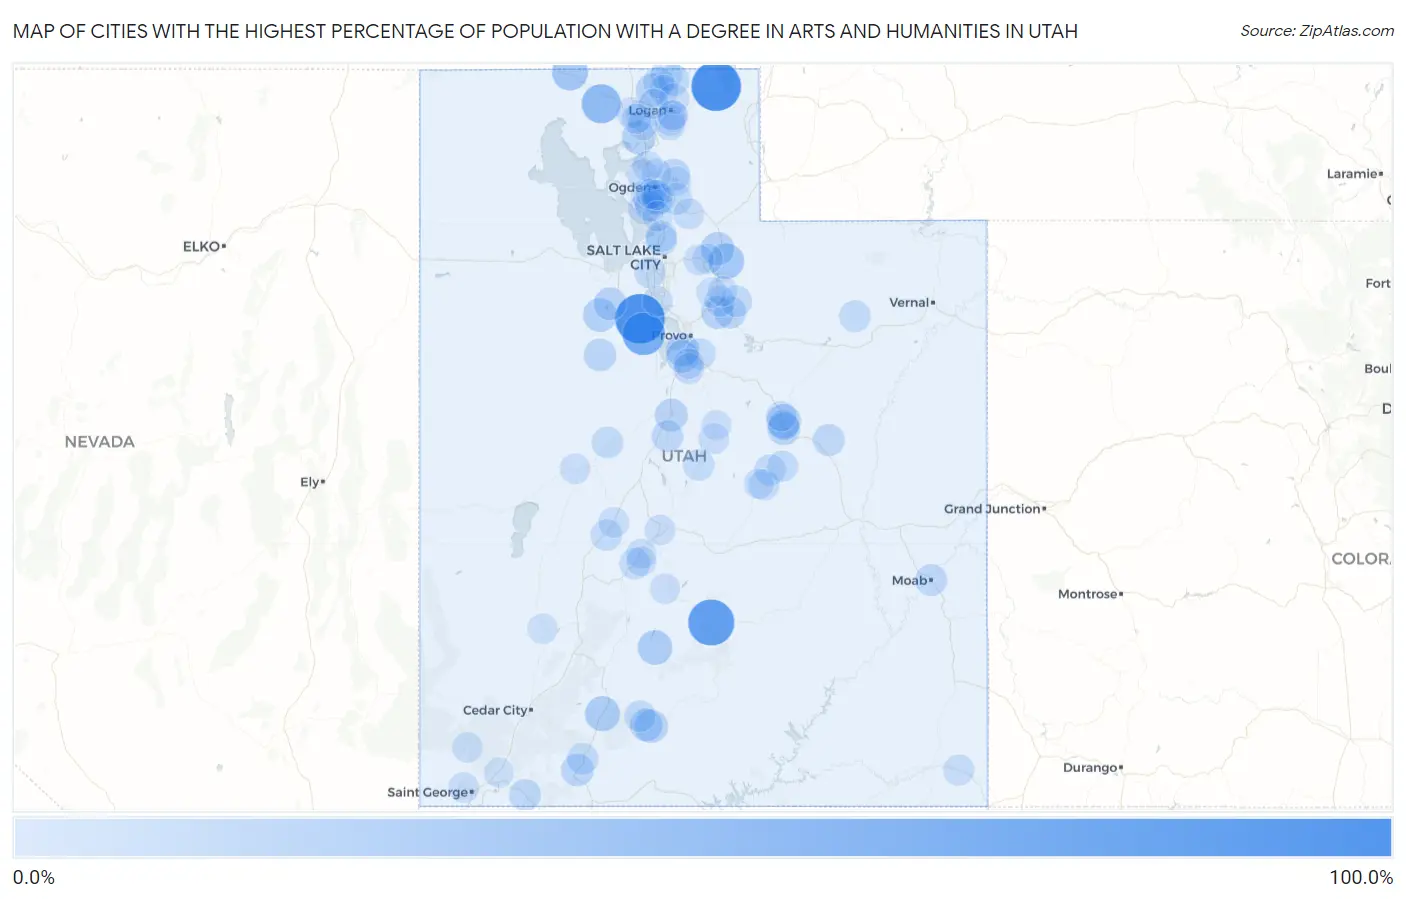
Map of Cities with the Highest Percentage of Population with a Degree in Arts and Humanities in Utah
0.0%
100.0%
Cities with the Highest Percentage of Population with a Degree in Arts and Humanities in Utah
| City | % Graduates | vs State | vs National | |
| 1. | Cedar Fort | 100.0% | 7.9%(+92.1)#1 | 6.0%(+94.0)#60 |
| 2. | Garden | 100.0% | 7.9%(+92.1)#2 | 6.0%(+94.0)#71 |
| 3. | Teasdale | 83.3% | 7.9%(+75.5)#3 | 6.0%(+77.3)#146 |
| 4. | Fairfield | 66.7% | 7.9%(+58.8)#4 | 6.0%(+60.7)#221 |
| 5. | Howell | 50.0% | 7.9%(+42.1)#5 | 6.0%(+44.0)#362 |
| 6. | Snowville | 36.4% | 7.9%(+28.5)#6 | 6.0%(+30.4)#700 |
| 7. | Peoa | 35.0% | 7.9%(+27.1)#7 | 6.0%(+29.0)#758 |
| 8. | Hatch | 31.6% | 7.9%(+23.7)#8 | 6.0%(+25.6)#947 |
| 9. | Antimony | 30.0% | 7.9%(+22.1)#9 | 6.0%(+24.0)#1,051 |
| 10. | Spring Glen | 28.4% | 7.9%(+20.6)#10 | 6.0%(+22.4)#1,161 |
| 11. | Rush Valley | 26.7% | 7.9%(+18.8)#11 | 6.0%(+20.7)#1,312 |
| 12. | Corinne | 25.5% | 7.9%(+17.6)#12 | 6.0%(+19.5)#1,402 |
| 13. | Wanship | 24.4% | 7.9%(+16.5)#13 | 6.0%(+18.4)#1,543 |
| 14. | Newton | 24.2% | 7.9%(+16.4)#14 | 6.0%(+18.2)#1,558 |
| 15. | Henrieville | 24.1% | 7.9%(+16.3)#15 | 6.0%(+18.1)#1,575 |
| 16. | Lake Shore | 23.1% | 7.9%(+15.2)#16 | 6.0%(+17.1)#1,689 |
| 17. | West Wood | 22.3% | 7.9%(+14.5)#17 | 6.0%(+16.3)#1,792 |
| 18. | Cannonville | 21.9% | 7.9%(+14.0)#18 | 6.0%(+15.9)#1,875 |
| 19. | Stockton | 21.6% | 7.9%(+13.7)#19 | 6.0%(+15.6)#1,906 |
| 20. | Benjamin | 21.6% | 7.9%(+13.7)#20 | 6.0%(+15.6)#1,911 |
| 21. | Nephi | 21.6% | 7.9%(+13.7)#21 | 6.0%(+15.6)#1,920 |
| 22. | Wallsburg | 21.4% | 7.9%(+13.5)#22 | 6.0%(+15.4)#1,940 |
| 23. | Vernon | 21.1% | 7.9%(+13.2)#23 | 6.0%(+15.1)#2,000 |
| 24. | Orderville | 21.0% | 7.9%(+13.1)#24 | 6.0%(+15.0)#2,005 |
| 25. | Eden | 19.4% | 7.9%(+11.5)#25 | 6.0%(+13.4)#2,315 |
| 26. | Independence | 19.4% | 7.9%(+11.5)#26 | 6.0%(+13.4)#2,323 |
| 27. | East Carbon | 17.7% | 7.9%(+9.81)#27 | 6.0%(+11.7)#2,692 |
| 28. | Apple Valley | 17.6% | 7.9%(+9.76)#28 | 6.0%(+11.7)#2,701 |
| 29. | Moab | 17.1% | 7.9%(+9.26)#29 | 6.0%(+11.1)#2,847 |
| 30. | Levan | 17.1% | 7.9%(+9.19)#30 | 6.0%(+11.1)#2,864 |
| 31. | Mountain Green | 16.8% | 7.9%(+8.96)#31 | 6.0%(+10.8)#2,918 |
| 32. | Timber Lakes | 16.8% | 7.9%(+8.90)#32 | 6.0%(+10.8)#2,926 |
| 33. | Glendale | 16.7% | 7.9%(+8.78)#33 | 6.0%(+10.7)#2,977 |
| 34. | Bluebell | 16.7% | 7.9%(+8.78)#34 | 6.0%(+10.7)#3,001 |
| 35. | Lynndyl | 16.7% | 7.9%(+8.78)#35 | 6.0%(+10.7)#3,034 |
| 36. | Woods Cross | 16.4% | 7.9%(+8.54)#36 | 6.0%(+10.4)#3,090 |
| 37. | Lewiston | 16.2% | 7.9%(+8.28)#37 | 6.0%(+10.2)#3,170 |
| 38. | Richmond | 16.0% | 7.9%(+8.13)#38 | 6.0%(+10.0)#3,204 |
| 39. | Kearns | 15.9% | 7.9%(+8.01)#39 | 6.0%(+9.90)#3,250 |
| 40. | Tropic | 15.6% | 7.9%(+7.74)#40 | 6.0%(+9.63)#3,344 |
| 41. | Meadow | 15.4% | 7.9%(+7.50)#41 | 6.0%(+9.39)#3,442 |
| 42. | Ephraim | 15.4% | 7.9%(+7.47)#42 | 6.0%(+9.36)#3,462 |
| 43. | Huntington | 15.1% | 7.9%(+7.25)#43 | 6.0%(+9.14)#3,542 |
| 44. | Trenton | 15.0% | 7.9%(+7.12)#44 | 6.0%(+9.00)#3,596 |
| 45. | Mapleton | 14.7% | 7.9%(+6.84)#45 | 6.0%(+8.73)#3,705 |
| 46. | Elsinore | 14.6% | 7.9%(+6.72)#46 | 6.0%(+8.61)#3,759 |
| 47. | Castle Dale | 14.2% | 7.9%(+6.34)#47 | 6.0%(+8.23)#3,970 |
| 48. | Plain City | 14.2% | 7.9%(+6.33)#48 | 6.0%(+8.22)#3,971 |
| 49. | West Bountiful | 14.2% | 7.9%(+6.30)#49 | 6.0%(+8.19)#3,980 |
| 50. | Cleveland | 14.0% | 7.9%(+6.12)#50 | 6.0%(+8.00)#4,040 |
| 51. | Nibley | 13.8% | 7.9%(+5.95)#51 | 6.0%(+7.84)#4,110 |
| 52. | Montezuma Creek | 13.8% | 7.9%(+5.91)#52 | 6.0%(+7.80)#4,139 |
| 53. | Roy | 13.7% | 7.9%(+5.81)#53 | 6.0%(+7.69)#4,187 |
| 54. | Carbonville | 13.5% | 7.9%(+5.63)#54 | 6.0%(+7.52)#4,258 |
| 55. | Elk Ridge | 13.4% | 7.9%(+5.52)#55 | 6.0%(+7.41)#4,308 |
| 56. | Daniel | 13.2% | 7.9%(+5.32)#56 | 6.0%(+7.21)#4,441 |
| 57. | Uintah | 13.2% | 7.9%(+5.30)#57 | 6.0%(+7.18)#4,459 |
| 58. | Morgan | 12.9% | 7.9%(+4.99)#58 | 6.0%(+6.88)#4,640 |
| 59. | Syracuse | 12.8% | 7.9%(+4.96)#59 | 6.0%(+6.85)#4,653 |
| 60. | Deweyville | 12.7% | 7.9%(+4.82)#60 | 6.0%(+6.70)#4,735 |
| 61. | Sunset | 12.5% | 7.9%(+4.62)#61 | 6.0%(+6.50)#4,813 |
| 62. | Millville | 12.3% | 7.9%(+4.43)#62 | 6.0%(+6.32)#4,975 |
| 63. | Mount Pleasant | 12.3% | 7.9%(+4.42)#63 | 6.0%(+6.30)#4,991 |
| 64. | Tremonton | 12.3% | 7.9%(+4.41)#64 | 6.0%(+6.29)#4,996 |
| 65. | Hyrum | 12.3% | 7.9%(+4.40)#65 | 6.0%(+6.29)#4,998 |
| 66. | Fillmore | 12.3% | 7.9%(+4.37)#66 | 6.0%(+6.26)#5,018 |
| 67. | Hyde Park | 12.2% | 7.9%(+4.33)#67 | 6.0%(+6.22)#5,047 |
| 68. | South Weber | 12.1% | 7.9%(+4.18)#68 | 6.0%(+6.06)#5,153 |
| 69. | Santa Clara | 12.0% | 7.9%(+4.14)#69 | 6.0%(+6.03)#5,180 |
| 70. | North Ogden | 12.0% | 7.9%(+4.08)#70 | 6.0%(+5.97)#5,221 |
| 71. | Clearfield | 11.9% | 7.9%(+4.02)#71 | 6.0%(+5.91)#5,257 |
| 72. | Aurora | 11.8% | 7.9%(+3.88)#72 | 6.0%(+5.77)#5,352 |
| 73. | Central | 11.7% | 7.9%(+3.86)#73 | 6.0%(+5.75)#5,397 |
| 74. | Salem | 11.5% | 7.9%(+3.66)#74 | 6.0%(+5.55)#5,518 |
| 75. | Silver Summit | 11.5% | 7.9%(+3.66)#75 | 6.0%(+5.55)#5,520 |
| 76. | South Willard | 11.5% | 7.9%(+3.65)#76 | 6.0%(+5.53)#5,542 |
| 77. | Hinckley | 11.4% | 7.9%(+3.52)#77 | 6.0%(+5.41)#5,624 |
| 78. | Summit Park | 11.3% | 7.9%(+3.41)#78 | 6.0%(+5.30)#5,702 |
| 79. | Koosharem | 11.1% | 7.9%(+3.23)#79 | 6.0%(+5.12)#5,848 |
| 80. | Richfield | 11.1% | 7.9%(+3.20)#80 | 6.0%(+5.09)#5,894 |
| 81. | Helper | 11.0% | 7.9%(+3.10)#81 | 6.0%(+4.99)#5,959 |
| 82. | Bluffdale | 10.9% | 7.9%(+3.06)#82 | 6.0%(+4.95)#5,978 |
| 83. | Minersville | 10.8% | 7.9%(+2.96)#83 | 6.0%(+4.85)#6,060 |
| 84. | South Ogden | 10.8% | 7.9%(+2.96)#84 | 6.0%(+4.84)#6,066 |
| 85. | Riverdale | 10.7% | 7.9%(+2.83)#85 | 6.0%(+4.71)#6,171 |
| 86. | Washington Terrace | 10.7% | 7.9%(+2.82)#86 | 6.0%(+4.71)#6,172 |
| 87. | Kaysville | 10.6% | 7.9%(+2.73)#87 | 6.0%(+4.62)#6,260 |
| 88. | White | 10.6% | 7.9%(+2.70)#88 | 6.0%(+4.58)#6,287 |
| 89. | Midway | 10.5% | 7.9%(+2.65)#89 | 6.0%(+4.54)#6,328 |
| 90. | Amalga | 10.5% | 7.9%(+2.60)#90 | 6.0%(+4.49)#6,405 |
| 91. | Heber | 10.5% | 7.9%(+2.59)#91 | 6.0%(+4.48)#6,411 |
| 92. | Central Valley | 10.5% | 7.9%(+2.58)#92 | 6.0%(+4.47)#6,420 |
| 93. | Huntsville | 10.3% | 7.9%(+2.46)#93 | 6.0%(+4.35)#6,505 |
| 94. | Providence | 10.3% | 7.9%(+2.43)#94 | 6.0%(+4.32)#6,529 |
| 95. | Honeyville | 10.3% | 7.9%(+2.37)#95 | 6.0%(+4.26)#6,581 |
| 96. | Orangeville | 10.2% | 7.9%(+2.36)#96 | 6.0%(+4.25)#6,604 |
| 97. | Leeds | 10.2% | 7.9%(+2.33)#97 | 6.0%(+4.22)#6,637 |
| 98. | Peter | 10.2% | 7.9%(+2.30)#98 | 6.0%(+4.19)#6,668 |
| 99. | Elwood | 10.2% | 7.9%(+2.27)#99 | 6.0%(+4.16)#6,696 |
| 100. | Fairview | 10.1% | 7.9%(+2.26)#100 | 6.0%(+4.15)#6,706 |
Common Questions
What are the Top 10 Cities with the Highest Percentage of Population with a Degree in Arts and Humanities in Utah?
Top 10 Cities with the Highest Percentage of Population with a Degree in Arts and Humanities in Utah are:
#1
100.0%
#2
100.0%
#3
83.3%
#4
66.7%
#5
50.0%
#6
36.4%
#7
35.0%
#8
31.6%
#9
30.0%
#10
28.4%
What city has the Highest Percentage of Population with a Degree in Arts and Humanities in Utah?
Cedar Fort has the Highest Percentage of Population with a Degree in Arts and Humanities in Utah with 100.0%.
What is the Percentage of Population with a Degree in Arts and Humanities in the State of Utah?
Percentage of Population with a Degree in Arts and Humanities in Utah is 7.9%.
What is the Percentage of Population with a Degree in Arts and Humanities in the United States?
Percentage of Population with a Degree in Arts and Humanities in the United States is 6.0%.