Arvin, CA Map & Demographics
Arvin Map
Arvin Overview
$14,900
PER CAPITA INCOME
$48,254
AVG FAMILY INCOME
$47,997
AVG HOUSEHOLD INCOME
20.9%
WAGE / INCOME GAP [ % ]
79.1¢/ $1
WAGE / INCOME GAP [ $ ]
$11,572
FAMILY INCOME DEFICIT
0.39
INEQUALITY / GINI INDEX
19,613
TOTAL POPULATION
10,015
MALE POPULATION
9,598
FEMALE POPULATION
104.34
MALES / 100 FEMALES
95.84
FEMALES / 100 MALES
24.9
MEDIAN AGE
4.5
AVG FAMILY SIZE
4.4
AVG HOUSEHOLD SIZE
8,172
LABOR FORCE [ PEOPLE ]
61.7%
PERCENT IN LABOR FORCE
11.1%
UNEMPLOYMENT RATE
Arvin Zip Codes
Arvin Area Codes
Income in Arvin
Income Overview in Arvin
Per Capita Income in Arvin is $14,900, while median incomes of families and households are $48,254 and $47,997 respectively.
| Characteristic | Number | Measure |
| Per Capita Income | 19,613 | $14,900 |
| Median Family Income | 4,098 | $48,254 |
| Mean Family Income | 4,098 | $60,694 |
| Median Household Income | 4,475 | $47,997 |
| Mean Household Income | 4,475 | $60,530 |
| Income Deficit | 4,098 | $11,572 |
| Wage / Income Gap (%) | 19,613 | 20.91% |
| Wage / Income Gap ($) | 19,613 | 79.09¢ per $1 |
| Gini / Inequality Index | 19,613 | 0.39 |
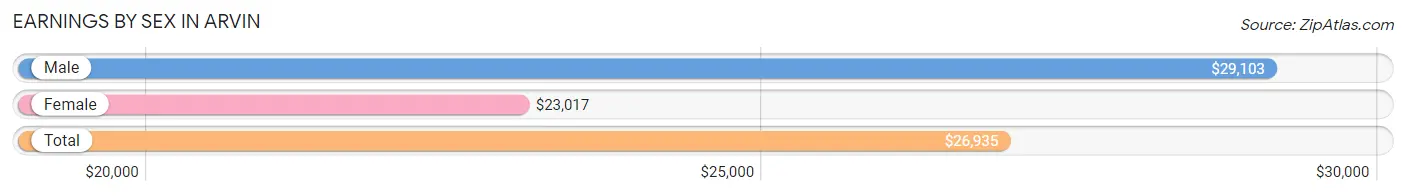
Earnings by Sex in Arvin
Average Earnings in Arvin are $26,935, $29,103 for men and $23,017 for women, a difference of 20.9%.
| Sex | Number | Average Earnings |
| Male | 4,898 (60.8%) | $29,103 |
| Female | 3,155 (39.2%) | $23,017 |
| Total | 8,053 (100.0%) | $26,935 |
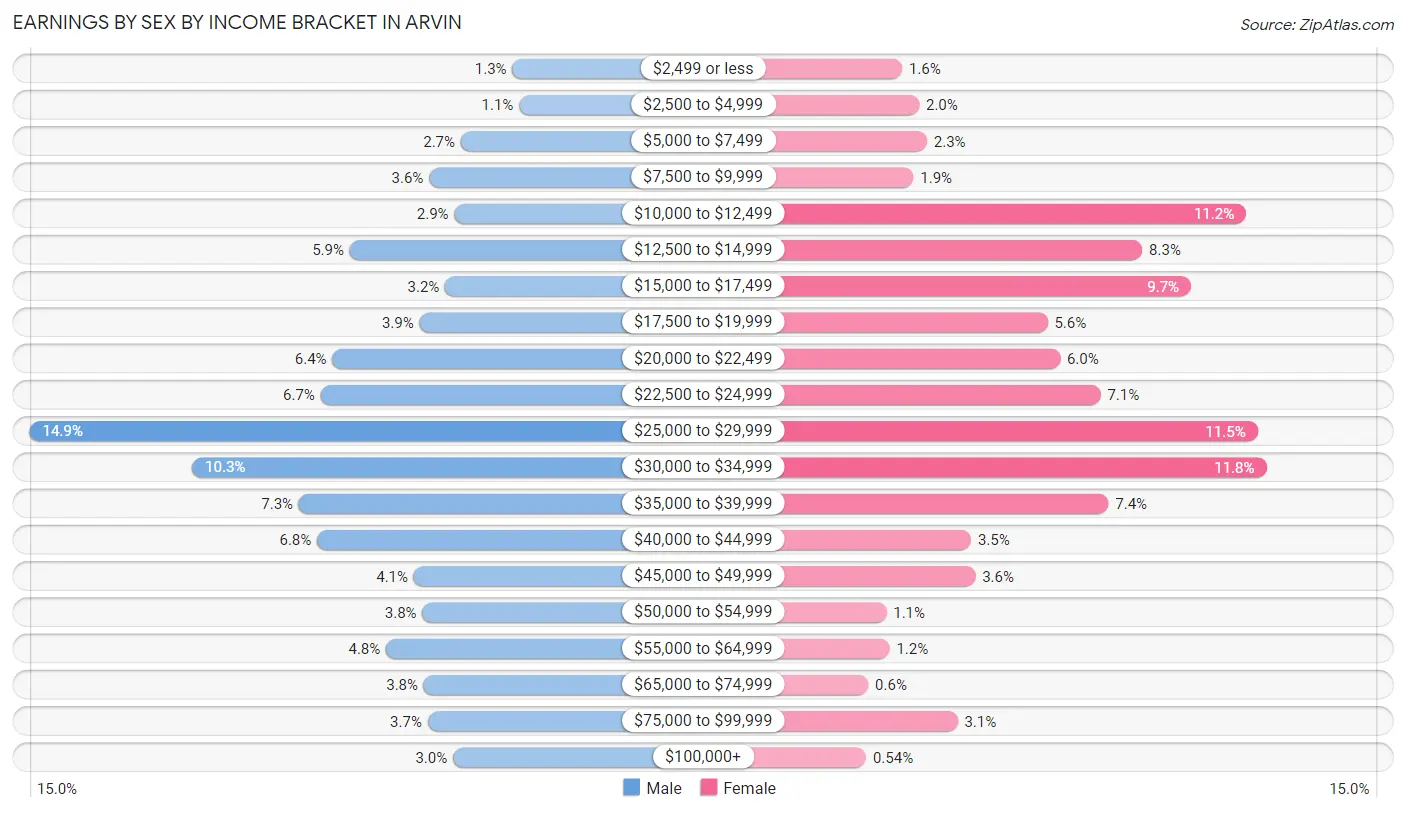
Earnings by Sex by Income Bracket in Arvin
The most common earnings brackets in Arvin are $25,000 to $29,999 for men (728 | 14.9%) and $30,000 to $34,999 for women (372 | 11.8%).
| Income | Male | Female |
| $2,499 or less | 63 (1.3%) | 49 (1.5%) |
| $2,500 to $4,999 | 54 (1.1%) | 64 (2.0%) |
| $5,000 to $7,499 | 134 (2.7%) | 71 (2.2%) |
| $7,500 to $9,999 | 178 (3.6%) | 59 (1.9%) |
| $10,000 to $12,499 | 143 (2.9%) | 354 (11.2%) |
| $12,500 to $14,999 | 287 (5.9%) | 262 (8.3%) |
| $15,000 to $17,499 | 156 (3.2%) | 305 (9.7%) |
| $17,500 to $19,999 | 191 (3.9%) | 178 (5.6%) |
| $20,000 to $22,499 | 311 (6.4%) | 189 (6.0%) |
| $22,500 to $24,999 | 327 (6.7%) | 225 (7.1%) |
| $25,000 to $29,999 | 728 (14.9%) | 364 (11.5%) |
| $30,000 to $34,999 | 504 (10.3%) | 372 (11.8%) |
| $35,000 to $39,999 | 357 (7.3%) | 232 (7.3%) |
| $40,000 to $44,999 | 332 (6.8%) | 110 (3.5%) |
| $45,000 to $49,999 | 199 (4.1%) | 114 (3.6%) |
| $50,000 to $54,999 | 187 (3.8%) | 35 (1.1%) |
| $55,000 to $64,999 | 237 (4.8%) | 38 (1.2%) |
| $65,000 to $74,999 | 185 (3.8%) | 19 (0.6%) |
| $75,000 to $99,999 | 180 (3.7%) | 98 (3.1%) |
| $100,000+ | 145 (3.0%) | 17 (0.5%) |
| Total | 4,898 (100.0%) | 3,155 (100.0%) |
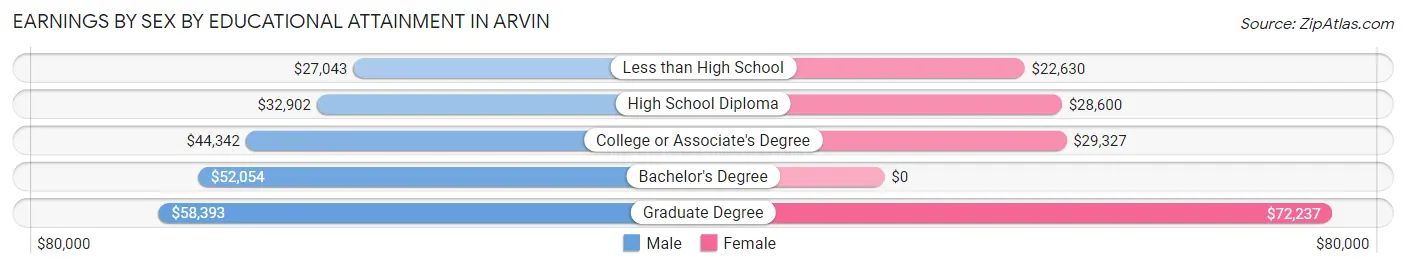
Earnings by Sex by Educational Attainment in Arvin
Average earnings in Arvin are $30,780 for men and $24,764 for women, a difference of 19.6%. Men with an educational attainment of graduate degree enjoy the highest average annual earnings of $58,393, while those with less than high school education earn the least with $27,043. Women with an educational attainment of graduate degree earn the most with the average annual earnings of $72,237, while those with less than high school education have the smallest earnings of $22,630.
| Educational Attainment | Male Income | Female Income |
| Less than High School | $27,043 | $22,630 |
| High School Diploma | $32,902 | $28,600 |
| College or Associate's Degree | $44,342 | $29,327 |
| Bachelor's Degree | $52,054 | $0 |
| Graduate Degree | $58,393 | $72,237 |
| Total | $30,780 | $24,764 |
Family Income in Arvin
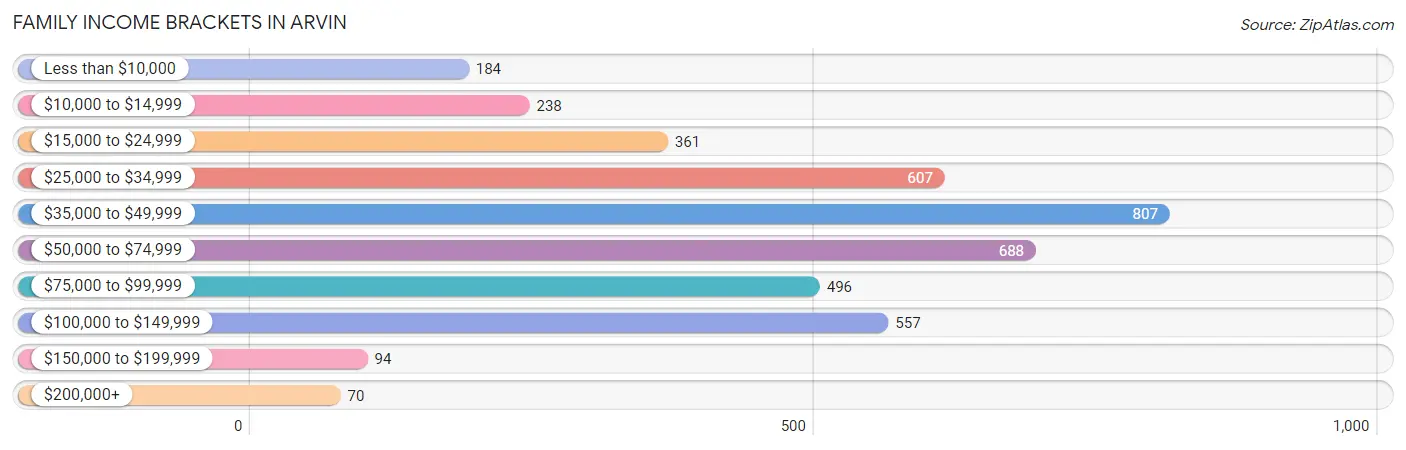
Family Income Brackets in Arvin
According to the Arvin family income data, there are 807 families falling into the $35,000 to $49,999 income range, which is the most common income bracket and makes up 19.7% of all families. Conversely, the $200,000+ income bracket is the least frequent group with only 70 families (1.7%) belonging to this category.
| Income Bracket | # Families | % Families |
| Less than $10,000 | 184 | 4.5% |
| $10,000 to $14,999 | 238 | 5.8% |
| $15,000 to $24,999 | 361 | 8.8% |
| $25,000 to $34,999 | 607 | 14.8% |
| $35,000 to $49,999 | 807 | 19.7% |
| $50,000 to $74,999 | 688 | 16.8% |
| $75,000 to $99,999 | 496 | 12.1% |
| $100,000 to $149,999 | 557 | 13.6% |
| $150,000 to $199,999 | 94 | 2.3% |
| $200,000+ | 70 | 1.7% |
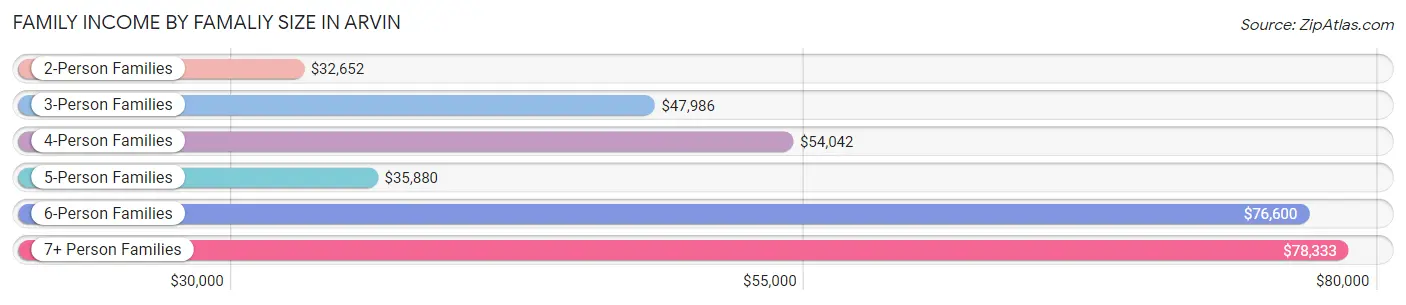
Family Income by Famaliy Size in Arvin
7+ person families (420 | 10.2%) account for the highest median family income in Arvin with $78,333 per family, while 2-person families (740 | 18.1%) have the highest median income of $16,326 per family member.
| Income Bracket | # Families | Median Income |
| 2-Person Families | 740 (18.1%) | $32,652 |
| 3-Person Families | 983 (24.0%) | $47,986 |
| 4-Person Families | 910 (22.2%) | $54,042 |
| 5-Person Families | 625 (15.2%) | $35,880 |
| 6-Person Families | 420 (10.2%) | $76,600 |
| 7+ Person Families | 420 (10.2%) | $78,333 |
| Total | 4,098 (100.0%) | $48,254 |
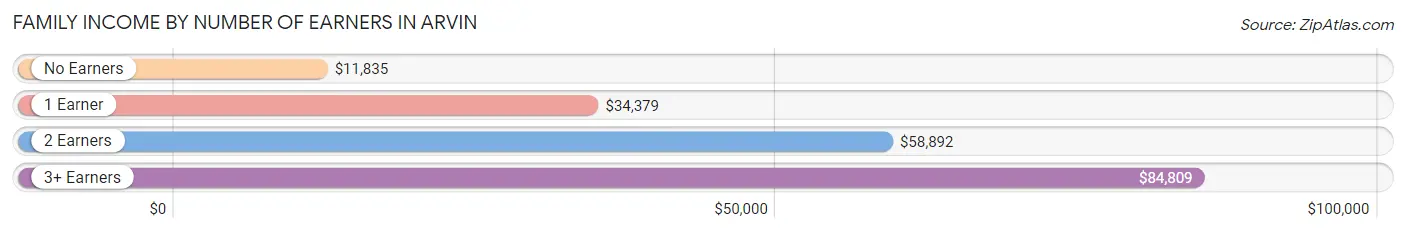
Family Income by Number of Earners in Arvin
The median family income in Arvin is $48,254, with families comprising 3+ earners (805) having the highest median family income of $84,809, while families with no earners (371) have the lowest median family income of $11,835, accounting for 19.6% and 9.0% of families, respectively.
| Number of Earners | # Families | Median Income |
| No Earners | 371 (9.0%) | $11,835 |
| 1 Earner | 1,621 (39.6%) | $34,379 |
| 2 Earners | 1,301 (31.8%) | $58,892 |
| 3+ Earners | 805 (19.6%) | $84,809 |
| Total | 4,098 (100.0%) | $48,254 |
Household Income in Arvin
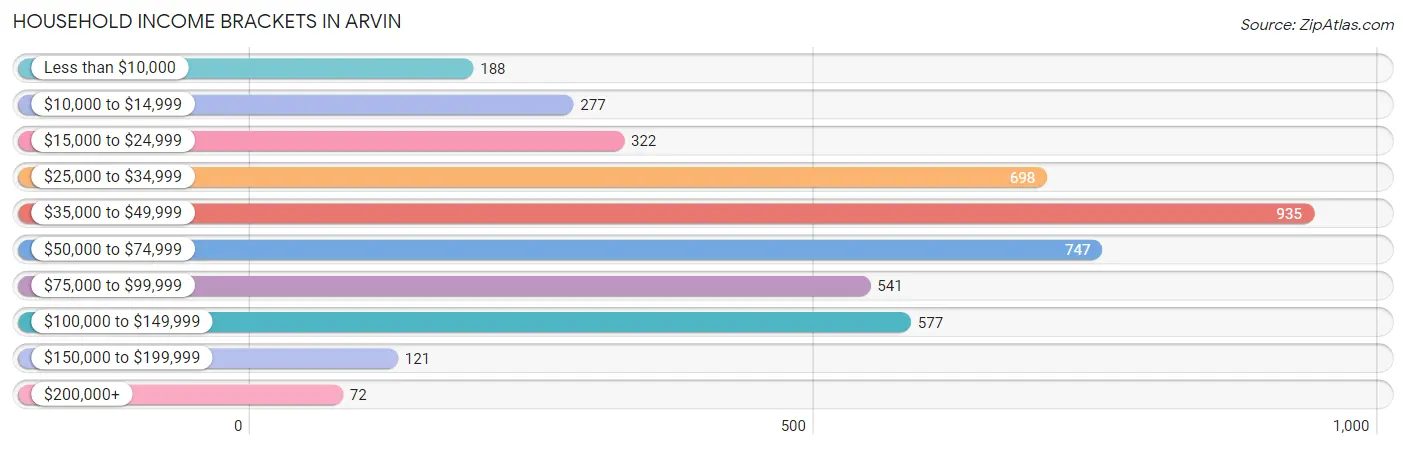
Household Income Brackets in Arvin
With 935 households falling in the category, the $35,000 to $49,999 income range is the most frequent in Arvin, accounting for 20.9% of all households. In contrast, only 72 households (1.6%) fall into the $200,000+ income bracket, making it the least populous group.
| Income Bracket | # Households | % Households |
| Less than $10,000 | 188 | 4.2% |
| $10,000 to $14,999 | 277 | 6.2% |
| $15,000 to $24,999 | 322 | 7.2% |
| $25,000 to $34,999 | 698 | 15.6% |
| $35,000 to $49,999 | 935 | 20.9% |
| $50,000 to $74,999 | 747 | 16.7% |
| $75,000 to $99,999 | 541 | 12.1% |
| $100,000 to $149,999 | 577 | 12.9% |
| $150,000 to $199,999 | 121 | 2.7% |
| $200,000+ | 72 | 1.6% |
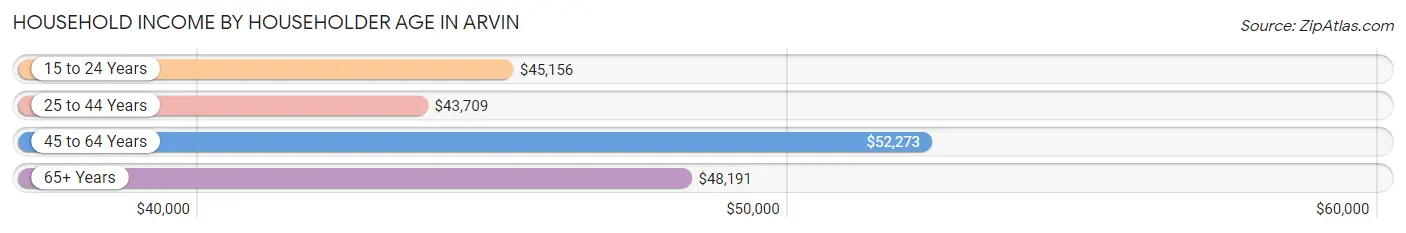
Household Income by Householder Age in Arvin
The median household income in Arvin is $47,997, with the highest median household income of $52,273 found in the 45 to 64 years age bracket for the primary householder. A total of 1,584 households (35.4%) fall into this category. Meanwhile, the 25 to 44 years age bracket for the primary householder has the lowest median household income of $43,709, with 2,240 households (50.1%) in this group.
| Income Bracket | # Households | Median Income |
| 15 to 24 Years | 181 (4.0%) | $45,156 |
| 25 to 44 Years | 2,240 (50.1%) | $43,709 |
| 45 to 64 Years | 1,584 (35.4%) | $52,273 |
| 65+ Years | 470 (10.5%) | $48,191 |
| Total | 4,475 (100.0%) | $47,997 |
Poverty in Arvin
Income Below Poverty by Sex and Age in Arvin
With 25.5% poverty level for males and 32.1% for females among the residents of Arvin, 5 year old males and 12 to 14 year old females are the most vulnerable to poverty, with 164 males (65.9%) and 242 females (49.6%) in their respective age groups living below the poverty level.
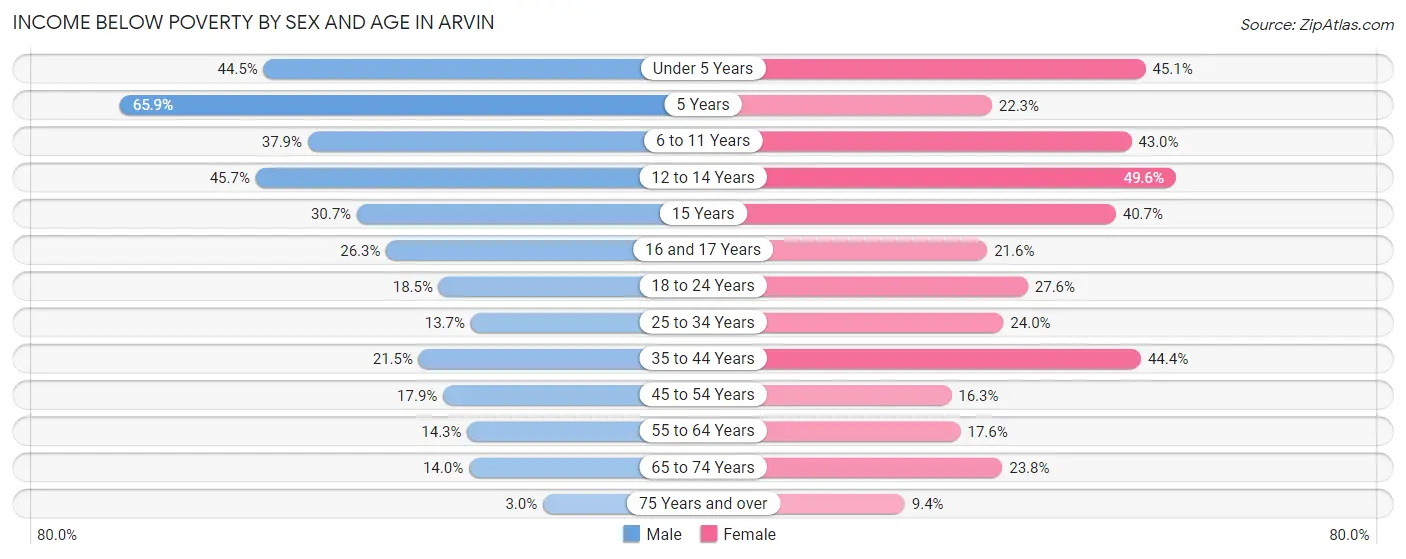
| Age Bracket | Male | Female |
| Under 5 Years | 437 (44.5%) | 437 (45.1%) |
| 5 Years | 164 (65.9%) | 43 (22.3%) |
| 6 to 11 Years | 390 (37.9%) | 614 (43.0%) |
| 12 to 14 Years | 307 (45.7%) | 242 (49.6%) |
| 15 Years | 57 (30.6%) | 59 (40.7%) |
| 16 and 17 Years | 112 (26.3%) | 73 (21.6%) |
| 18 to 24 Years | 277 (18.5%) | 334 (27.6%) |
| 25 to 34 Years | 217 (13.7%) | 293 (24.0%) |
| 35 to 44 Years | 259 (21.5%) | 594 (44.4%) |
| 45 to 54 Years | 153 (17.8%) | 175 (16.3%) |
| 55 to 64 Years | 110 (14.2%) | 116 (17.6%) |
| 65 to 74 Years | 51 (14.0%) | 61 (23.8%) |
| 75 Years and over | 4 (3.0%) | 22 (9.4%) |
| Total | 2,538 (25.5%) | 3,063 (32.1%) |
Income Above Poverty by Sex and Age in Arvin
According to the poverty statistics in Arvin, males aged 75 years and over and females aged 75 years and over are the age groups that are most secure financially, with 97.0% of males and 90.6% of females in these age groups living above the poverty line.
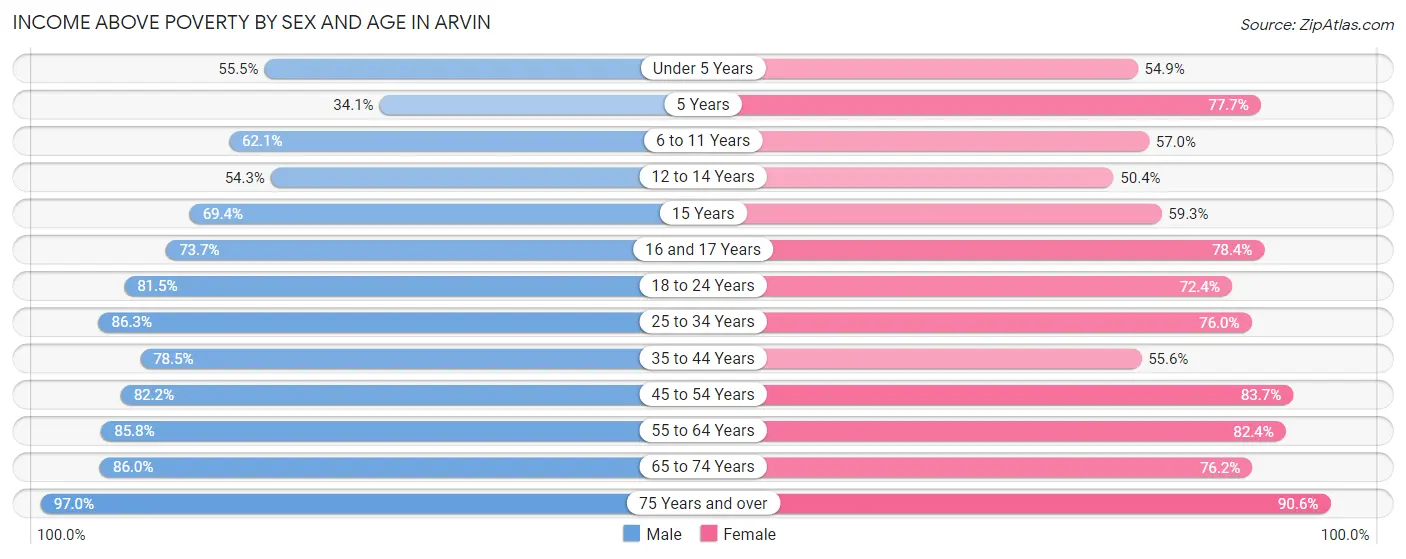
| Age Bracket | Male | Female |
| Under 5 Years | 545 (55.5%) | 532 (54.9%) |
| 5 Years | 85 (34.1%) | 150 (77.7%) |
| 6 to 11 Years | 638 (62.1%) | 814 (57.0%) |
| 12 to 14 Years | 365 (54.3%) | 246 (50.4%) |
| 15 Years | 129 (69.4%) | 86 (59.3%) |
| 16 and 17 Years | 314 (73.7%) | 265 (78.4%) |
| 18 to 24 Years | 1,220 (81.5%) | 875 (72.4%) |
| 25 to 34 Years | 1,362 (86.3%) | 928 (76.0%) |
| 35 to 44 Years | 948 (78.5%) | 743 (55.6%) |
| 45 to 54 Years | 704 (82.2%) | 901 (83.7%) |
| 55 to 64 Years | 662 (85.8%) | 542 (82.4%) |
| 65 to 74 Years | 313 (86.0%) | 195 (76.2%) |
| 75 Years and over | 129 (97.0%) | 213 (90.6%) |
| Total | 7,414 (74.5%) | 6,490 (67.9%) |
Income Below Poverty Among Married-Couple Families in Arvin
The poverty statistics for married-couple families in Arvin show that 18.5% or 503 of the total 2,719 families live below the poverty line. Families with 5 or more children have the highest poverty rate of 45.1%, comprising of 23 families. On the other hand, families with no children have the lowest poverty rate of 8.3%, which includes 74 families.
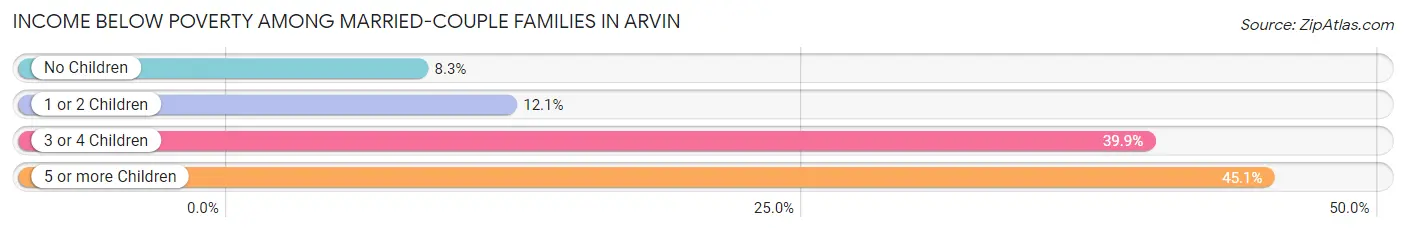
| Children | Above Poverty | Below Poverty |
| No Children | 823 (91.7%) | 74 (8.3%) |
| 1 or 2 Children | 951 (87.9%) | 131 (12.1%) |
| 3 or 4 Children | 414 (60.1%) | 275 (39.9%) |
| 5 or more Children | 28 (54.9%) | 23 (45.1%) |
| Total | 2,216 (81.5%) | 503 (18.5%) |
Income Below Poverty Among Single-Parent Households in Arvin
According to the poverty data in Arvin, 8.2% or 30 single-father households and 49.7% or 503 single-mother households are living below the poverty line. Among single-father households, those with no children have the highest poverty rate, with 12 households (11.1%) experiencing poverty. Likewise, among single-mother households, those with 5 or more children have the highest poverty rate, with 52 households (100.0%) falling below the poverty line.
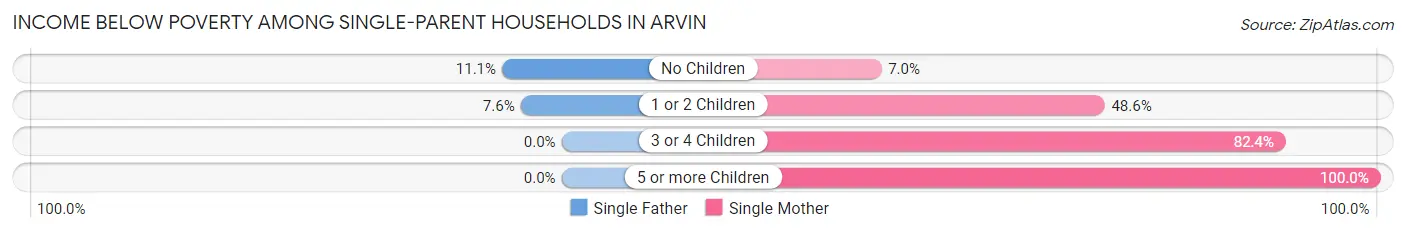
| Children | Single Father | Single Mother |
| No Children | 12 (11.1%) | 16 (7.0%) |
| 1 or 2 Children | 18 (7.6%) | 239 (48.6%) |
| 3 or 4 Children | 0 (0.0%) | 196 (82.4%) |
| 5 or more Children | 0 (0.0%) | 52 (100.0%) |
| Total | 30 (8.2%) | 503 (49.7%) |
Income Below Poverty Among Married-Couple vs Single-Parent Households in Arvin
The poverty data for Arvin shows that 503 of the married-couple family households (18.5%) and 533 of the single-parent households (38.7%) are living below the poverty level. Within the married-couple family households, those with 5 or more children have the highest poverty rate, with 23 households (45.1%) falling below the poverty line. Among the single-parent households, those with 3 or 4 children have the highest poverty rate, with 196 household (80.0%) living below poverty.
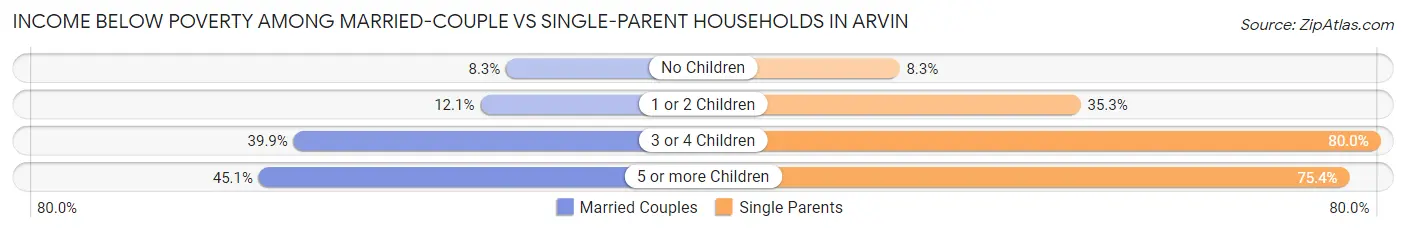
| Children | Married-Couple Families | Single-Parent Households |
| No Children | 74 (8.3%) | 28 (8.3%) |
| 1 or 2 Children | 131 (12.1%) | 257 (35.3%) |
| 3 or 4 Children | 275 (39.9%) | 196 (80.0%) |
| 5 or more Children | 23 (45.1%) | 52 (75.4%) |
| Total | 503 (18.5%) | 533 (38.7%) |
Race in Arvin
The most populous races in Arvin are Hispanic or Latino (18,592 | 94.8%), White / Caucasian (9,684 | 49.4%), and Some other Race (5,325 | 27.2%).
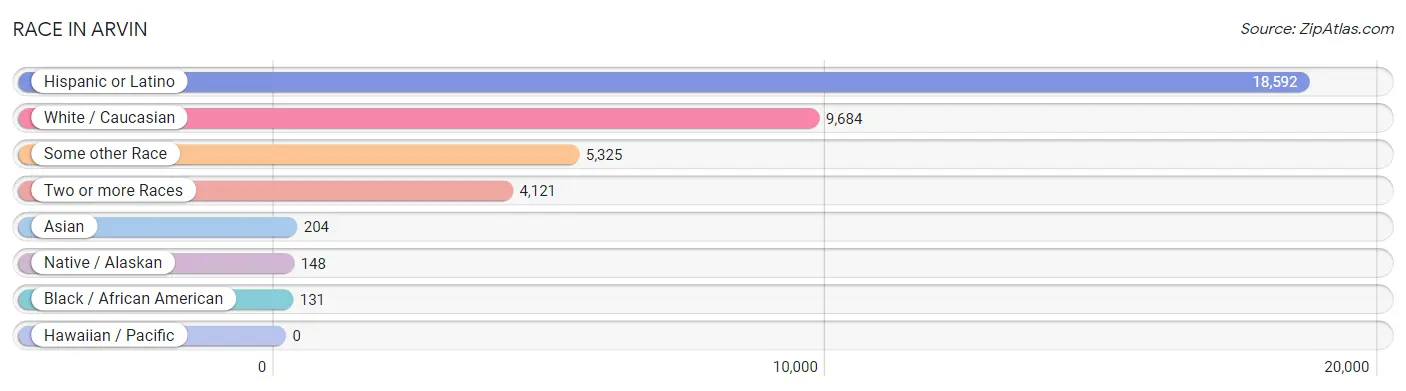
| Race | # Population | % Population |
| Asian | 204 | 1.0% |
| Black / African American | 131 | 0.7% |
| Hawaiian / Pacific | 0 | 0.0% |
| Hispanic or Latino | 18,592 | 94.8% |
| Native / Alaskan | 148 | 0.7% |
| White / Caucasian | 9,684 | 49.4% |
| Two or more Races | 4,121 | 21.0% |
| Some other Race | 5,325 | 27.2% |
| Total | 19,613 | 100.0% |
Ancestry in Arvin
The most populous ancestries reported in Arvin are Mexican (18,199 | 92.8%), American (391 | 2.0%), Central American (192 | 1.0%), Korean (132 | 0.7%), and Puerto Rican (126 | 0.6%), together accounting for 97.1% of all Arvin residents.
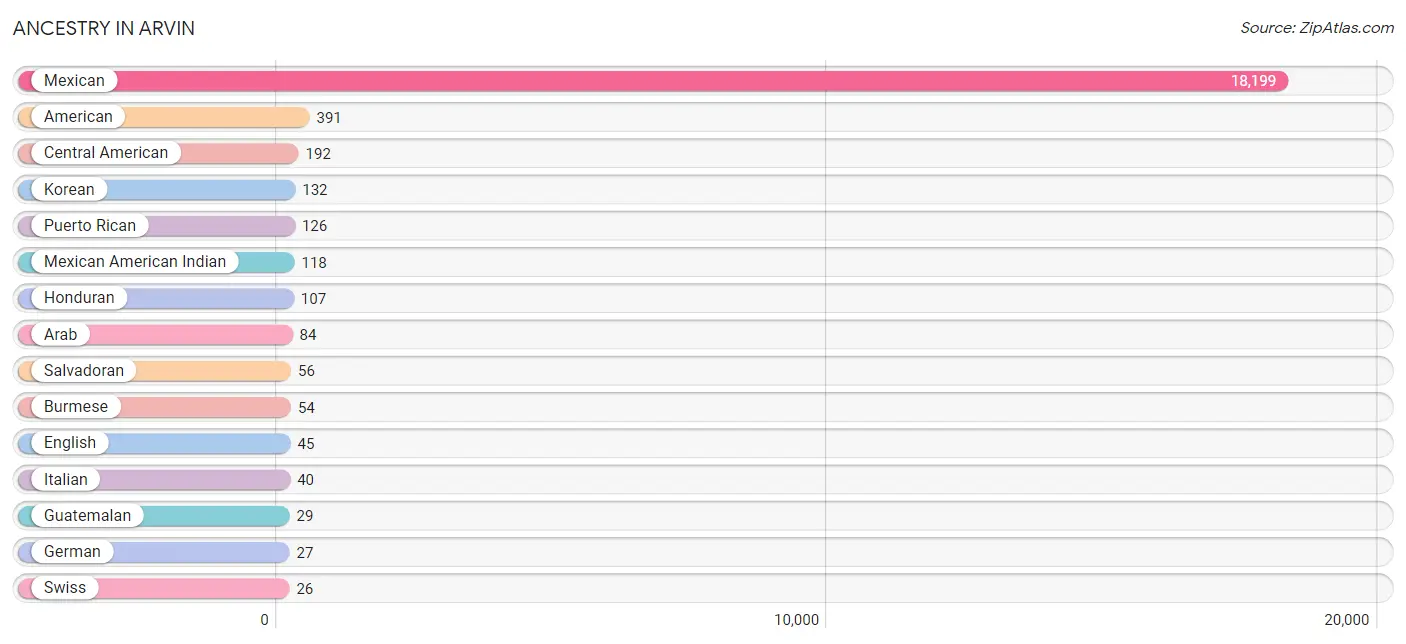
| Ancestry | # Population | % Population |
| American | 391 | 2.0% |
| Arab | 84 | 0.4% |
| Burmese | 54 | 0.3% |
| Central American | 192 | 1.0% |
| Cherokee | 7 | 0.0% |
| Czechoslovakian | 14 | 0.1% |
| English | 45 | 0.2% |
| European | 22 | 0.1% |
| German | 27 | 0.1% |
| Guatemalan | 29 | 0.2% |
| Honduran | 107 | 0.5% |
| Irish | 22 | 0.1% |
| Italian | 40 | 0.2% |
| Korean | 132 | 0.7% |
| Mexican | 18,199 | 92.8% |
| Mexican American Indian | 118 | 0.6% |
| Navajo | 2 | 0.0% |
| Northern European | 18 | 0.1% |
| Puerto Rican | 126 | 0.6% |
| Salvadoran | 56 | 0.3% |
| Scotch-Irish | 13 | 0.1% |
| Scottish | 13 | 0.1% |
| Spanish American | 5 | 0.0% |
| Swedish | 8 | 0.0% |
| Swiss | 26 | 0.1% |
| Thai | 18 | 0.1% |
| Yaqui | 17 | 0.1% | View All 27 Rows |
Immigrants in Arvin
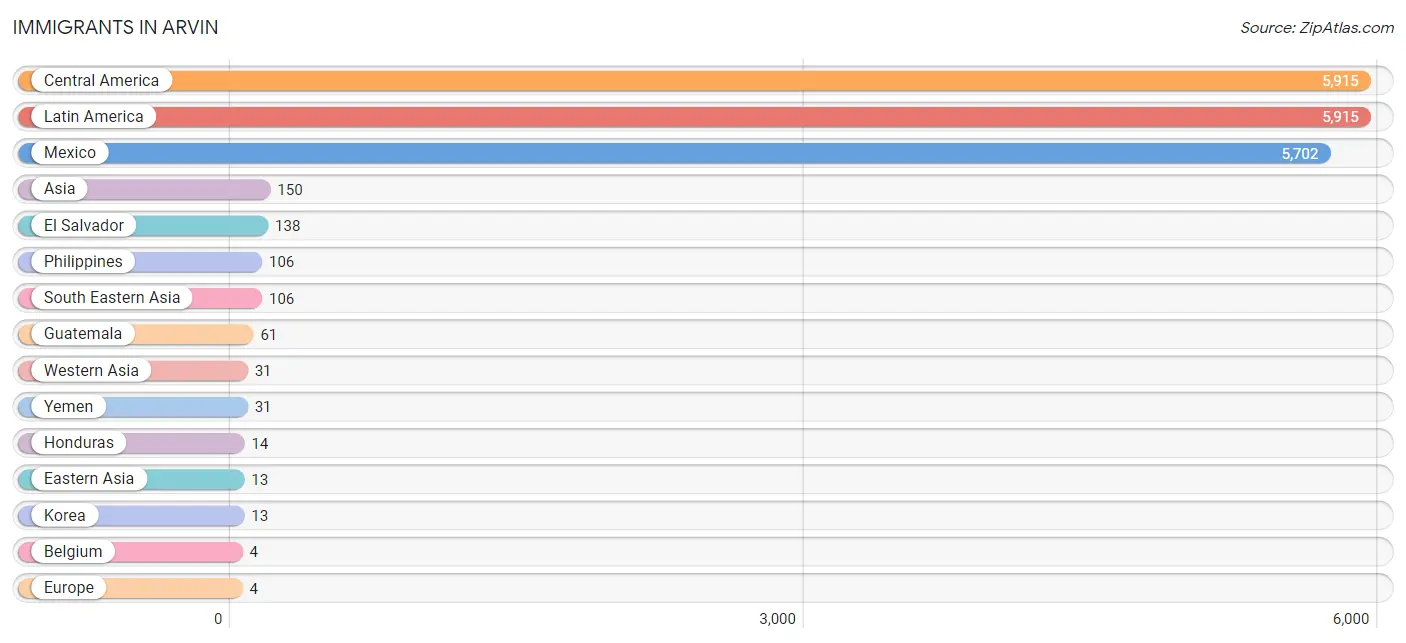
The most numerous immigrant groups reported in Arvin came from Central America (5,915 | 30.2%), Latin America (5,915 | 30.2%), Mexico (5,702 | 29.1%), Asia (150 | 0.8%), and El Salvador (138 | 0.7%), together accounting for 90.8% of all Arvin residents.
| Immigration Origin | # Population | % Population |
| Asia | 150 | 0.8% |
| Belgium | 4 | 0.0% |
| Central America | 5,915 | 30.2% |
| Eastern Asia | 13 | 0.1% |
| El Salvador | 138 | 0.7% |
| Europe | 4 | 0.0% |
| Guatemala | 61 | 0.3% |
| Honduras | 14 | 0.1% |
| Korea | 13 | 0.1% |
| Latin America | 5,915 | 30.2% |
| Mexico | 5,702 | 29.1% |
| Philippines | 106 | 0.5% |
| South Eastern Asia | 106 | 0.5% |
| Western Asia | 31 | 0.2% |
| Western Europe | 4 | 0.0% |
| Yemen | 31 | 0.2% | View All 16 Rows |
Sex and Age in Arvin
Sex and Age in Arvin
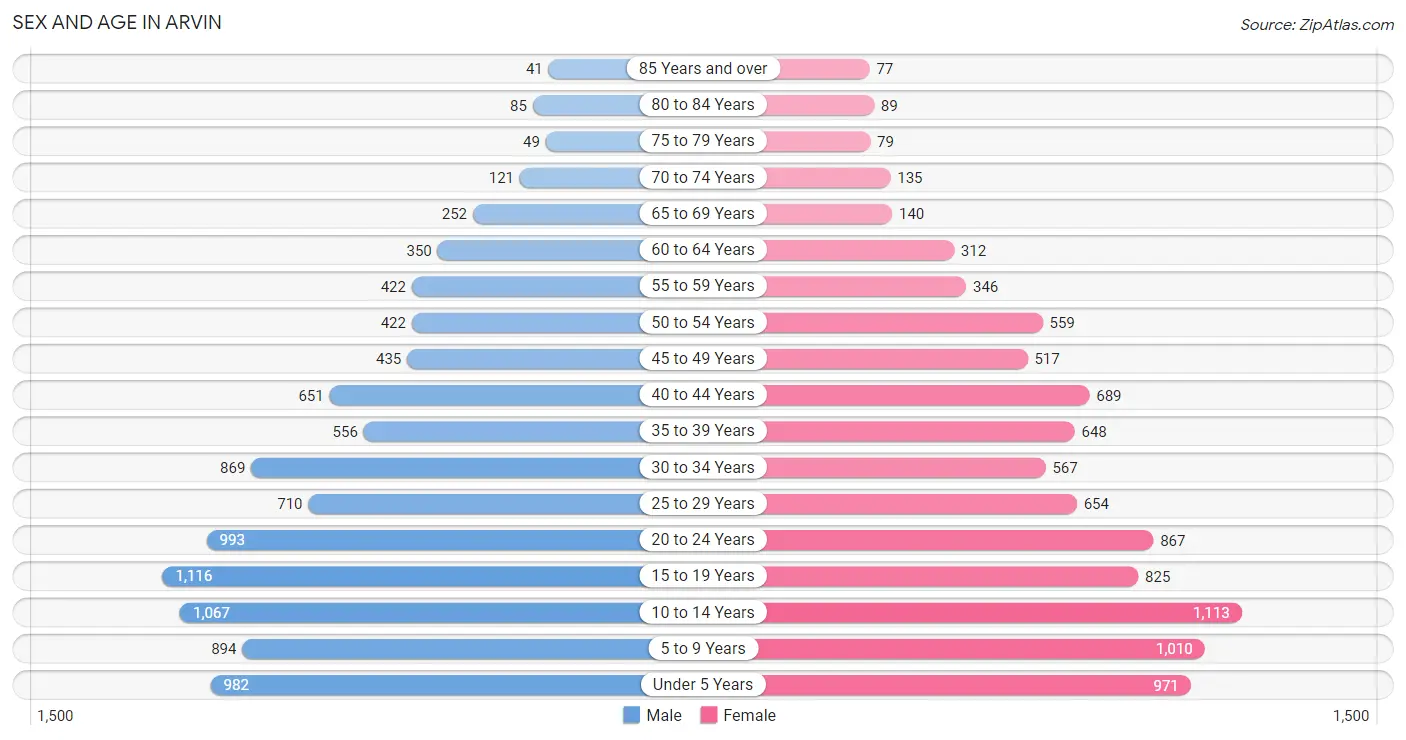
The most populous age groups in Arvin are 15 to 19 Years (1,116 | 11.1%) for men and 10 to 14 Years (1,113 | 11.6%) for women.
| Age Bracket | Male | Female |
| Under 5 Years | 982 (9.8%) | 971 (10.1%) |
| 5 to 9 Years | 894 (8.9%) | 1,010 (10.5%) |
| 10 to 14 Years | 1,067 (10.6%) | 1,113 (11.6%) |
| 15 to 19 Years | 1,116 (11.1%) | 825 (8.6%) |
| 20 to 24 Years | 993 (9.9%) | 867 (9.0%) |
| 25 to 29 Years | 710 (7.1%) | 654 (6.8%) |
| 30 to 34 Years | 869 (8.7%) | 567 (5.9%) |
| 35 to 39 Years | 556 (5.6%) | 648 (6.8%) |
| 40 to 44 Years | 651 (6.5%) | 689 (7.2%) |
| 45 to 49 Years | 435 (4.3%) | 517 (5.4%) |
| 50 to 54 Years | 422 (4.2%) | 559 (5.8%) |
| 55 to 59 Years | 422 (4.2%) | 346 (3.6%) |
| 60 to 64 Years | 350 (3.5%) | 312 (3.3%) |
| 65 to 69 Years | 252 (2.5%) | 140 (1.5%) |
| 70 to 74 Years | 121 (1.2%) | 135 (1.4%) |
| 75 to 79 Years | 49 (0.5%) | 79 (0.8%) |
| 80 to 84 Years | 85 (0.9%) | 89 (0.9%) |
| 85 Years and over | 41 (0.4%) | 77 (0.8%) |
| Total | 10,015 (100.0%) | 9,598 (100.0%) |
Families and Households in Arvin
Median Family Size in Arvin
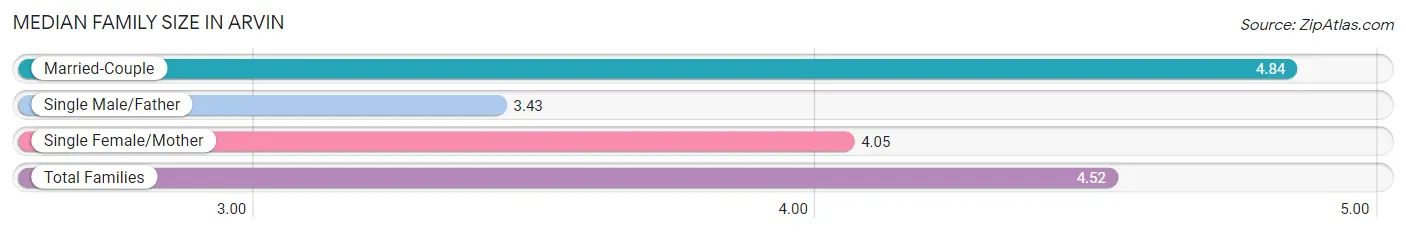
The median family size in Arvin is 4.52 persons per family, with married-couple families (2,719 | 66.3%) accounting for the largest median family size of 4.84 persons per family. On the other hand, single male/father families (368 | 9.0%) represent the smallest median family size with 3.43 persons per family.
| Family Type | # Families | Family Size |
| Married-Couple | 2,719 (66.3%) | 4.84 |
| Single Male/Father | 368 (9.0%) | 3.43 |
| Single Female/Mother | 1,011 (24.7%) | 4.05 |
| Total Families | 4,098 (100.0%) | 4.52 |
Median Household Size in Arvin
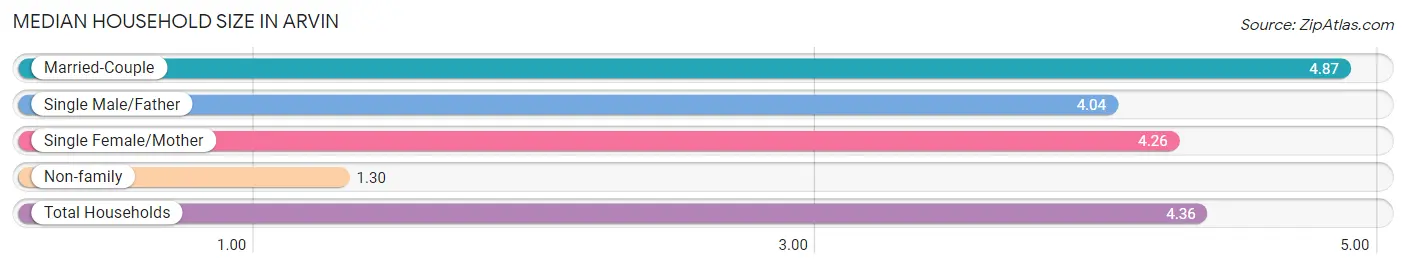
The median household size in Arvin is 4.36 persons per household, with married-couple households (2,719 | 60.8%) accounting for the largest median household size of 4.87 persons per household. non-family households (377 | 8.4%) represent the smallest median household size with 1.30 persons per household.
| Household Type | # Households | Household Size |
| Married-Couple | 2,719 (60.8%) | 4.87 |
| Single Male/Father | 368 (8.2%) | 4.04 |
| Single Female/Mother | 1,011 (22.6%) | 4.26 |
| Non-family | 377 (8.4%) | 1.30 |
| Total Households | 4,475 (100.0%) | 4.36 |
Household Size by Marriage Status in Arvin
Out of a total of 4,475 households in Arvin, 4,098 (91.6%) are family households, while 377 (8.4%) are nonfamily households. The most numerous type of family households are 3-person households, comprising 1,049, and the most common type of nonfamily households are 1-person households, comprising 290.
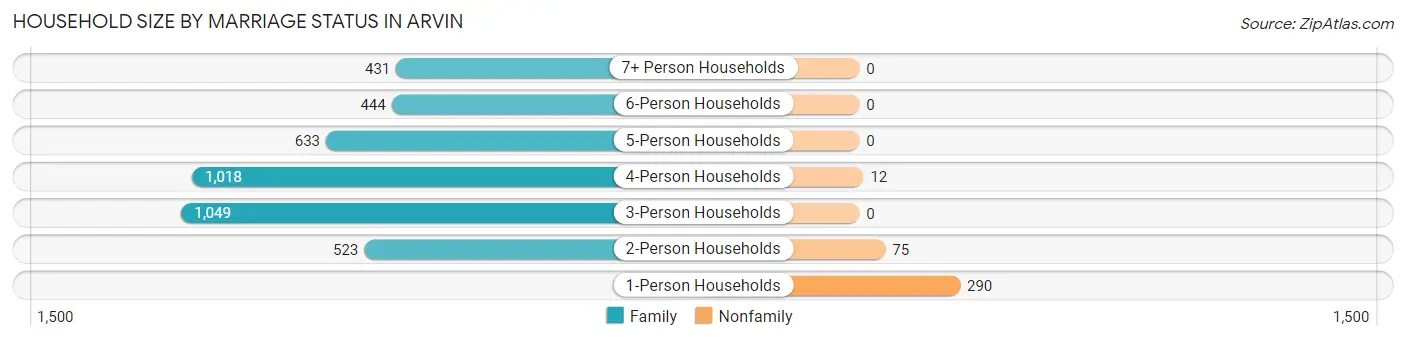
| Household Size | Family Households | Nonfamily Households |
| 1-Person Households | - | 290 (6.5%) |
| 2-Person Households | 523 (11.7%) | 75 (1.7%) |
| 3-Person Households | 1,049 (23.4%) | 0 (0.0%) |
| 4-Person Households | 1,018 (22.8%) | 12 (0.3%) |
| 5-Person Households | 633 (14.1%) | 0 (0.0%) |
| 6-Person Households | 444 (9.9%) | 0 (0.0%) |
| 7+ Person Households | 431 (9.6%) | 0 (0.0%) |
| Total | 4,098 (91.6%) | 377 (8.4%) |
Female Fertility in Arvin
Fertility by Age in Arvin
Average fertility rate in Arvin is 76.0 births per 1,000 women. Women in the age bracket of 20 to 34 years have the highest fertility rate with 159.0 births per 1,000 women. Women in the age bracket of 20 to 34 years acount for 90.0% of all women with births.
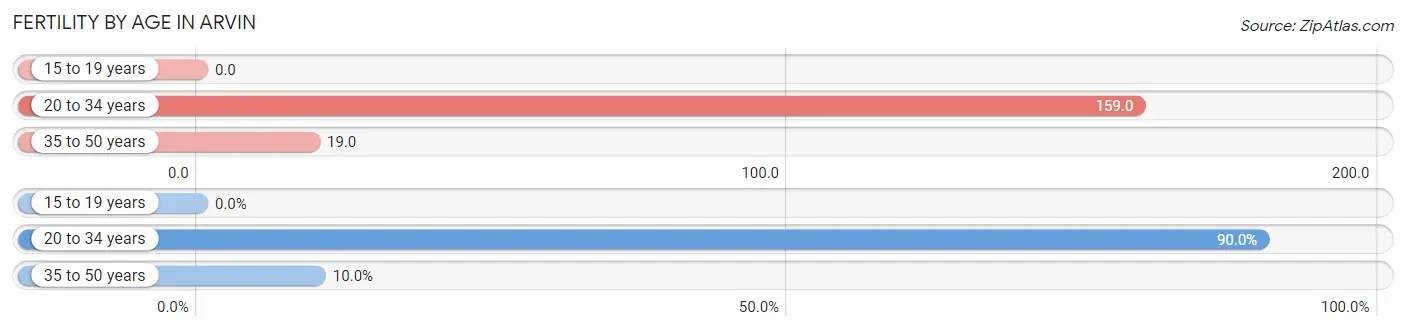
| Age Bracket | Women with Births | Births / 1,000 Women |
| 15 to 19 years | 0 (0.0%) | 0.0 |
| 20 to 34 years | 333 (90.0%) | 159.0 |
| 35 to 50 years | 37 (10.0%) | 19.0 |
| Total | 370 (100.0%) | 76.0 |
Fertility by Age by Marriage Status in Arvin
60.8% of women with births (370) in Arvin are married. The highest percentage of unmarried women with births falls into 20 to 34 years age bracket with 43.5% of them unmarried at the time of birth, while the lowest percentage of unmarried women with births belong to 35 to 50 years age bracket with 0.0% of them unmarried.
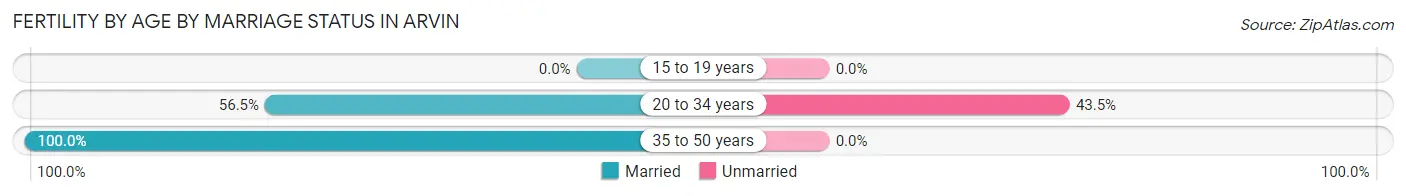
| Age Bracket | Married | Unmarried |
| 15 to 19 years | 0 (0.0%) | 0 (0.0%) |
| 20 to 34 years | 188 (56.5%) | 145 (43.5%) |
| 35 to 50 years | 37 (100.0%) | 0 (0.0%) |
| Total | 225 (60.8%) | 145 (39.2%) |
Fertility by Education in Arvin
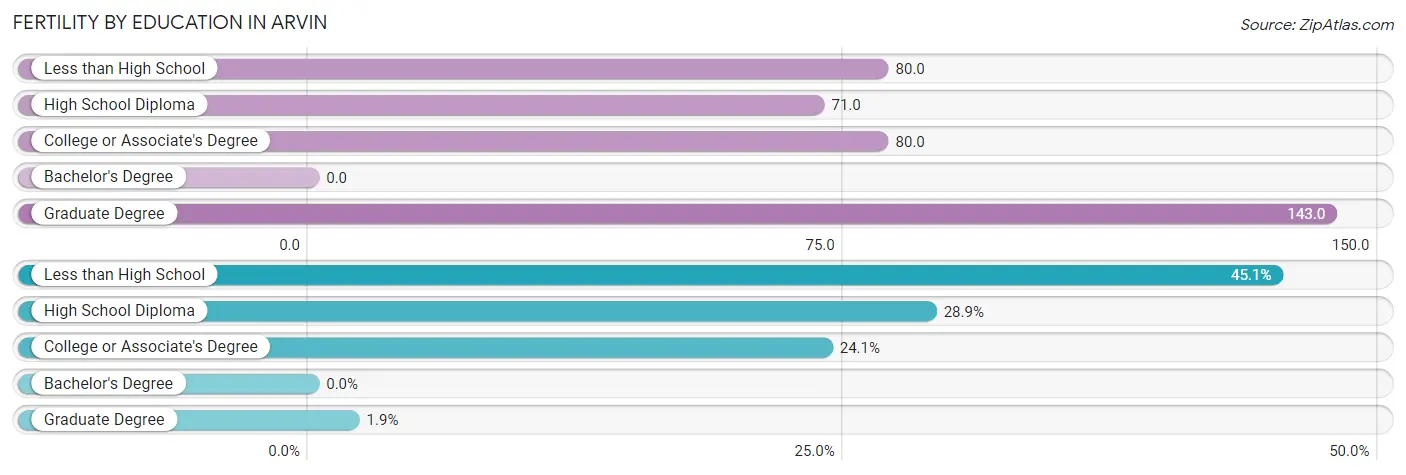
| Educational Attainment | Women with Births | Births / 1,000 Women |
| Less than High School | 167 (45.1%) | 80.0 |
| High School Diploma | 107 (28.9%) | 71.0 |
| College or Associate's Degree | 89 (24.0%) | 80.0 |
| Bachelor's Degree | 0 (0.0%) | 0.0 |
| Graduate Degree | 7 (1.9%) | 143.0 |
| Total | 370 (100.0%) | 76.0 |
Fertility by Education by Marriage Status in Arvin
39.2% of women with births in Arvin are unmarried. Women with the educational attainment of graduate degree are most likely to be married with 100.0% of them married at childbirth, while women with the educational attainment of less than high school are least likely to be married with 47.9% of them unmarried at childbirth.
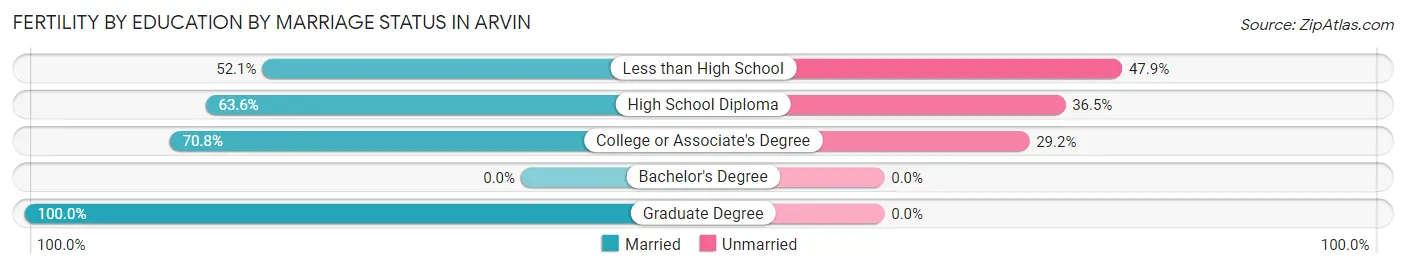
| Educational Attainment | Married | Unmarried |
| Less than High School | 87 (52.1%) | 80 (47.9%) |
| High School Diploma | 68 (63.5%) | 39 (36.4%) |
| College or Associate's Degree | 63 (70.8%) | 26 (29.2%) |
| Bachelor's Degree | 0 (0.0%) | 0 (0.0%) |
| Graduate Degree | 7 (100.0%) | 0 (0.0%) |
| Total | 225 (60.8%) | 145 (39.2%) |
Employment Characteristics in Arvin
Employment by Class of Employer in Arvin
Among the 7,084 employed individuals in Arvin, private company employees (6,000 | 84.7%), local government employees (386 | 5.4%), and self-employed (not incorporated) (265 | 3.7%) make up the most common classes of employment.
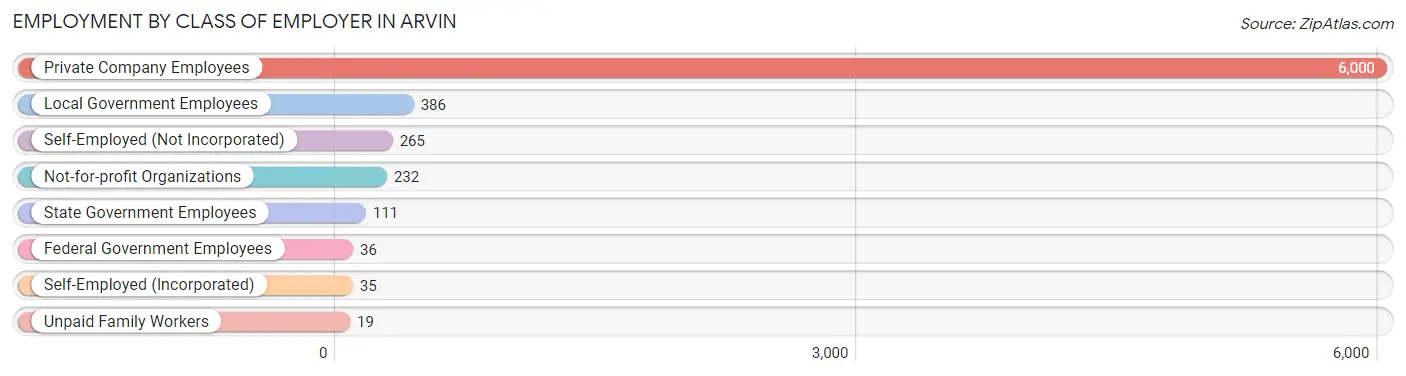
| Employer Class | # Employees | % Employees |
| Private Company Employees | 6,000 | 84.7% |
| Self-Employed (Incorporated) | 35 | 0.5% |
| Self-Employed (Not Incorporated) | 265 | 3.7% |
| Not-for-profit Organizations | 232 | 3.3% |
| Local Government Employees | 386 | 5.4% |
| State Government Employees | 111 | 1.6% |
| Federal Government Employees | 36 | 0.5% |
| Unpaid Family Workers | 19 | 0.3% |
| Total | 7,084 | 100.0% |
Employment Status by Age in Arvin
According to the labor force statistics for Arvin, out of the total population over 16 years of age (13,245), 61.7% or 8,172 individuals are in the labor force, with 11.1% or 907 of them unemployed. The age group with the highest labor force participation rate is 30 to 34 years, with 82.4% or 1,183 individuals in the labor force. Within the labor force, the 65 to 74 years age range has the highest percentage of unemployed individuals, with 31.0% or 57 of them being unemployed.
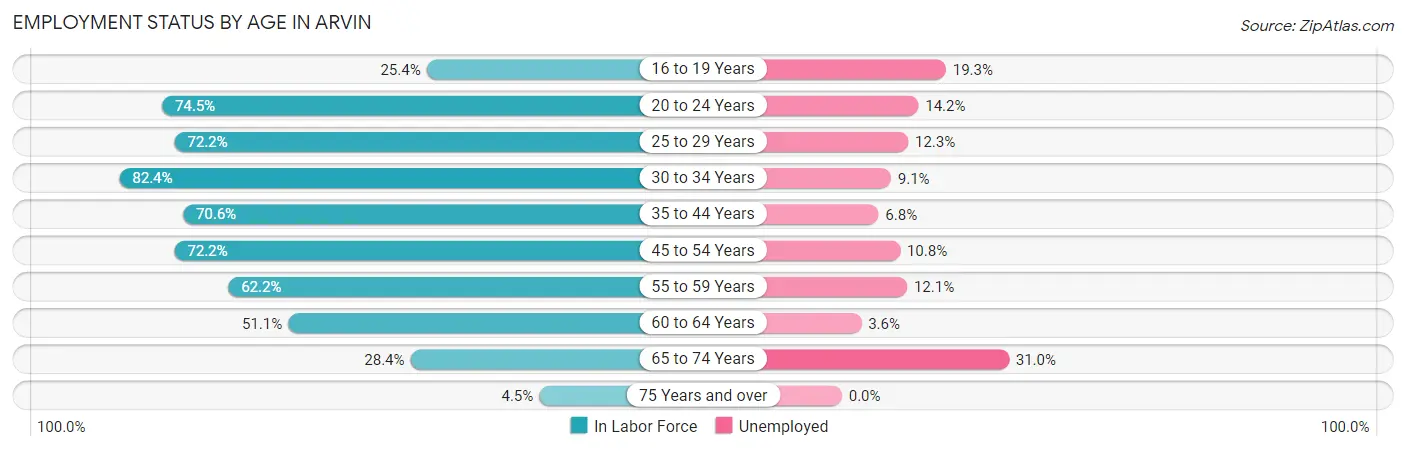
| Age Bracket | In Labor Force | Unemployed |
| 16 to 19 Years | 409 (25.4%) | 79 (19.3%) |
| 20 to 24 Years | 1,386 (74.5%) | 197 (14.2%) |
| 25 to 29 Years | 985 (72.2%) | 121 (12.3%) |
| 30 to 34 Years | 1,183 (82.4%) | 108 (9.1%) |
| 35 to 44 Years | 1,796 (70.6%) | 122 (6.8%) |
| 45 to 54 Years | 1,396 (72.2%) | 151 (10.8%) |
| 55 to 59 Years | 478 (62.2%) | 58 (12.1%) |
| 60 to 64 Years | 338 (51.1%) | 12 (3.6%) |
| 65 to 74 Years | 184 (28.4%) | 57 (31.0%) |
| 75 Years and over | 19 (4.5%) | 0 (0.0%) |
| Total | 8,172 (61.7%) | 907 (11.1%) |
Employment Status by Educational Attainment in Arvin
According to labor force statistics for Arvin, 70.9% of individuals (6,173) out of the total population between 25 and 64 years of age (8,707) are in the labor force, with 9.3% or 574 of them being unemployed. The group with the highest labor force participation rate are those with the educational attainment of bachelor's degree or higher, with 73.4% or 262 individuals in the labor force. Within the labor force, individuals with college / associate degree education have the highest percentage of unemployment, with 12.2% or 131 of them being unemployed.
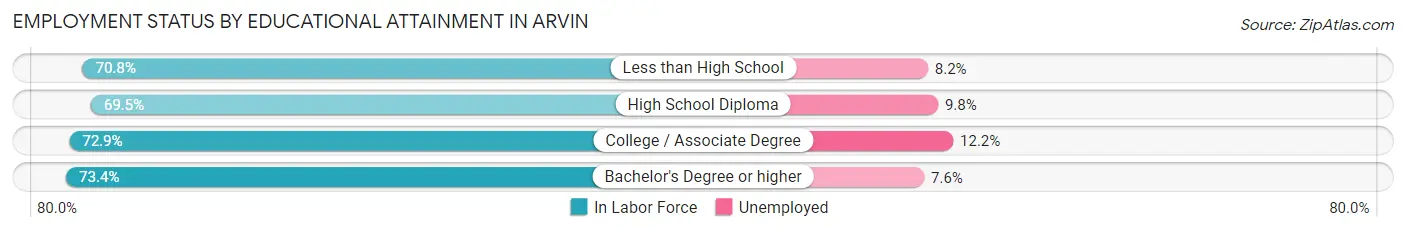
| Educational Attainment | In Labor Force | Unemployed |
| Less than High School | 3,211 (70.8%) | 372 (8.2%) |
| High School Diploma | 1,626 (69.5%) | 229 (9.8%) |
| College / Associate Degree | 1,075 (72.9%) | 180 (12.2%) |
| Bachelor's Degree or higher | 262 (73.4%) | 27 (7.6%) |
| Total | 6,173 (70.9%) | 810 (9.3%) |
Employment Occupations by Sex in Arvin
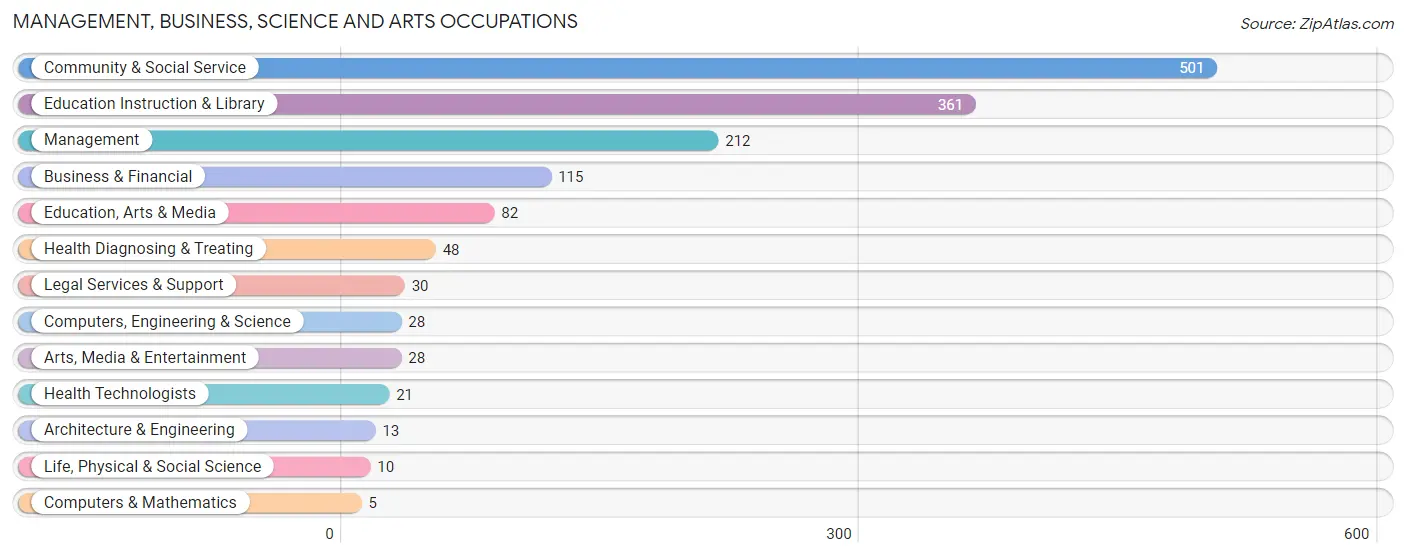
Management, Business, Science and Arts Occupations
The most common Management, Business, Science and Arts occupations in Arvin are Community & Social Service (501 | 6.9%), Education Instruction & Library (361 | 5.0%), Management (212 | 2.9%), Business & Financial (115 | 1.6%), and Education, Arts & Media (82 | 1.1%).
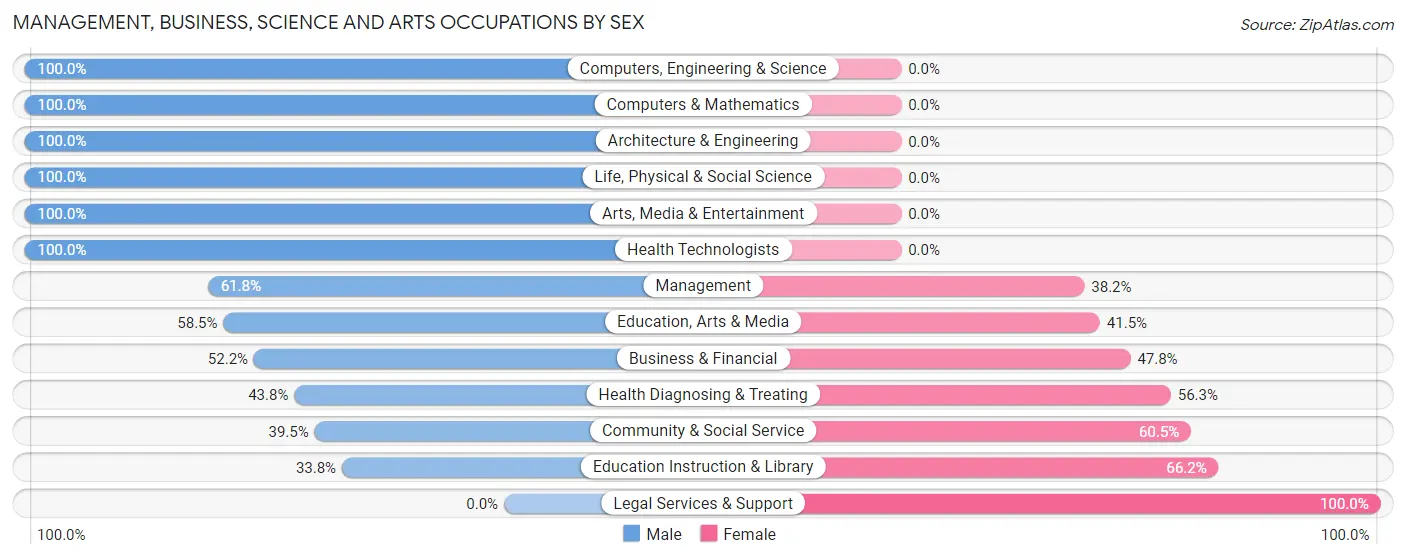
Management, Business, Science and Arts Occupations by Sex
Within the Management, Business, Science and Arts occupations in Arvin, the most male-oriented occupations are Computers, Engineering & Science (100.0%), Computers & Mathematics (100.0%), and Architecture & Engineering (100.0%), while the most female-oriented occupations are Legal Services & Support (100.0%), Education Instruction & Library (66.2%), and Community & Social Service (60.5%).
| Occupation | Male | Female |
| Management | 131 (61.8%) | 81 (38.2%) |
| Business & Financial | 60 (52.2%) | 55 (47.8%) |
| Computers, Engineering & Science | 28 (100.0%) | 0 (0.0%) |
| Computers & Mathematics | 5 (100.0%) | 0 (0.0%) |
| Architecture & Engineering | 13 (100.0%) | 0 (0.0%) |
| Life, Physical & Social Science | 10 (100.0%) | 0 (0.0%) |
| Community & Social Service | 198 (39.5%) | 303 (60.5%) |
| Education, Arts & Media | 48 (58.5%) | 34 (41.5%) |
| Legal Services & Support | 0 (0.0%) | 30 (100.0%) |
| Education Instruction & Library | 122 (33.8%) | 239 (66.2%) |
| Arts, Media & Entertainment | 28 (100.0%) | 0 (0.0%) |
| Health Diagnosing & Treating | 21 (43.8%) | 27 (56.2%) |
| Health Technologists | 21 (100.0%) | 0 (0.0%) |
| Total (Category) | 438 (48.4%) | 466 (51.5%) |
| Total (Overall) | 4,535 (62.5%) | 2,722 (37.5%) |
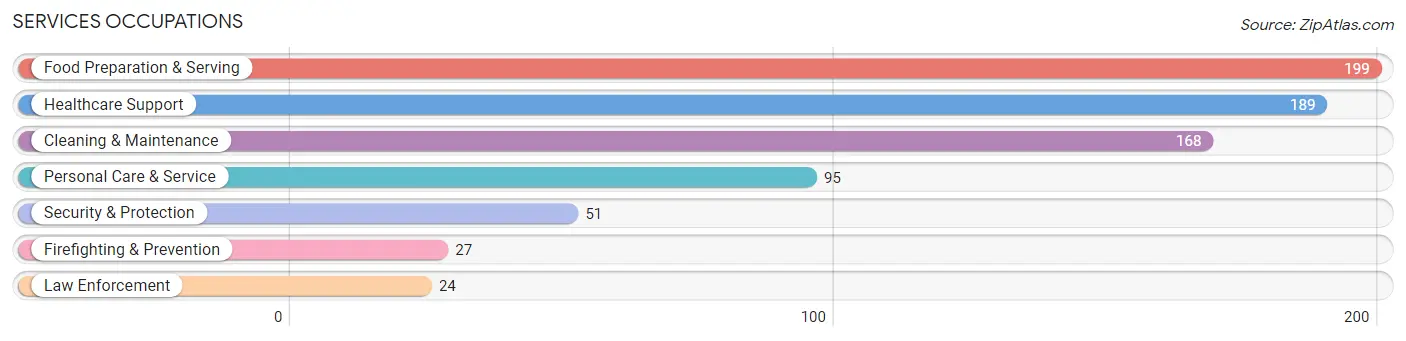
Services Occupations
The most common Services occupations in Arvin are Food Preparation & Serving (199 | 2.7%), Healthcare Support (189 | 2.6%), Cleaning & Maintenance (168 | 2.3%), Personal Care & Service (95 | 1.3%), and Security & Protection (51 | 0.7%).
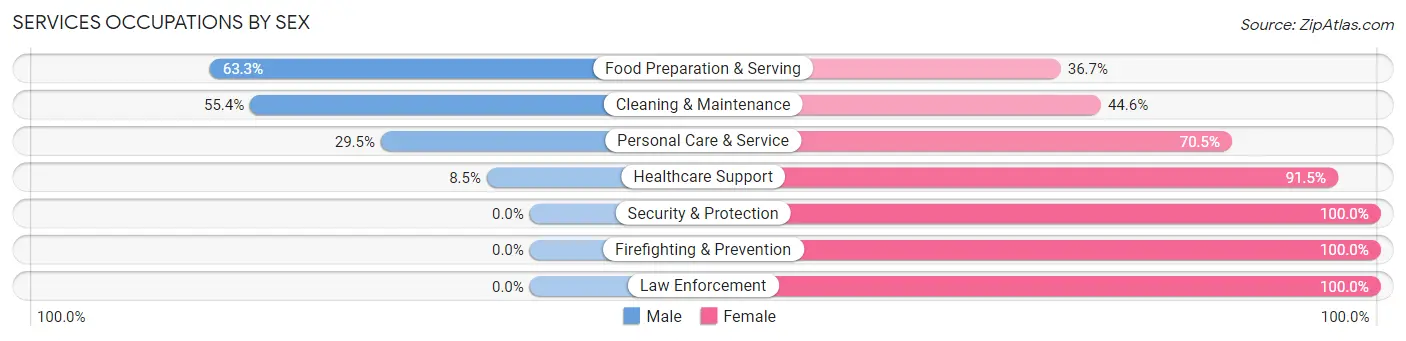
Services Occupations by Sex
Within the Services occupations in Arvin, the most male-oriented occupations are Food Preparation & Serving (63.3%), Cleaning & Maintenance (55.4%), and Personal Care & Service (29.5%), while the most female-oriented occupations are Security & Protection (100.0%), Firefighting & Prevention (100.0%), and Law Enforcement (100.0%).
| Occupation | Male | Female |
| Healthcare Support | 16 (8.5%) | 173 (91.5%) |
| Security & Protection | 0 (0.0%) | 51 (100.0%) |
| Firefighting & Prevention | 0 (0.0%) | 27 (100.0%) |
| Law Enforcement | 0 (0.0%) | 24 (100.0%) |
| Food Preparation & Serving | 126 (63.3%) | 73 (36.7%) |
| Cleaning & Maintenance | 93 (55.4%) | 75 (44.6%) |
| Personal Care & Service | 28 (29.5%) | 67 (70.5%) |
| Total (Category) | 263 (37.5%) | 439 (62.5%) |
| Total (Overall) | 4,535 (62.5%) | 2,722 (37.5%) |
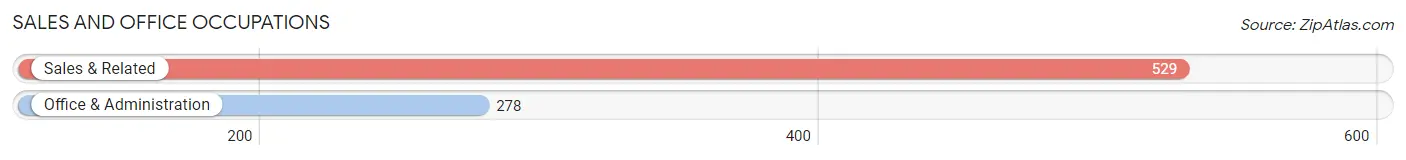
Sales and Office Occupations
The most common Sales and Office occupations in Arvin are Sales & Related (529 | 7.3%), and Office & Administration (278 | 3.8%).
Sales and Office Occupations by Sex
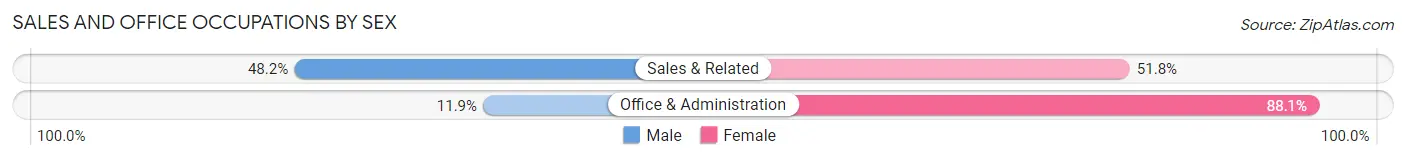
| Occupation | Male | Female |
| Sales & Related | 255 (48.2%) | 274 (51.8%) |
| Office & Administration | 33 (11.9%) | 245 (88.1%) |
| Total (Category) | 288 (35.7%) | 519 (64.3%) |
| Total (Overall) | 4,535 (62.5%) | 2,722 (37.5%) |
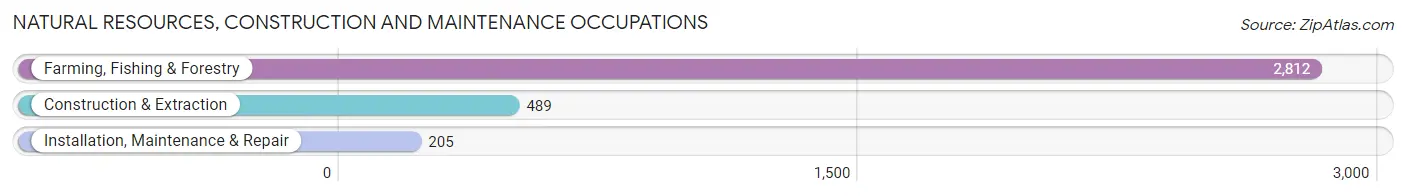
Natural Resources, Construction and Maintenance Occupations
The most common Natural Resources, Construction and Maintenance occupations in Arvin are Farming, Fishing & Forestry (2,812 | 38.8%), Construction & Extraction (489 | 6.7%), and Installation, Maintenance & Repair (205 | 2.8%).
Natural Resources, Construction and Maintenance Occupations by Sex
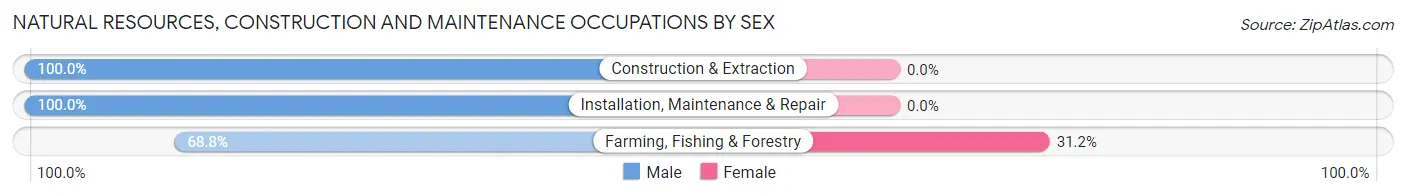
| Occupation | Male | Female |
| Farming, Fishing & Forestry | 1,935 (68.8%) | 877 (31.2%) |
| Construction & Extraction | 489 (100.0%) | 0 (0.0%) |
| Installation, Maintenance & Repair | 205 (100.0%) | 0 (0.0%) |
| Total (Category) | 2,629 (75.0%) | 877 (25.0%) |
| Total (Overall) | 4,535 (62.5%) | 2,722 (37.5%) |
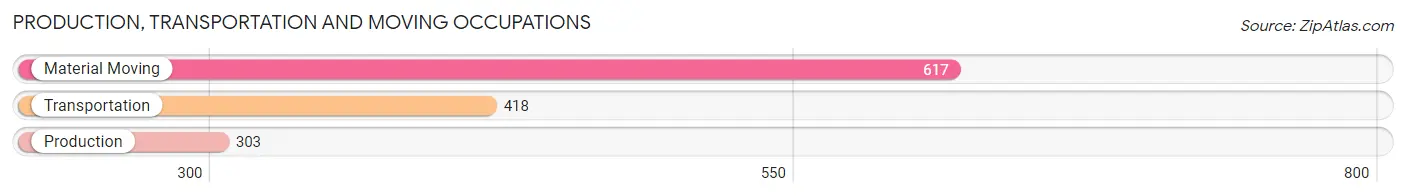
Production, Transportation and Moving Occupations
The most common Production, Transportation and Moving occupations in Arvin are Material Moving (617 | 8.5%), Transportation (418 | 5.8%), and Production (303 | 4.2%).
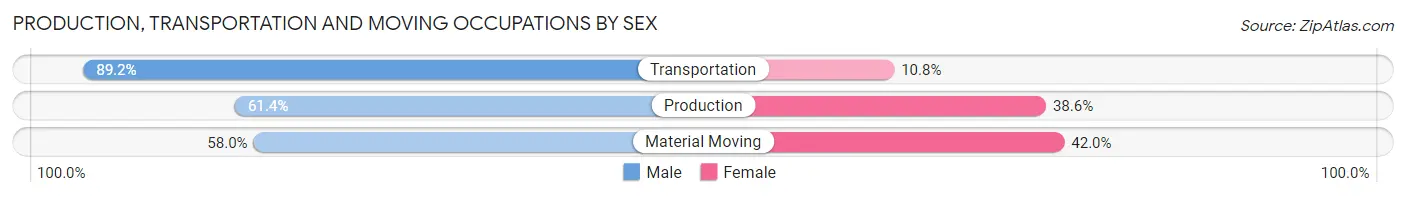
Production, Transportation and Moving Occupations by Sex
| Occupation | Male | Female |
| Production | 186 (61.4%) | 117 (38.6%) |
| Transportation | 373 (89.2%) | 45 (10.8%) |
| Material Moving | 358 (58.0%) | 259 (42.0%) |
| Total (Category) | 917 (68.5%) | 421 (31.5%) |
| Total (Overall) | 4,535 (62.5%) | 2,722 (37.5%) |
Employment Industries by Sex in Arvin
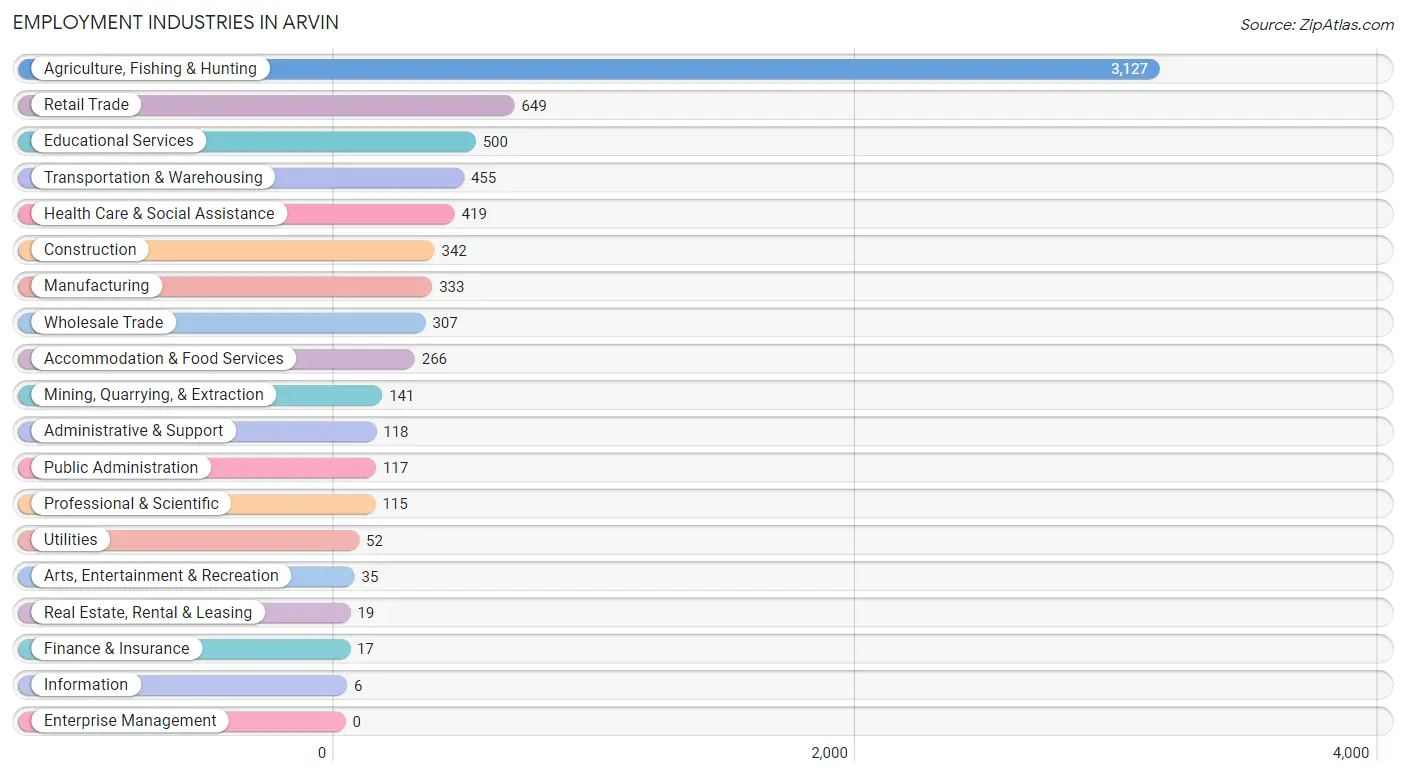
Employment Industries in Arvin
The major employment industries in Arvin include Agriculture, Fishing & Hunting (3,127 | 43.1%), Retail Trade (649 | 8.9%), Educational Services (500 | 6.9%), Transportation & Warehousing (455 | 6.3%), and Health Care & Social Assistance (419 | 5.8%).
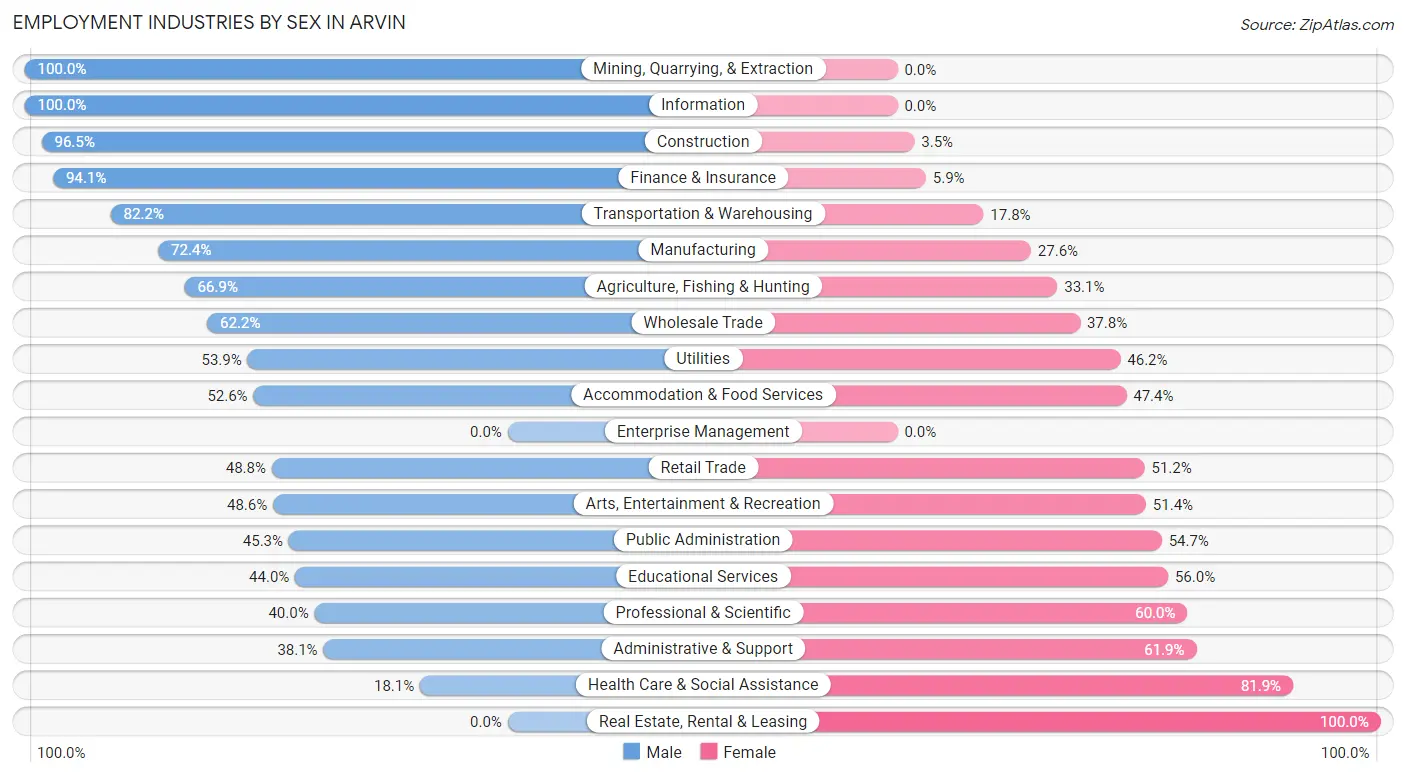
Employment Industries by Sex in Arvin
The Arvin industries that see more men than women are Mining, Quarrying, & Extraction (100.0%), Information (100.0%), and Construction (96.5%), whereas the industries that tend to have a higher number of women are Real Estate, Rental & Leasing (100.0%), Health Care & Social Assistance (81.9%), and Administrative & Support (61.9%).
| Industry | Male | Female |
| Agriculture, Fishing & Hunting | 2,092 (66.9%) | 1,035 (33.1%) |
| Mining, Quarrying, & Extraction | 141 (100.0%) | 0 (0.0%) |
| Construction | 330 (96.5%) | 12 (3.5%) |
| Manufacturing | 241 (72.4%) | 92 (27.6%) |
| Wholesale Trade | 191 (62.2%) | 116 (37.8%) |
| Retail Trade | 317 (48.8%) | 332 (51.2%) |
| Transportation & Warehousing | 374 (82.2%) | 81 (17.8%) |
| Utilities | 28 (53.8%) | 24 (46.2%) |
| Information | 6 (100.0%) | 0 (0.0%) |
| Finance & Insurance | 16 (94.1%) | 1 (5.9%) |
| Real Estate, Rental & Leasing | 0 (0.0%) | 19 (100.0%) |
| Professional & Scientific | 46 (40.0%) | 69 (60.0%) |
| Enterprise Management | 0 (0.0%) | 0 (0.0%) |
| Administrative & Support | 45 (38.1%) | 73 (61.9%) |
| Educational Services | 220 (44.0%) | 280 (56.0%) |
| Health Care & Social Assistance | 76 (18.1%) | 343 (81.9%) |
| Arts, Entertainment & Recreation | 17 (48.6%) | 18 (51.4%) |
| Accommodation & Food Services | 140 (52.6%) | 126 (47.4%) |
| Public Administration | 53 (45.3%) | 64 (54.7%) |
| Total | 4,535 (62.5%) | 2,722 (37.5%) |
Education in Arvin
School Enrollment in Arvin
The most common levels of schooling among the 6,917 students in Arvin are elementary school (1,670 | 24.1%), middle school (1,637 | 23.7%), and high school (1,560 | 22.6%).
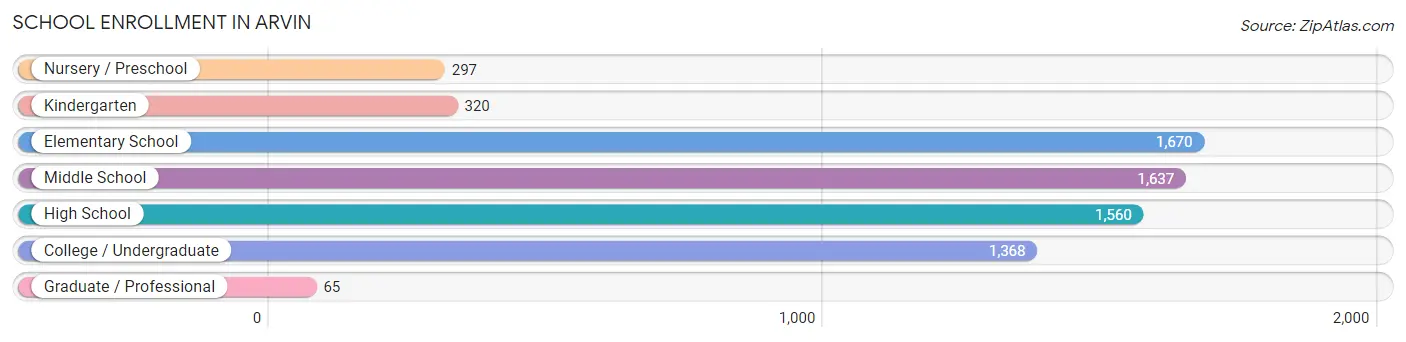
| School Level | # Students | % Students |
| Nursery / Preschool | 297 | 4.3% |
| Kindergarten | 320 | 4.6% |
| Elementary School | 1,670 | 24.1% |
| Middle School | 1,637 | 23.7% |
| High School | 1,560 | 22.6% |
| College / Undergraduate | 1,368 | 19.8% |
| Graduate / Professional | 65 | 0.9% |
| Total | 6,917 | 100.0% |
School Enrollment by Age by Funding Source in Arvin
Out of a total of 6,917 students who are enrolled in schools in Arvin, 221 (3.2%) attend a private institution, while the remaining 6,696 (96.8%) are enrolled in public schools. The age group of 20 to 24 year olds has the highest likelihood of being enrolled in private schools, with 114 (18.8% in the age bracket) enrolled. Conversely, the age group of 3 to 4 year olds has the lowest likelihood of being enrolled in a private school, with 214 (100.0% in the age bracket) attending a public institution.
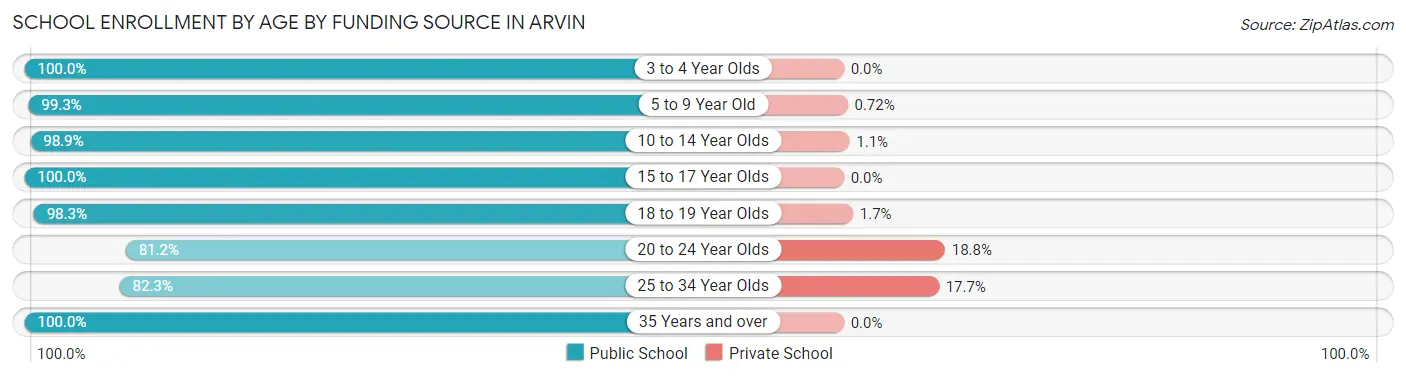
| Age Bracket | Public School | Private School |
| 3 to 4 Year Olds | 214 (100.0%) | 0 (0.0%) |
| 5 to 9 Year Old | 1,784 (99.3%) | 13 (0.7%) |
| 10 to 14 Year Olds | 2,142 (98.9%) | 23 (1.1%) |
| 15 to 17 Year Olds | 1,021 (100.0%) | 0 (0.0%) |
| 18 to 19 Year Olds | 574 (98.3%) | 10 (1.7%) |
| 20 to 24 Year Olds | 491 (81.2%) | 114 (18.8%) |
| 25 to 34 Year Olds | 279 (82.3%) | 60 (17.7%) |
| 35 Years and over | 192 (100.0%) | 0 (0.0%) |
| Total | 6,696 (96.8%) | 221 (3.2%) |
Educational Attainment by Field of Study in Arvin
Arts & humanities (85 | 21.5%), business (66 | 16.7%), liberal arts & history (55 | 13.9%), social sciences (44 | 11.1%), and bio, nature & agricultural (43 | 10.9%) are the most common fields of study among 396 individuals in Arvin who have obtained a bachelor's degree or higher.
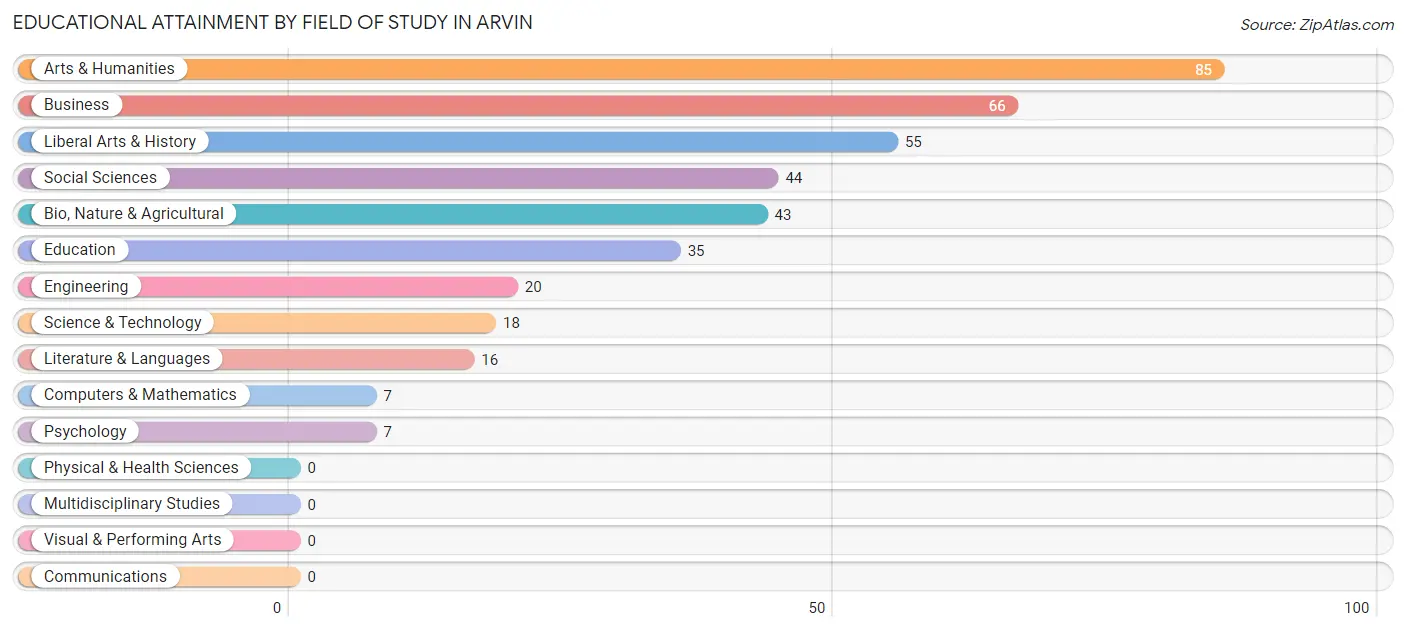
| Field of Study | # Graduates | % Graduates |
| Computers & Mathematics | 7 | 1.8% |
| Bio, Nature & Agricultural | 43 | 10.9% |
| Physical & Health Sciences | 0 | 0.0% |
| Psychology | 7 | 1.8% |
| Social Sciences | 44 | 11.1% |
| Engineering | 20 | 5.1% |
| Multidisciplinary Studies | 0 | 0.0% |
| Science & Technology | 18 | 4.5% |
| Business | 66 | 16.7% |
| Education | 35 | 8.8% |
| Literature & Languages | 16 | 4.0% |
| Liberal Arts & History | 55 | 13.9% |
| Visual & Performing Arts | 0 | 0.0% |
| Communications | 0 | 0.0% |
| Arts & Humanities | 85 | 21.5% |
| Total | 396 | 100.0% |
Transportation & Commute in Arvin
Vehicle Availability by Sex in Arvin
The most prevalent vehicle ownership categories in Arvin are males with 2 vehicles (1,651, accounting for 37.0%) and females with 2 vehicles (935, making up 63.0%).
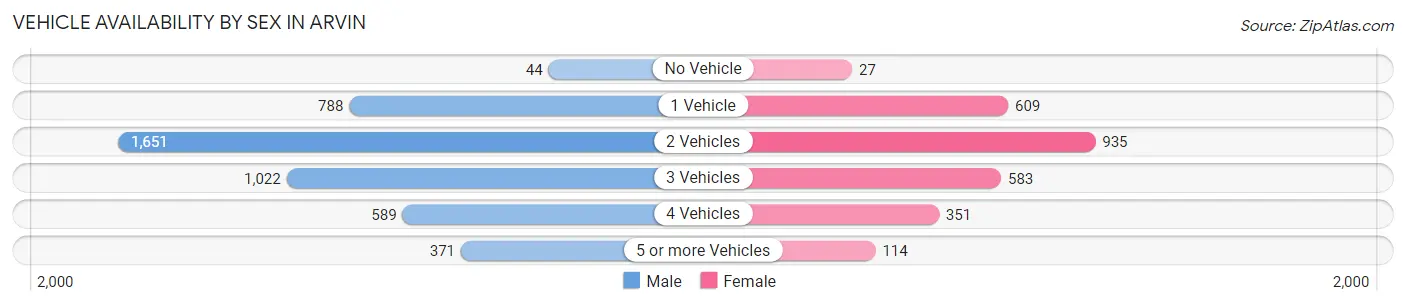
| Vehicles Available | Male | Female |
| No Vehicle | 44 (1.0%) | 27 (1.0%) |
| 1 Vehicle | 788 (17.6%) | 609 (23.3%) |
| 2 Vehicles | 1,651 (37.0%) | 935 (35.7%) |
| 3 Vehicles | 1,022 (22.9%) | 583 (22.3%) |
| 4 Vehicles | 589 (13.2%) | 351 (13.4%) |
| 5 or more Vehicles | 371 (8.3%) | 114 (4.3%) |
| Total | 4,465 (100.0%) | 2,619 (100.0%) |
Commute Time in Arvin
The most frequently occuring commute durations in Arvin are 20 to 24 minutes (1,526 commuters, 22.0%), 15 to 19 minutes (1,434 commuters, 20.7%), and 30 to 34 minutes (985 commuters, 14.2%).
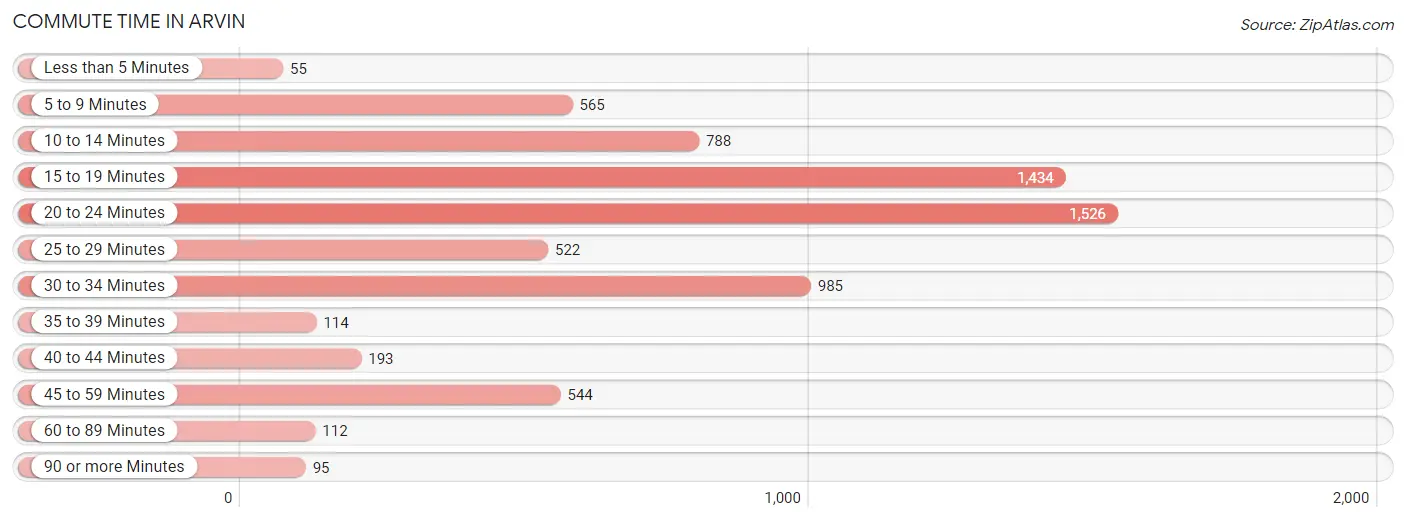
| Commute Time | # Commuters | % Commuters |
| Less than 5 Minutes | 55 | 0.8% |
| 5 to 9 Minutes | 565 | 8.2% |
| 10 to 14 Minutes | 788 | 11.4% |
| 15 to 19 Minutes | 1,434 | 20.7% |
| 20 to 24 Minutes | 1,526 | 22.0% |
| 25 to 29 Minutes | 522 | 7.5% |
| 30 to 34 Minutes | 985 | 14.2% |
| 35 to 39 Minutes | 114 | 1.6% |
| 40 to 44 Minutes | 193 | 2.8% |
| 45 to 59 Minutes | 544 | 7.9% |
| 60 to 89 Minutes | 112 | 1.6% |
| 90 or more Minutes | 95 | 1.4% |
Commute Time by Sex in Arvin
The most common commute times in Arvin are 20 to 24 minutes (1,073 commuters, 24.3%) for males and 15 to 19 minutes (508 commuters, 20.2%) for females.
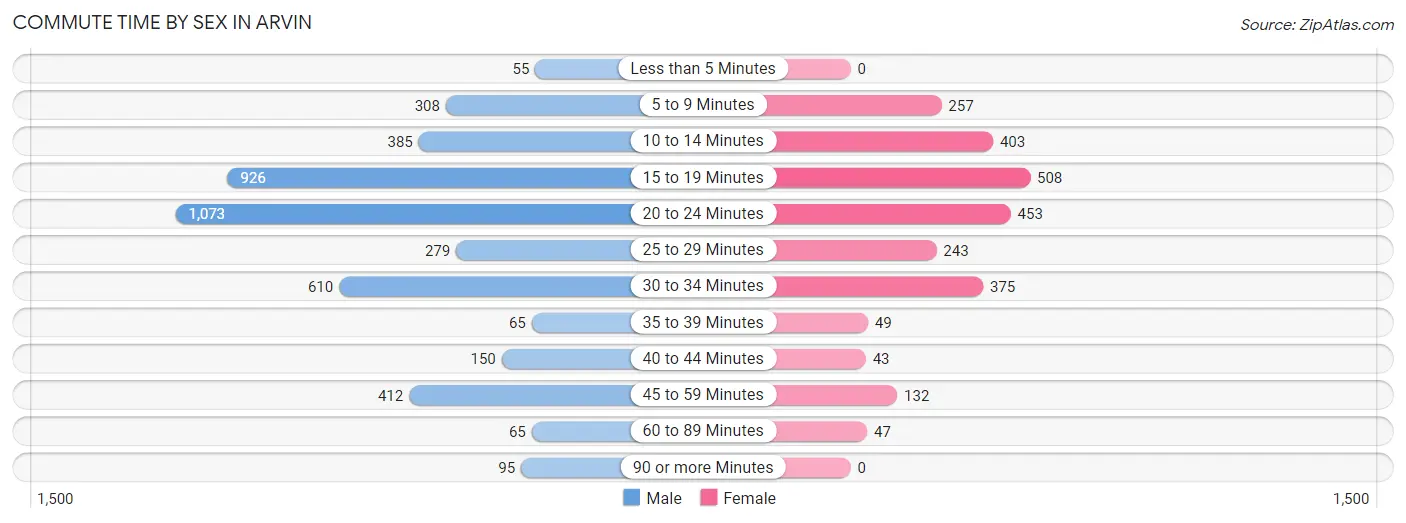
| Commute Time | Male | Female |
| Less than 5 Minutes | 55 (1.2%) | 0 (0.0%) |
| 5 to 9 Minutes | 308 (7.0%) | 257 (10.2%) |
| 10 to 14 Minutes | 385 (8.7%) | 403 (16.1%) |
| 15 to 19 Minutes | 926 (20.9%) | 508 (20.2%) |
| 20 to 24 Minutes | 1,073 (24.3%) | 453 (18.0%) |
| 25 to 29 Minutes | 279 (6.3%) | 243 (9.7%) |
| 30 to 34 Minutes | 610 (13.8%) | 375 (14.9%) |
| 35 to 39 Minutes | 65 (1.5%) | 49 (1.9%) |
| 40 to 44 Minutes | 150 (3.4%) | 43 (1.7%) |
| 45 to 59 Minutes | 412 (9.3%) | 132 (5.3%) |
| 60 to 89 Minutes | 65 (1.5%) | 47 (1.9%) |
| 90 or more Minutes | 95 (2.1%) | 0 (0.0%) |
Time of Departure to Work by Sex in Arvin
The most frequent times of departure to work in Arvin are 6:00 AM to 6:29 AM (1,673, 37.8%) for males and 6:00 AM to 6:29 AM (519, 20.7%) for females.
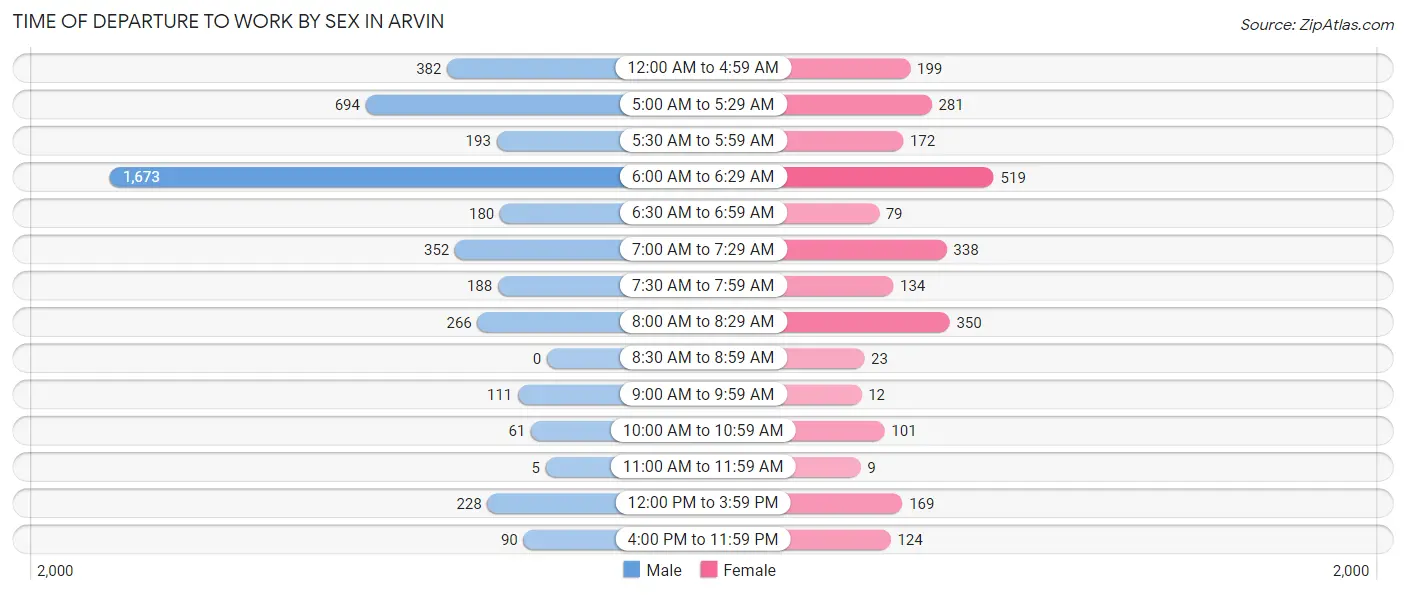
| Time of Departure | Male | Female |
| 12:00 AM to 4:59 AM | 382 (8.6%) | 199 (7.9%) |
| 5:00 AM to 5:29 AM | 694 (15.7%) | 281 (11.2%) |
| 5:30 AM to 5:59 AM | 193 (4.4%) | 172 (6.9%) |
| 6:00 AM to 6:29 AM | 1,673 (37.8%) | 519 (20.7%) |
| 6:30 AM to 6:59 AM | 180 (4.1%) | 79 (3.2%) |
| 7:00 AM to 7:29 AM | 352 (8.0%) | 338 (13.5%) |
| 7:30 AM to 7:59 AM | 188 (4.3%) | 134 (5.3%) |
| 8:00 AM to 8:29 AM | 266 (6.0%) | 350 (13.9%) |
| 8:30 AM to 8:59 AM | 0 (0.0%) | 23 (0.9%) |
| 9:00 AM to 9:59 AM | 111 (2.5%) | 12 (0.5%) |
| 10:00 AM to 10:59 AM | 61 (1.4%) | 101 (4.0%) |
| 11:00 AM to 11:59 AM | 5 (0.1%) | 9 (0.4%) |
| 12:00 PM to 3:59 PM | 228 (5.1%) | 169 (6.7%) |
| 4:00 PM to 11:59 PM | 90 (2.0%) | 124 (4.9%) |
| Total | 4,423 (100.0%) | 2,510 (100.0%) |
Housing Occupancy in Arvin
Occupancy by Ownership in Arvin
Of the total 4,475 dwellings in Arvin, owner-occupied units account for 2,392 (53.4%), while renter-occupied units make up 2,083 (46.6%).
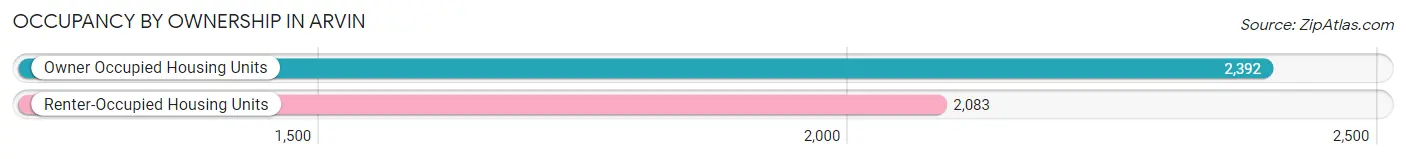
| Occupancy | # Housing Units | % Housing Units |
| Owner Occupied Housing Units | 2,392 | 53.4% |
| Renter-Occupied Housing Units | 2,083 | 46.6% |
| Total Occupied Housing Units | 4,475 | 100.0% |
Occupancy by Household Size in Arvin
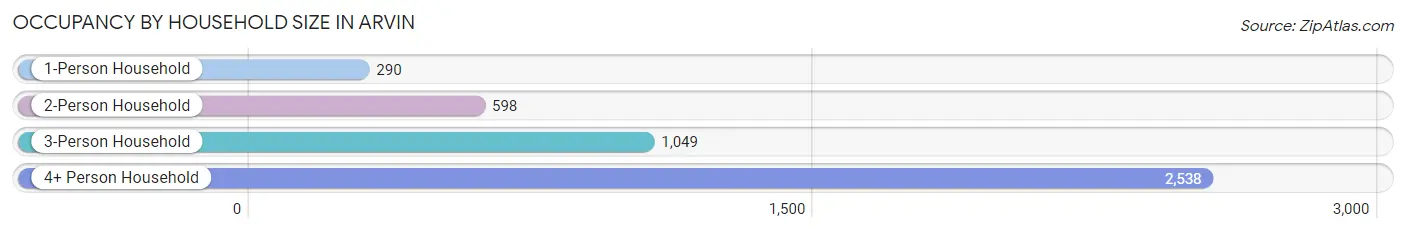
| Household Size | # Housing Units | % Housing Units |
| 1-Person Household | 290 | 6.5% |
| 2-Person Household | 598 | 13.4% |
| 3-Person Household | 1,049 | 23.4% |
| 4+ Person Household | 2,538 | 56.7% |
| Total Housing Units | 4,475 | 100.0% |
Occupancy by Ownership by Household Size in Arvin
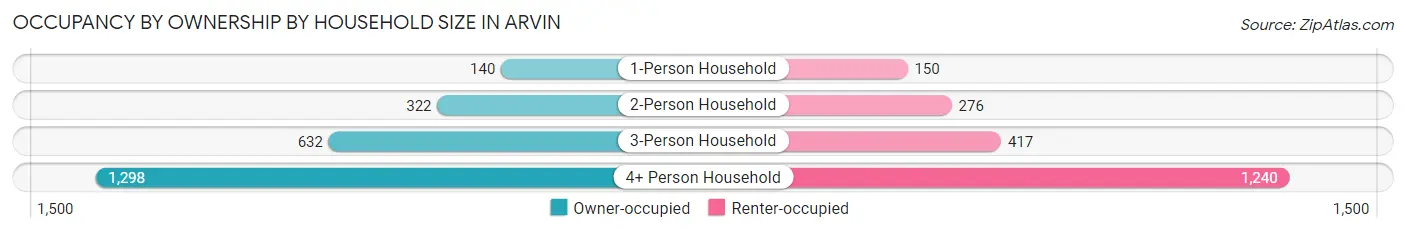
| Household Size | Owner-occupied | Renter-occupied |
| 1-Person Household | 140 (48.3%) | 150 (51.7%) |
| 2-Person Household | 322 (53.8%) | 276 (46.2%) |
| 3-Person Household | 632 (60.3%) | 417 (39.8%) |
| 4+ Person Household | 1,298 (51.1%) | 1,240 (48.9%) |
| Total Housing Units | 2,392 (53.4%) | 2,083 (46.6%) |
Occupancy by Educational Attainment in Arvin
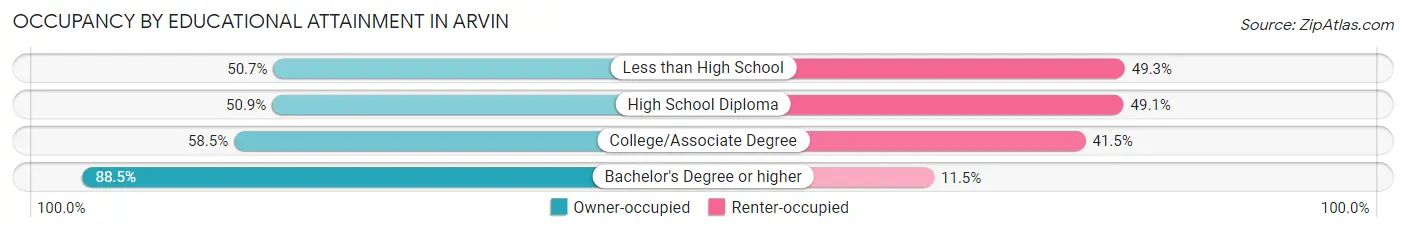
| Household Size | Owner-occupied | Renter-occupied |
| Less than High School | 1,171 (50.7%) | 1,139 (49.3%) |
| High School Diploma | 657 (50.9%) | 633 (49.1%) |
| College/Associate Degree | 410 (58.5%) | 291 (41.5%) |
| Bachelor's Degree or higher | 154 (88.5%) | 20 (11.5%) |
Occupancy by Age of Householder in Arvin
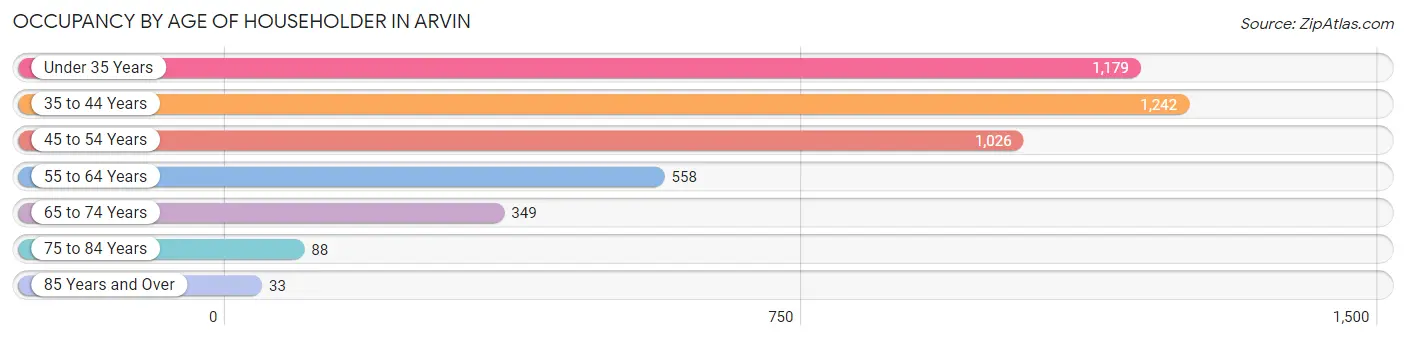
| Age Bracket | # Households | % Households |
| Under 35 Years | 1,179 | 26.4% |
| 35 to 44 Years | 1,242 | 27.8% |
| 45 to 54 Years | 1,026 | 22.9% |
| 55 to 64 Years | 558 | 12.5% |
| 65 to 74 Years | 349 | 7.8% |
| 75 to 84 Years | 88 | 2.0% |
| 85 Years and Over | 33 | 0.7% |
| Total | 4,475 | 100.0% |
Housing Finances in Arvin
Median Income by Occupancy in Arvin
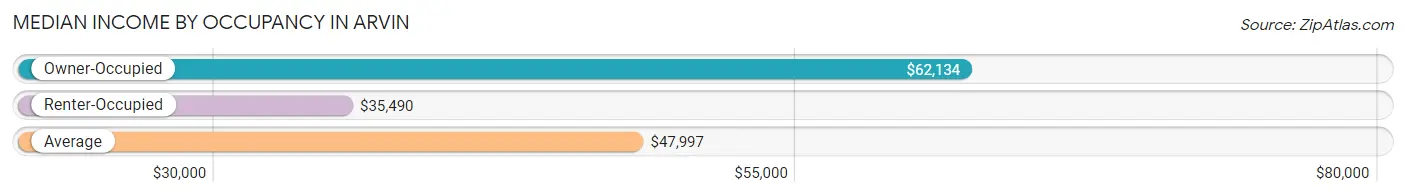
| Occupancy Type | # Households | Median Income |
| Owner-Occupied | 2,392 (53.4%) | $62,134 |
| Renter-Occupied | 2,083 (46.6%) | $35,490 |
| Average | 4,475 (100.0%) | $47,997 |
Occupancy by Householder Income Bracket in Arvin
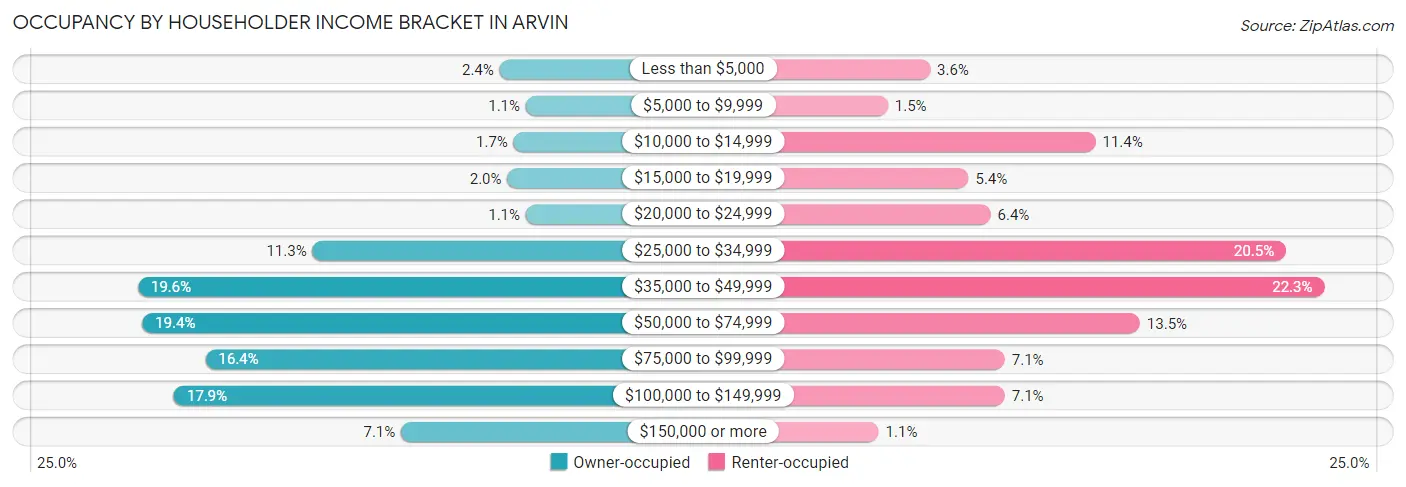
| Income Bracket | Owner-occupied | Renter-occupied |
| Less than $5,000 | 57 (2.4%) | 74 (3.5%) |
| $5,000 to $9,999 | 27 (1.1%) | 32 (1.5%) |
| $10,000 to $14,999 | 41 (1.7%) | 238 (11.4%) |
| $15,000 to $19,999 | 48 (2.0%) | 112 (5.4%) |
| $20,000 to $24,999 | 27 (1.1%) | 134 (6.4%) |
| $25,000 to $34,999 | 270 (11.3%) | 427 (20.5%) |
| $35,000 to $49,999 | 469 (19.6%) | 465 (22.3%) |
| $50,000 to $74,999 | 464 (19.4%) | 282 (13.5%) |
| $75,000 to $99,999 | 392 (16.4%) | 148 (7.1%) |
| $100,000 to $149,999 | 428 (17.9%) | 148 (7.1%) |
| $150,000 or more | 169 (7.1%) | 23 (1.1%) |
| Total | 2,392 (100.0%) | 2,083 (100.0%) |
Monthly Housing Cost Tiers in Arvin
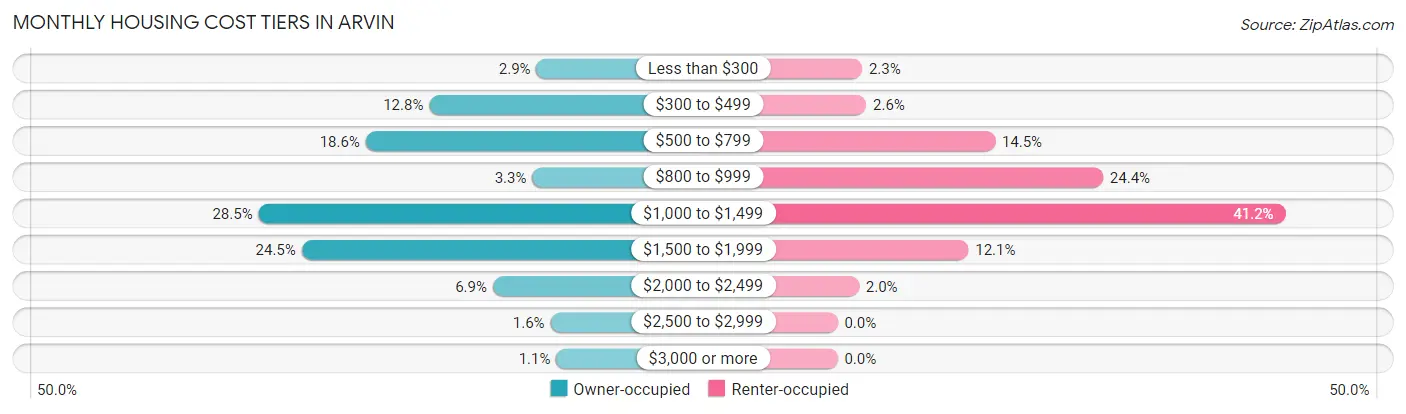
| Monthly Cost | Owner-occupied | Renter-occupied |
| Less than $300 | 69 (2.9%) | 47 (2.3%) |
| $300 to $499 | 305 (12.8%) | 55 (2.6%) |
| $500 to $799 | 445 (18.6%) | 302 (14.5%) |
| $800 to $999 | 78 (3.3%) | 509 (24.4%) |
| $1,000 to $1,499 | 681 (28.5%) | 859 (41.2%) |
| $1,500 to $1,999 | 586 (24.5%) | 251 (12.0%) |
| $2,000 to $2,499 | 165 (6.9%) | 41 (2.0%) |
| $2,500 to $2,999 | 38 (1.6%) | 0 (0.0%) |
| $3,000 or more | 25 (1.1%) | 0 (0.0%) |
| Total | 2,392 (100.0%) | 2,083 (100.0%) |
Physical Housing Characteristics in Arvin
Housing Structures in Arvin
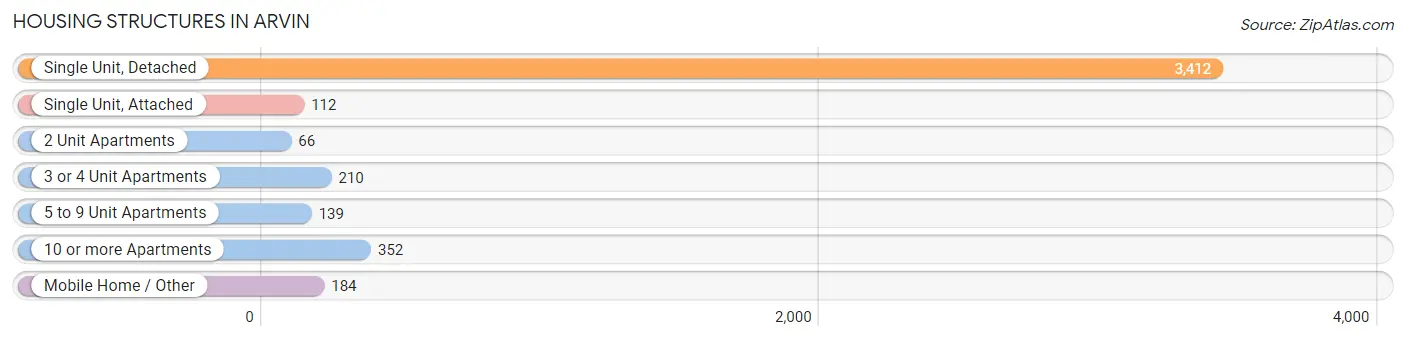
| Structure Type | # Housing Units | % Housing Units |
| Single Unit, Detached | 3,412 | 76.2% |
| Single Unit, Attached | 112 | 2.5% |
| 2 Unit Apartments | 66 | 1.5% |
| 3 or 4 Unit Apartments | 210 | 4.7% |
| 5 to 9 Unit Apartments | 139 | 3.1% |
| 10 or more Apartments | 352 | 7.9% |
| Mobile Home / Other | 184 | 4.1% |
| Total | 4,475 | 100.0% |
Housing Structures by Occupancy in Arvin
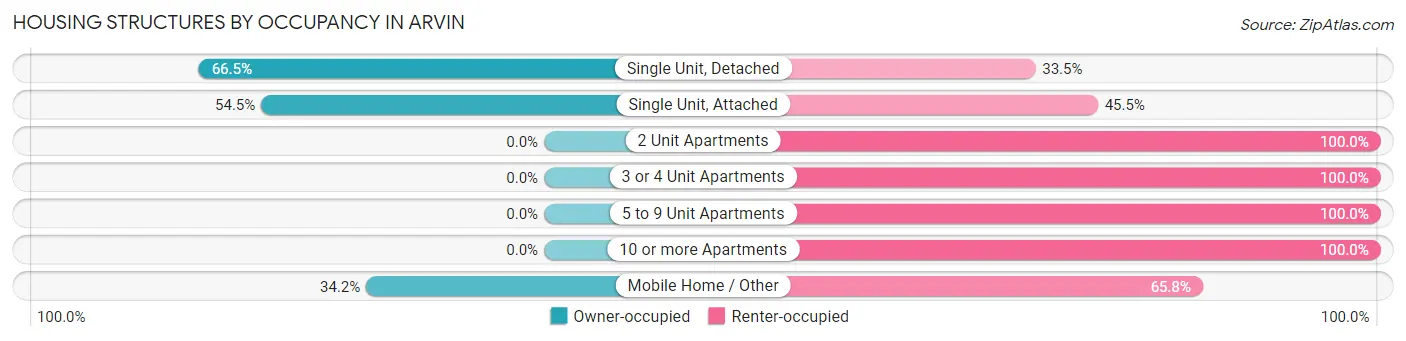
| Structure Type | Owner-occupied | Renter-occupied |
| Single Unit, Detached | 2,268 (66.5%) | 1,144 (33.5%) |
| Single Unit, Attached | 61 (54.5%) | 51 (45.5%) |
| 2 Unit Apartments | 0 (0.0%) | 66 (100.0%) |
| 3 or 4 Unit Apartments | 0 (0.0%) | 210 (100.0%) |
| 5 to 9 Unit Apartments | 0 (0.0%) | 139 (100.0%) |
| 10 or more Apartments | 0 (0.0%) | 352 (100.0%) |
| Mobile Home / Other | 63 (34.2%) | 121 (65.8%) |
| Total | 2,392 (53.4%) | 2,083 (46.6%) |
Housing Structures by Number of Rooms in Arvin
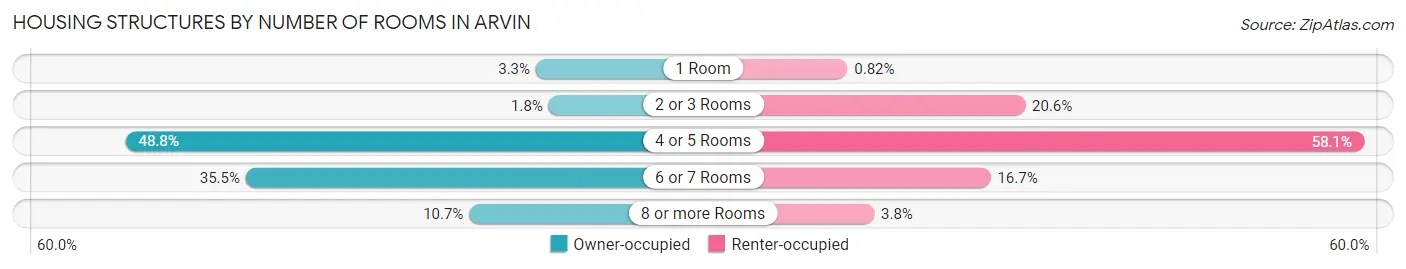
| Number of Rooms | Owner-occupied | Renter-occupied |
| 1 Room | 78 (3.3%) | 17 (0.8%) |
| 2 or 3 Rooms | 44 (1.8%) | 428 (20.5%) |
| 4 or 5 Rooms | 1,167 (48.8%) | 1,211 (58.1%) |
| 6 or 7 Rooms | 848 (35.4%) | 348 (16.7%) |
| 8 or more Rooms | 255 (10.7%) | 79 (3.8%) |
| Total | 2,392 (100.0%) | 2,083 (100.0%) |
Housing Structure by Heating Type in Arvin
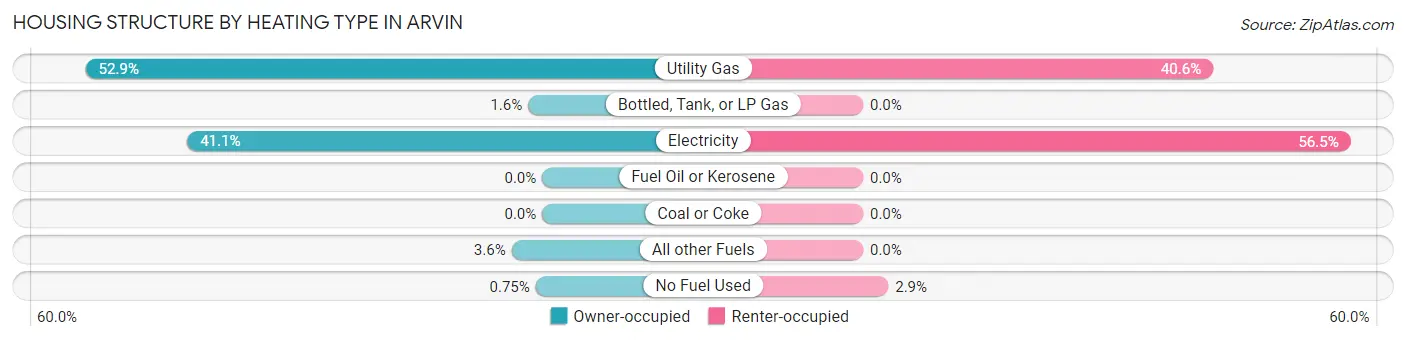
| Heating Type | Owner-occupied | Renter-occupied |
| Utility Gas | 1,266 (52.9%) | 845 (40.6%) |
| Bottled, Tank, or LP Gas | 39 (1.6%) | 0 (0.0%) |
| Electricity | 984 (41.1%) | 1,177 (56.5%) |
| Fuel Oil or Kerosene | 0 (0.0%) | 0 (0.0%) |
| Coal or Coke | 0 (0.0%) | 0 (0.0%) |
| All other Fuels | 85 (3.5%) | 0 (0.0%) |
| No Fuel Used | 18 (0.7%) | 61 (2.9%) |
| Total | 2,392 (100.0%) | 2,083 (100.0%) |
Household Vehicle Usage in Arvin
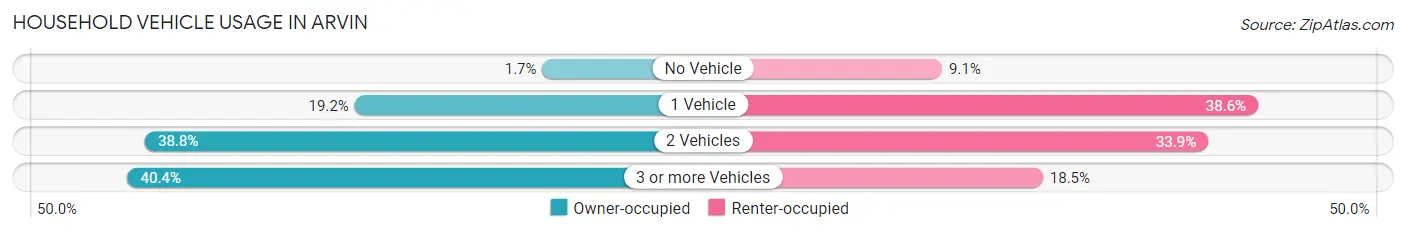
| Vehicles per Household | Owner-occupied | Renter-occupied |
| No Vehicle | 40 (1.7%) | 189 (9.1%) |
| 1 Vehicle | 459 (19.2%) | 803 (38.6%) |
| 2 Vehicles | 927 (38.8%) | 706 (33.9%) |
| 3 or more Vehicles | 966 (40.4%) | 385 (18.5%) |
| Total | 2,392 (100.0%) | 2,083 (100.0%) |
Real Estate & Mortgages in Arvin
Real Estate and Mortgage Overview in Arvin
| Characteristic | Without Mortgage | With Mortgage |
| Housing Units | 815 | 1,577 |
| Median Property Value | $188,400 | $240,900 |
| Median Household Income | $54,896 | $119 |
| Monthly Housing Costs | $521 | $25 |
| Real Estate Taxes | $2,110 | $50 |
Property Value by Mortgage Status in Arvin
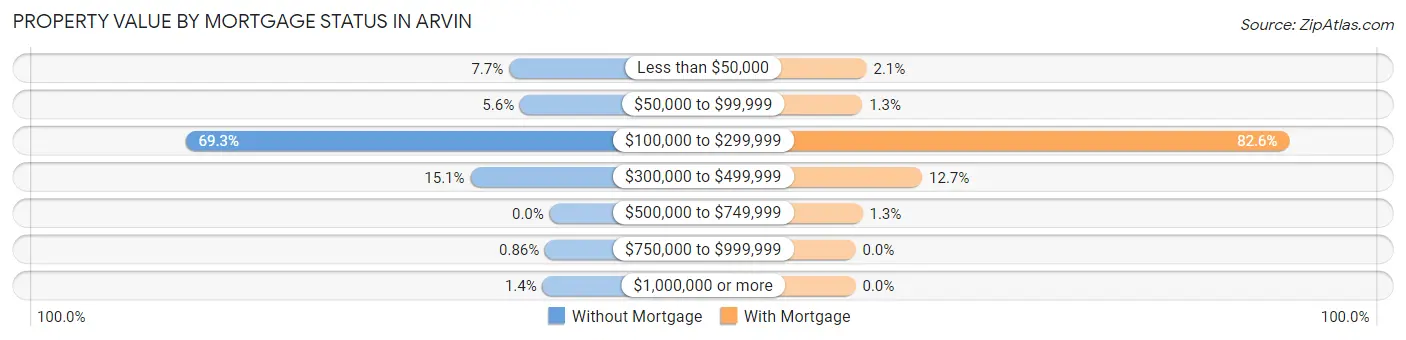
| Property Value | Without Mortgage | With Mortgage |
| Less than $50,000 | 63 (7.7%) | 33 (2.1%) |
| $50,000 to $99,999 | 46 (5.6%) | 20 (1.3%) |
| $100,000 to $299,999 | 565 (69.3%) | 1,303 (82.6%) |
| $300,000 to $499,999 | 123 (15.1%) | 200 (12.7%) |
| $500,000 to $749,999 | 0 (0.0%) | 21 (1.3%) |
| $750,000 to $999,999 | 7 (0.9%) | 0 (0.0%) |
| $1,000,000 or more | 11 (1.3%) | 0 (0.0%) |
| Total | 815 (100.0%) | 1,577 (100.0%) |
Household Income by Mortgage Status in Arvin
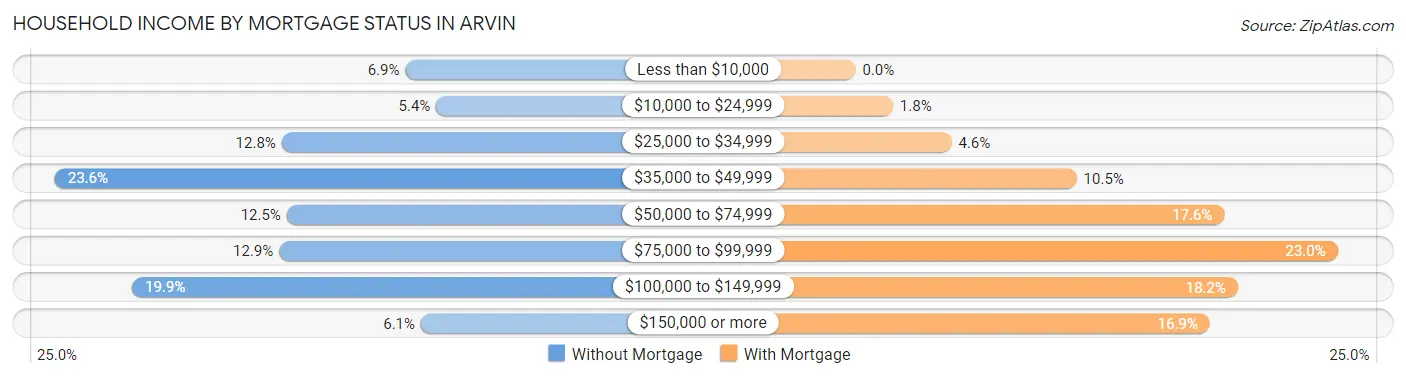
| Household Income | Without Mortgage | With Mortgage |
| Less than $10,000 | 56 (6.9%) | 0 (0.0%) |
| $10,000 to $24,999 | 44 (5.4%) | 28 (1.8%) |
| $25,000 to $34,999 | 104 (12.8%) | 72 (4.6%) |
| $35,000 to $49,999 | 192 (23.6%) | 166 (10.5%) |
| $50,000 to $74,999 | 102 (12.5%) | 277 (17.6%) |
| $75,000 to $99,999 | 105 (12.9%) | 362 (23.0%) |
| $100,000 to $149,999 | 162 (19.9%) | 287 (18.2%) |
| $150,000 or more | 50 (6.1%) | 266 (16.9%) |
| Total | 815 (100.0%) | 1,577 (100.0%) |
Property Value to Household Income Ratio in Arvin
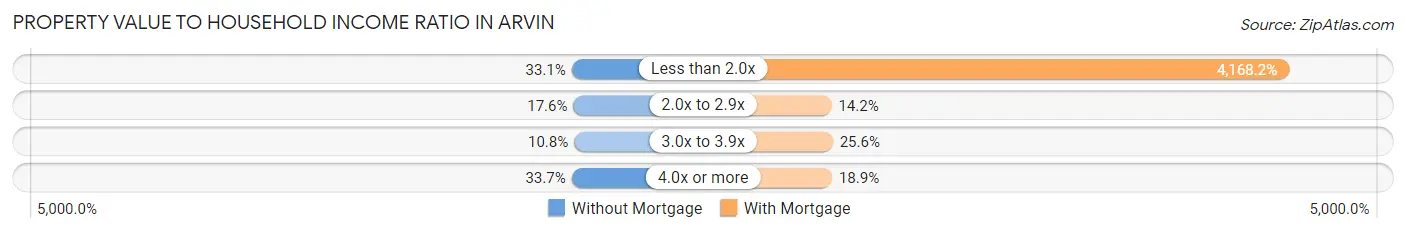
| Value-to-Income Ratio | Without Mortgage | With Mortgage |
| Less than 2.0x | 270 (33.1%) | 65,733 (4,168.2%) |
| 2.0x to 2.9x | 143 (17.5%) | 224 (14.2%) |
| 3.0x to 3.9x | 88 (10.8%) | 404 (25.6%) |
| 4.0x or more | 275 (33.7%) | 298 (18.9%) |
| Total | 815 (100.0%) | 1,577 (100.0%) |
Real Estate Taxes by Mortgage Status in Arvin
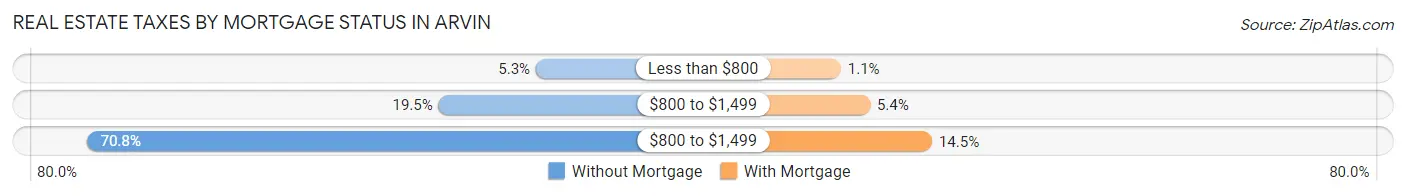
| Property Taxes | Without Mortgage | With Mortgage |
| Less than $800 | 43 (5.3%) | 18 (1.1%) |
| $800 to $1,499 | 159 (19.5%) | 85 (5.4%) |
| $800 to $1,499 | 577 (70.8%) | 228 (14.5%) |
| Total | 815 (100.0%) | 1,577 (100.0%) |
Health & Disability in Arvin
Health Insurance Coverage by Age in Arvin
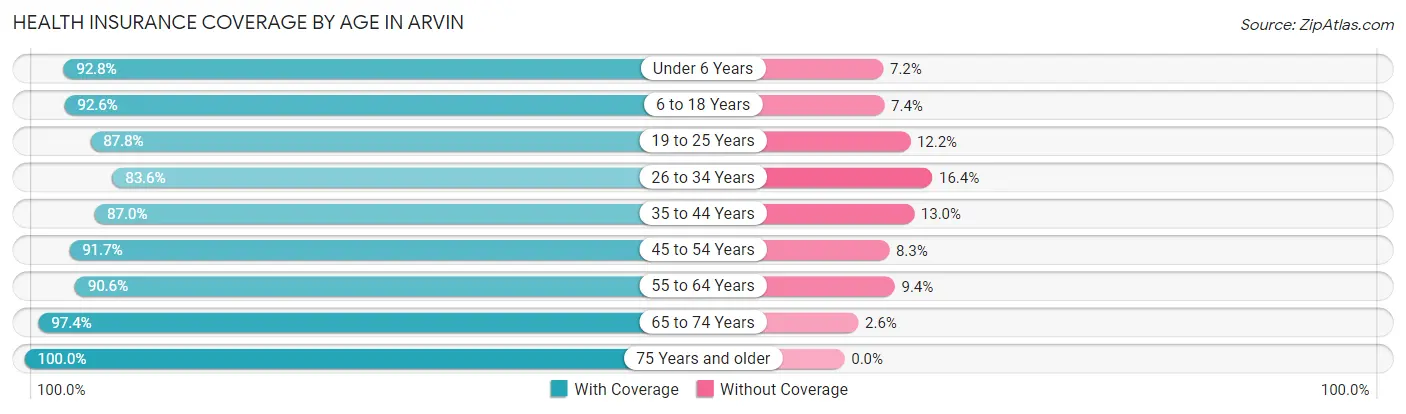
| Age Bracket | With Coverage | Without Coverage |
| Under 6 Years | 2,222 (92.8%) | 173 (7.2%) |
| 6 to 18 Years | 4,808 (92.6%) | 386 (7.4%) |
| 19 to 25 Years | 2,193 (87.8%) | 306 (12.2%) |
| 26 to 34 Years | 2,122 (83.6%) | 415 (16.4%) |
| 35 to 44 Years | 2,214 (87.0%) | 330 (13.0%) |
| 45 to 54 Years | 1,772 (91.7%) | 161 (8.3%) |
| 55 to 64 Years | 1,296 (90.6%) | 134 (9.4%) |
| 65 to 74 Years | 604 (97.4%) | 16 (2.6%) |
| 75 Years and older | 368 (100.0%) | 0 (0.0%) |
| Total | 17,599 (90.2%) | 1,921 (9.8%) |
Health Insurance Coverage by Citizenship Status in Arvin
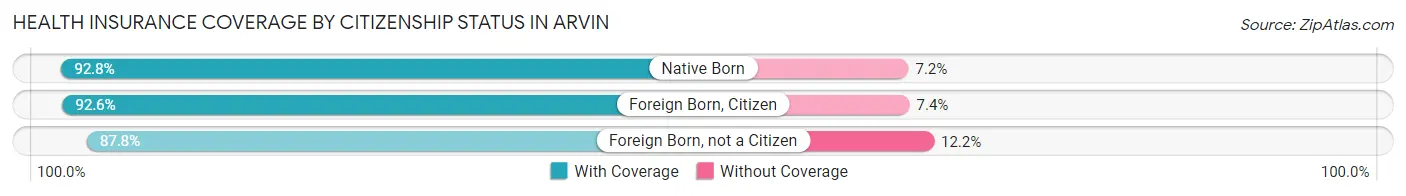
| Citizenship Status | With Coverage | Without Coverage |
| Native Born | 2,222 (92.8%) | 173 (7.2%) |
| Foreign Born, Citizen | 4,808 (92.6%) | 386 (7.4%) |
| Foreign Born, not a Citizen | 2,193 (87.8%) | 306 (12.2%) |
Health Insurance Coverage by Household Income in Arvin
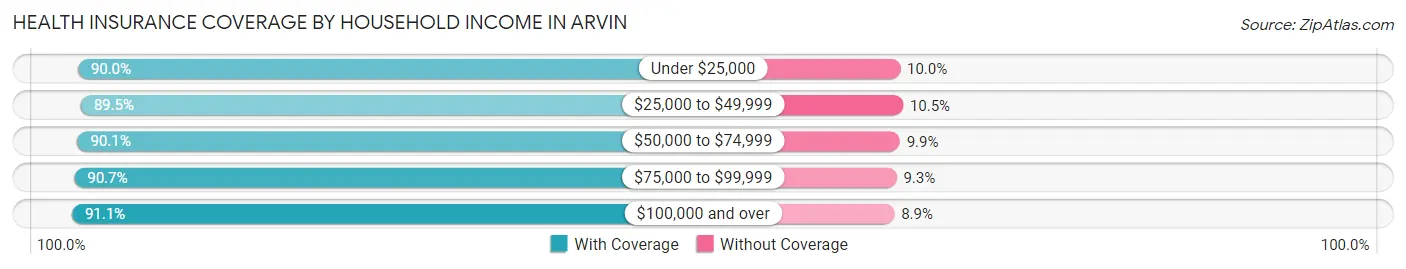
| Household Income | With Coverage | Without Coverage |
| Under $25,000 | 2,537 (90.0%) | 281 (10.0%) |
| $25,000 to $49,999 | 5,826 (89.5%) | 685 (10.5%) |
| $50,000 to $74,999 | 2,952 (90.1%) | 325 (9.9%) |
| $75,000 to $99,999 | 2,619 (90.7%) | 269 (9.3%) |
| $100,000 and over | 3,663 (91.1%) | 357 (8.9%) |
Public vs Private Health Insurance Coverage by Age in Arvin
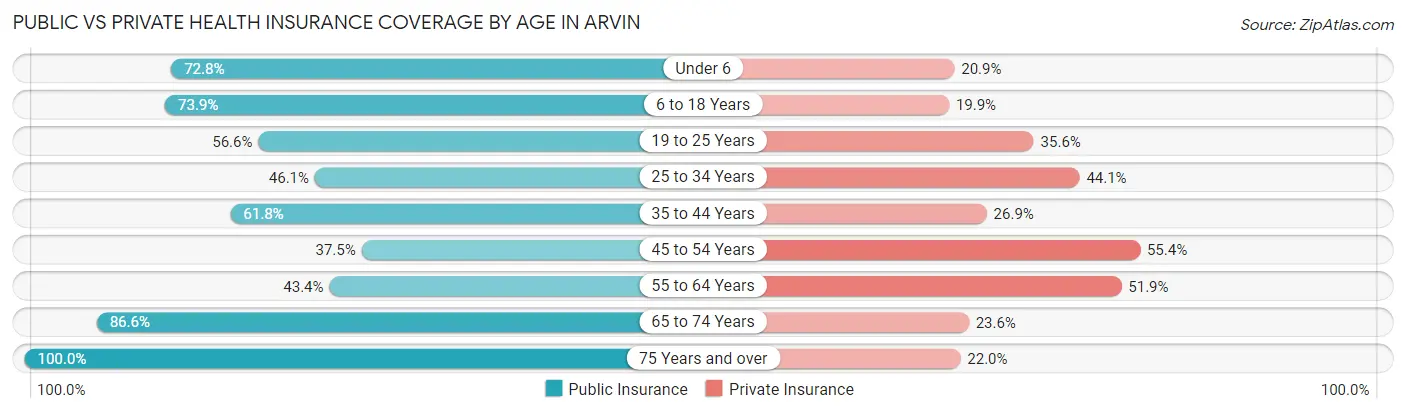
| Age Bracket | Public Insurance | Private Insurance |
| Under 6 | 1,743 (72.8%) | 500 (20.9%) |
| 6 to 18 Years | 3,839 (73.9%) | 1,033 (19.9%) |
| 19 to 25 Years | 1,415 (56.6%) | 890 (35.6%) |
| 25 to 34 Years | 1,170 (46.1%) | 1,119 (44.1%) |
| 35 to 44 Years | 1,572 (61.8%) | 684 (26.9%) |
| 45 to 54 Years | 724 (37.4%) | 1,070 (55.3%) |
| 55 to 64 Years | 621 (43.4%) | 742 (51.9%) |
| 65 to 74 Years | 537 (86.6%) | 146 (23.5%) |
| 75 Years and over | 368 (100.0%) | 81 (22.0%) |
| Total | 11,989 (61.4%) | 6,265 (32.1%) |
Disability Status by Sex by Age in Arvin
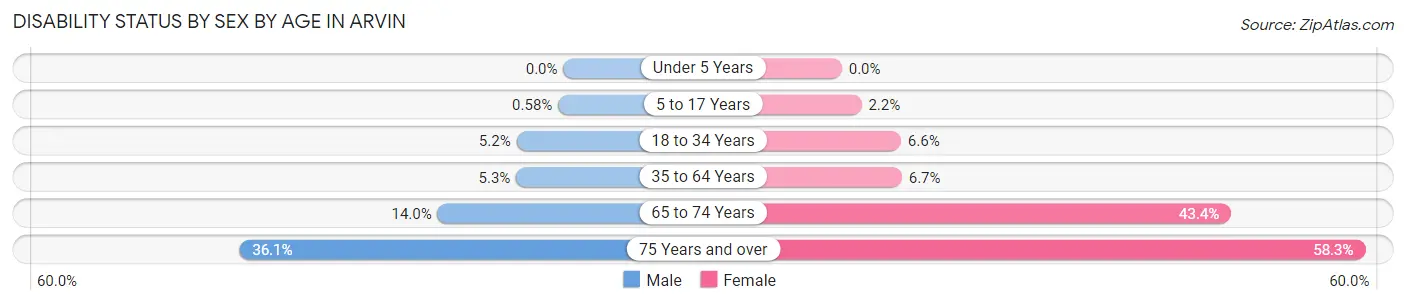
| Age Bracket | Male | Female |
| Under 5 Years | 0 (0.0%) | 0 (0.0%) |
| 5 to 17 Years | 15 (0.6%) | 57 (2.2%) |
| 18 to 34 Years | 160 (5.2%) | 160 (6.6%) |
| 35 to 64 Years | 149 (5.2%) | 205 (6.7%) |
| 65 to 74 Years | 51 (14.0%) | 111 (43.4%) |
| 75 Years and over | 48 (36.1%) | 137 (58.3%) |
Disability Class by Sex by Age in Arvin
Disability Class: Hearing Difficulty
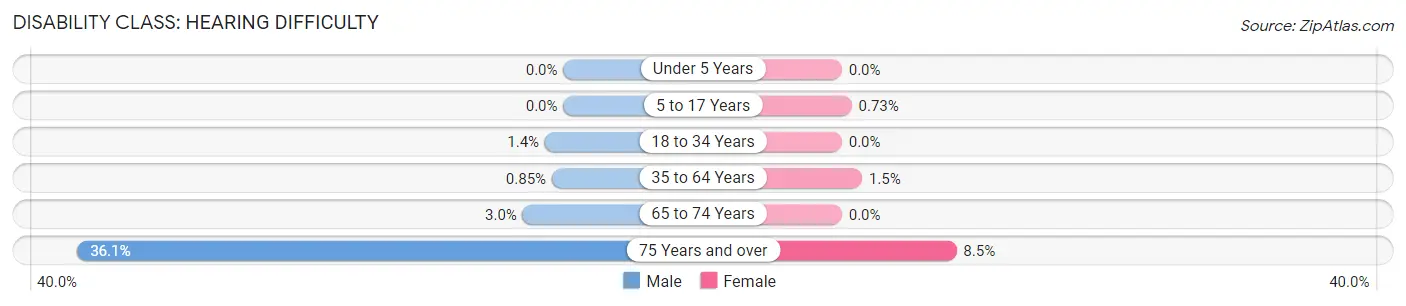
| Age Bracket | Male | Female |
| Under 5 Years | 0 (0.0%) | 0 (0.0%) |
| 5 to 17 Years | 0 (0.0%) | 19 (0.7%) |
| 18 to 34 Years | 42 (1.4%) | 0 (0.0%) |
| 35 to 64 Years | 24 (0.9%) | 46 (1.5%) |
| 65 to 74 Years | 11 (3.0%) | 0 (0.0%) |
| 75 Years and over | 48 (36.1%) | 20 (8.5%) |
Disability Class: Vision Difficulty
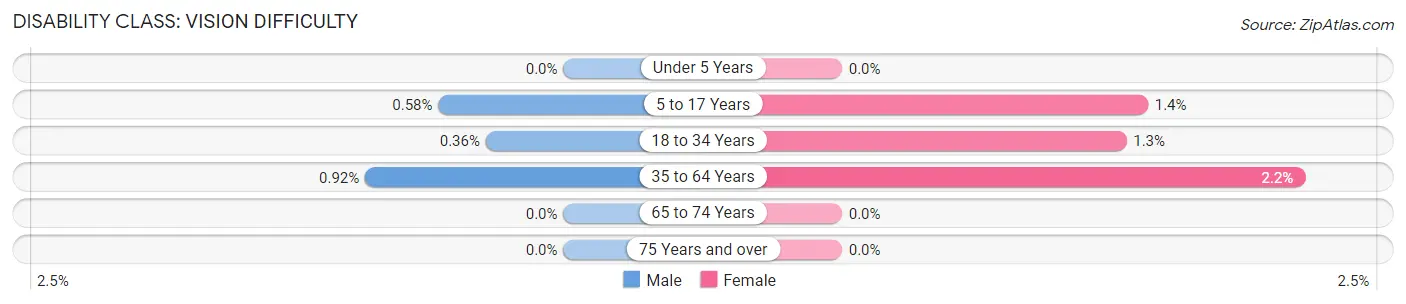
| Age Bracket | Male | Female |
| Under 5 Years | 0 (0.0%) | 0 (0.0%) |
| 5 to 17 Years | 15 (0.6%) | 37 (1.4%) |
| 18 to 34 Years | 11 (0.4%) | 32 (1.3%) |
| 35 to 64 Years | 26 (0.9%) | 66 (2.1%) |
| 65 to 74 Years | 0 (0.0%) | 0 (0.0%) |
| 75 Years and over | 0 (0.0%) | 0 (0.0%) |
Disability Class: Cognitive Difficulty
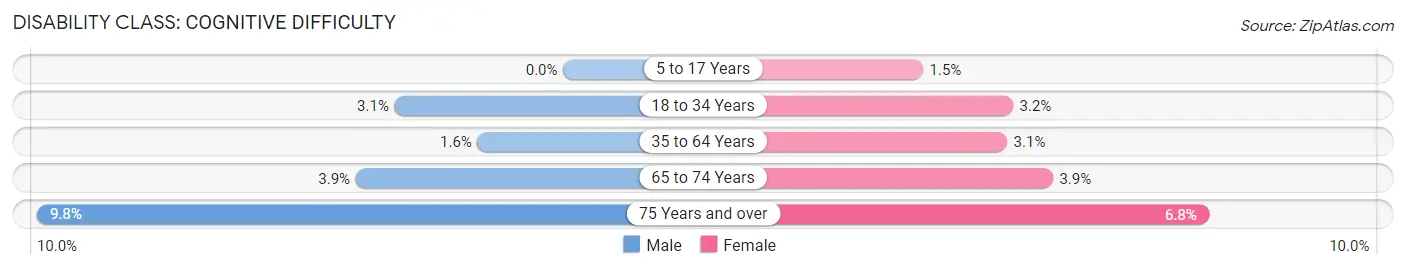
| Age Bracket | Male | Female |
| 5 to 17 Years | 0 (0.0%) | 39 (1.5%) |
| 18 to 34 Years | 96 (3.1%) | 77 (3.2%) |
| 35 to 64 Years | 45 (1.6%) | 94 (3.1%) |
| 65 to 74 Years | 14 (3.8%) | 10 (3.9%) |
| 75 Years and over | 13 (9.8%) | 16 (6.8%) |
Disability Class: Ambulatory Difficulty
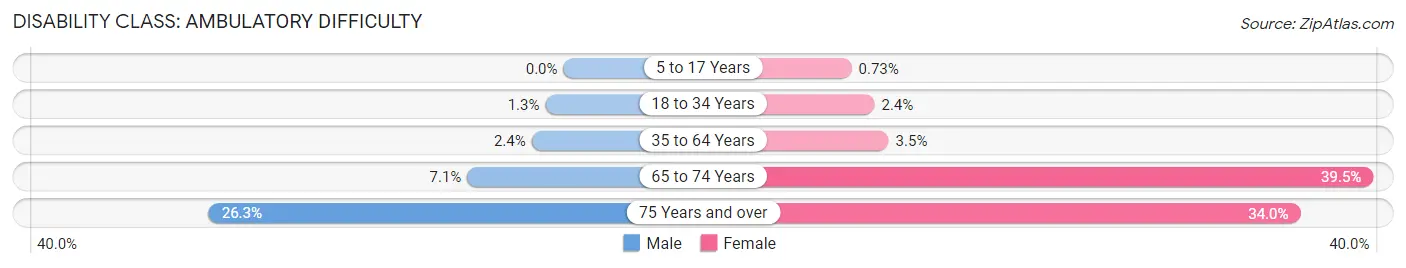
| Age Bracket | Male | Female |
| 5 to 17 Years | 0 (0.0%) | 19 (0.7%) |
| 18 to 34 Years | 41 (1.3%) | 59 (2.4%) |
| 35 to 64 Years | 67 (2.4%) | 107 (3.5%) |
| 65 to 74 Years | 26 (7.1%) | 101 (39.5%) |
| 75 Years and over | 35 (26.3%) | 80 (34.0%) |
Disability Class: Self-Care Difficulty
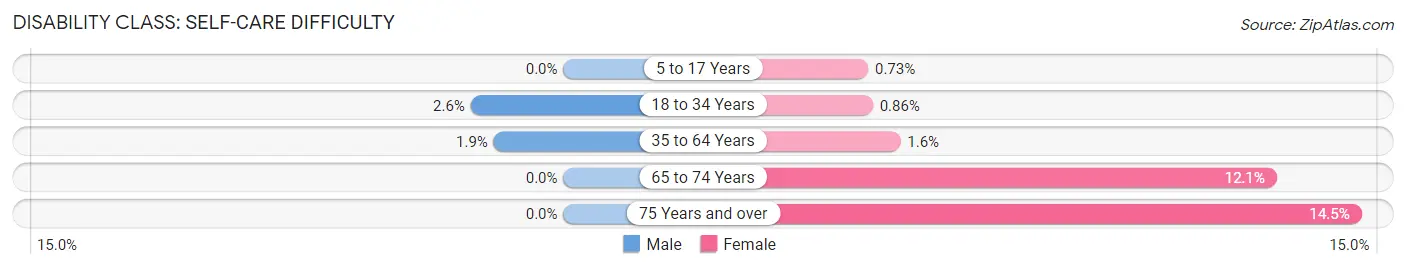
| Age Bracket | Male | Female |
| 5 to 17 Years | 0 (0.0%) | 19 (0.7%) |
| 18 to 34 Years | 79 (2.6%) | 21 (0.9%) |
| 35 to 64 Years | 55 (1.9%) | 50 (1.6%) |
| 65 to 74 Years | 0 (0.0%) | 31 (12.1%) |
| 75 Years and over | 0 (0.0%) | 34 (14.5%) |
Technology Access in Arvin
Computing Device Access in Arvin
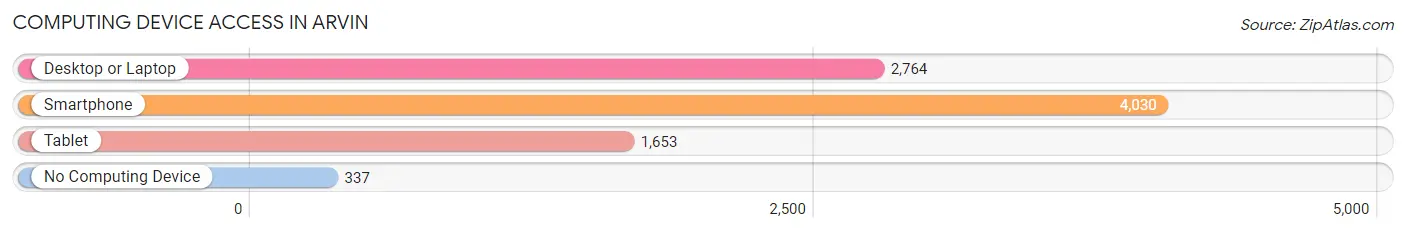
| Device Type | # Households | % Households |
| Desktop or Laptop | 2,764 | 61.8% |
| Smartphone | 4,030 | 90.1% |
| Tablet | 1,653 | 36.9% |
| No Computing Device | 337 | 7.5% |
| Total | 4,475 | 100.0% |
Internet Access in Arvin
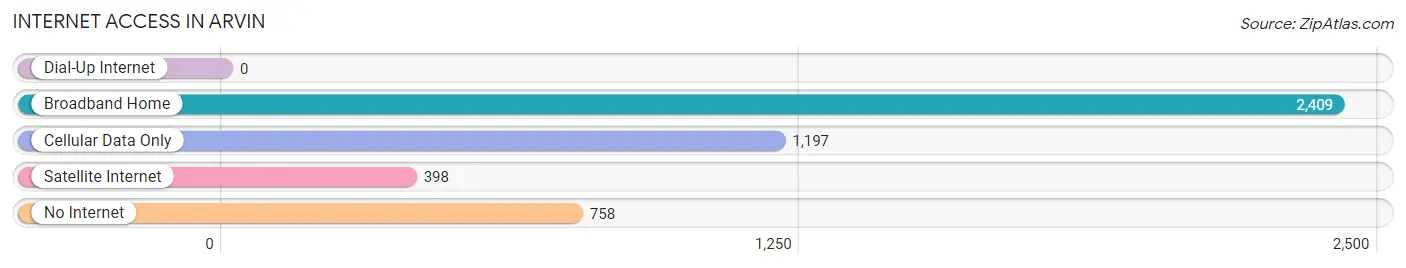
| Internet Type | # Households | % Households |
| Dial-Up Internet | 0 | 0.0% |
| Broadband Home | 2,409 | 53.8% |
| Cellular Data Only | 1,197 | 26.8% |
| Satellite Internet | 398 | 8.9% |
| No Internet | 758 | 16.9% |
| Total | 4,475 | 100.0% |
Arvin Summary
Arvin is a small city located in Kern County, California, United States. It is situated in the southern San Joaquin Valley, approximately 8 miles (13 km) southeast of Bakersfield. The population was 19,304 at the 2010 census, up from 12,956 at the 2000 census.
History
Arvin was founded in 1914 by Dr. William B. Smiley, a dentist from Los Angeles. He purchased the land from the Southern Pacific Railroad and named the town after his son, Arvin. The town was incorporated in 1960.
Geography
Arvin is located at 35°15′N 119°2′W (35.25, -119.03). According to the United States Census Bureau, the city has a total area of 4.8 square miles (12.4 km2), all of it land.
Economy
Arvin is a major agricultural center in the San Joaquin Valley. The city is home to a variety of agricultural products, including grapes, cotton, citrus, and almonds. The city is also home to a number of manufacturing and industrial businesses, including a large poultry processing plant.
Demographics
As of the census of 2000, there were 12,956 people, 3,841 households, and 3,154 families residing in the city. The population density was 2,691.3 people per square mile (1,039.2/km2). There were 4,039 housing units at an average density of 845.3 per square mile (326.2/km2). The racial makeup of the city was 57.7% White, 4.2% African American, 1.3% Native American, 0.8% Asian, 0.1% Pacific Islander, 32.3% from other races, and 4.6% from two or more races. Hispanic or Latino of any race were 57.7% of the population.
There were 3,841 households, out of which 46.2% had children under the age of 18 living with them, 57.2% were married couples living together, 17.2% had a female householder with no husband present, and 18.3% were non-families. 14.2% of all households were made up of individuals, and 6.2% had someone living alone who was 65 years of age or older. The average household size was 3.35 and the average family size was 3.68.
In the city, the population was spread out, with 33.7% under the age of 18, 10.7% from 18 to 24, 28.2% from 25 to 44, 17.7% from 45 to 64, and 9.7% who were 65 years of age or older. The median age was 29 years. For every 100 females, there were 95.2 males. For every 100 females age 18 and over, there were 91.2 males.
The median income for a household in the city was $30,872, and the median income for a family was $32,945. Males had a median income of $27,813 versus $21,813 for females. The per capita income for the city was $11,919. About 22.2% of families and 25.7% of the population were below the poverty line, including 33.2% of those under age 18 and 10.7% of those age 65 or over.
Common Questions
What is Per Capita Income in Arvin?
Per Capita income in Arvin is $14,900.
What is the Median Family Income in Arvin?
Median Family Income in Arvin is $48,254.
What is the Median Household income in Arvin?
Median Household Income in Arvin is $47,997.
What is Income or Wage Gap in Arvin?
Income or Wage Gap in Arvin is 20.9%.
Women in Arvin earn 79.1 cents for every dollar earned by a man.
What is Family Income Deficit in Arvin?
Family Income Deficit in Arvin is $11,572.
Families that are below poverty line in Arvin earn $11,572 less on average than the poverty threshold level.
What is Inequality or Gini Index in Arvin?
Inequality or Gini Index in Arvin is 0.39.
What is the Total Population of Arvin?
Total Population of Arvin is 19,613.
What is the Total Male Population of Arvin?
Total Male Population of Arvin is 10,015.
What is the Total Female Population of Arvin?
Total Female Population of Arvin is 9,598.
What is the Ratio of Males per 100 Females in Arvin?
There are 104.34 Males per 100 Females in Arvin.
What is the Ratio of Females per 100 Males in Arvin?
There are 95.84 Females per 100 Males in Arvin.
What is the Median Population Age in Arvin?
Median Population Age in Arvin is 24.9 Years.
What is the Average Family Size in Arvin
Average Family Size in Arvin is 4.5 People.
What is the Average Household Size in Arvin
Average Household Size in Arvin is 4.4 People.
How Large is the Labor Force in Arvin?
There are 8,172 People in the Labor Forcein in Arvin.
What is the Percentage of People in the Labor Force in Arvin?
61.7% of People are in the Labor Force in Arvin.
What is the Unemployment Rate in Arvin?
Unemployment Rate in Arvin is 11.1%.