Cities with the Highest Percentage of Population with a Degree in Arts and Humanities in Iowa
RELATED REPORTS & OPTIONS
Arts and Humanities
Iowa
Compare Cities
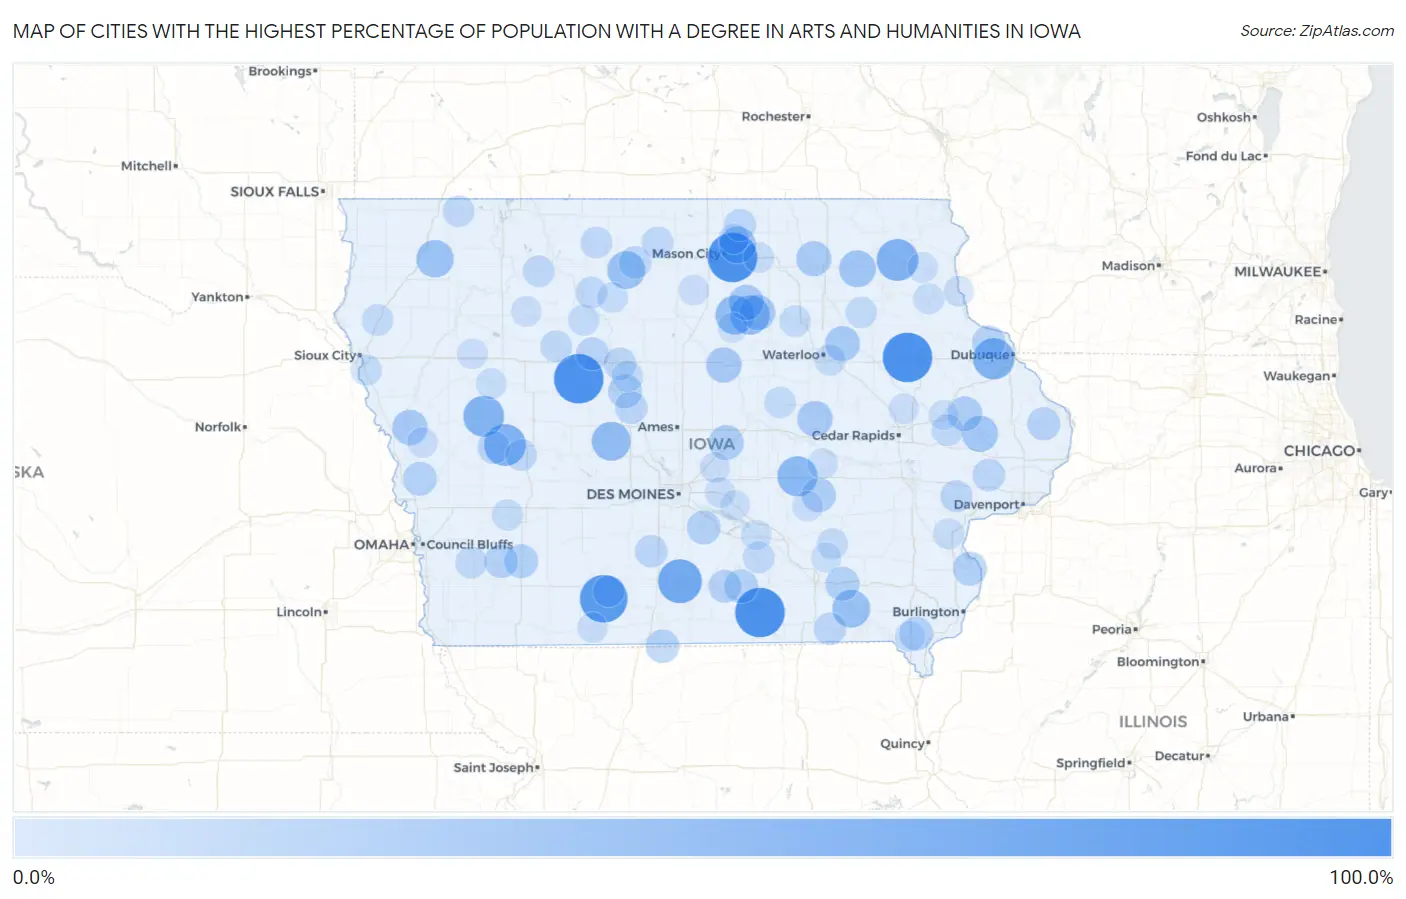
Map of Cities with the Highest Percentage of Population with a Degree in Arts and Humanities in Iowa
0.0%
100.0%
Cities with the Highest Percentage of Population with a Degree in Arts and Humanities in Iowa
| City | % Graduates | vs State | vs National | |
| 1. | Masonville | 100.0% | 6.8%(+93.2)#1 | 6.0%(+94.0)#91 |
| 2. | Trenton | 100.0% | 6.8%(+93.2)#2 | 6.0%(+94.0)#95 |
| 3. | Rinard | 100.0% | 6.8%(+93.2)#3 | 6.0%(+94.0)#105 |
| 4. | Rathbun | 100.0% | 6.8%(+93.2)#4 | 6.0%(+94.0)#117 |
| 5. | Portland | 100.0% | 6.8%(+93.2)#5 | 6.0%(+94.0)#119 |
| 6. | Shannon City | 91.7% | 6.8%(+84.8)#6 | 6.0%(+85.7)#133 |
| 7. | Woodburn | 75.0% | 6.8%(+68.2)#7 | 6.0%(+69.0)#177 |
| 8. | Castalia | 66.7% | 6.8%(+59.8)#8 | 6.0%(+60.7)#219 |
| 9. | Aspinwall | 66.7% | 6.8%(+59.8)#9 | 6.0%(+60.7)#225 |
| 10. | Centralia | 64.7% | 6.8%(+57.9)#10 | 6.0%(+58.7)#229 |
| 11. | Deloit | 63.2% | 6.8%(+56.3)#11 | 6.0%(+57.2)#241 |
| 12. | Malcom | 59.6% | 6.8%(+52.8)#12 | 6.0%(+53.6)#269 |
| 13. | Dumont | 56.1% | 6.8%(+49.3)#13 | 6.0%(+50.1)#292 |
| 14. | Hansell | 55.6% | 6.8%(+48.7)#14 | 6.0%(+49.6)#302 |
| 15. | Rippey | 54.5% | 6.8%(+47.7)#15 | 6.0%(+48.5)#312 |
| 16. | St Benedict | 50.0% | 6.8%(+43.2)#16 | 6.0%(+44.0)#402 |
| 17. | Leando | 50.0% | 6.8%(+43.2)#17 | 6.0%(+44.0)#407 |
| 18. | Archer | 48.0% | 6.8%(+41.2)#18 | 6.0%(+42.0)#422 |
| 19. | Rock Falls | 46.7% | 6.8%(+39.8)#19 | 6.0%(+40.7)#439 |
| 20. | Waucoma | 45.5% | 6.8%(+38.6)#20 | 6.0%(+39.5)#452 |
| 21. | Oxford Junction | 42.9% | 6.8%(+36.0)#21 | 6.0%(+36.9)#489 |
| 22. | Clutier | 40.0% | 6.8%(+33.2)#22 | 6.0%(+34.0)#567 |
| 23. | Bristow | 40.0% | 6.8%(+33.2)#23 | 6.0%(+34.0)#574 |
| 24. | Turin | 40.0% | 6.8%(+33.2)#24 | 6.0%(+34.0)#581 |
| 25. | Aredale | 40.0% | 6.8%(+33.2)#25 | 6.0%(+34.0)#584 |
| 26. | Owasa | 40.0% | 6.8%(+33.2)#26 | 6.0%(+34.0)#589 |
| 27. | Dunkerton | 39.0% | 6.8%(+32.2)#27 | 6.0%(+33.1)#608 |
| 28. | North Washington | 38.9% | 6.8%(+32.1)#28 | 6.0%(+32.9)#616 |
| 29. | Rhodes | 37.5% | 6.8%(+30.7)#29 | 6.0%(+31.5)#657 |
| 30. | Center Junction | 36.4% | 6.8%(+29.5)#30 | 6.0%(+30.4)#703 |
| 31. | Deep River | 35.7% | 6.8%(+28.9)#31 | 6.0%(+29.7)#722 |
| 32. | Batavia | 33.8% | 6.8%(+27.0)#32 | 6.0%(+27.9)#793 |
| 33. | Oakville | 33.3% | 6.8%(+26.5)#33 | 6.0%(+27.3)#836 |
| 34. | Melrose | 33.3% | 6.8%(+26.5)#34 | 6.0%(+27.3)#847 |
| 35. | Magnolia | 33.3% | 6.8%(+26.5)#35 | 6.0%(+27.3)#851 |
| 36. | Franklin | 33.3% | 6.8%(+26.5)#36 | 6.0%(+27.3)#855 |
| 37. | Grant | 33.3% | 6.8%(+26.5)#37 | 6.0%(+27.3)#866 |
| 38. | Sandyville | 33.3% | 6.8%(+26.5)#38 | 6.0%(+27.3)#870 |
| 39. | Dayton | 33.1% | 6.8%(+26.3)#39 | 6.0%(+27.1)#880 |
| 40. | Elliott | 32.6% | 6.8%(+25.8)#40 | 6.0%(+26.6)#895 |
| 41. | Rickardsville | 32.4% | 6.8%(+25.6)#41 | 6.0%(+26.4)#899 |
| 42. | Pleasanton | 31.6% | 6.8%(+24.8)#42 | 6.0%(+25.6)#949 |
| 43. | Preston | 30.8% | 6.8%(+23.9)#43 | 6.0%(+24.8)#993 |
| 44. | Russell | 30.3% | 6.8%(+23.5)#44 | 6.0%(+24.3)#1,028 |
| 45. | Barnum | 30.0% | 6.8%(+23.2)#45 | 6.0%(+24.0)#1,041 |
| 46. | Manilla | 28.6% | 6.8%(+21.7)#46 | 6.0%(+22.6)#1,116 |
| 47. | Truro | 28.6% | 6.8%(+21.7)#47 | 6.0%(+22.6)#1,119 |
| 48. | New Liberty | 28.6% | 6.8%(+21.7)#48 | 6.0%(+22.6)#1,142 |
| 49. | Pilot Mound | 28.6% | 6.8%(+21.7)#49 | 6.0%(+22.6)#1,144 |
| 50. | Coalville | 28.2% | 6.8%(+21.4)#50 | 6.0%(+22.2)#1,176 |
| 51. | Wesley | 27.6% | 6.8%(+20.8)#51 | 6.0%(+21.6)#1,229 |
| 52. | Pulaski | 27.5% | 6.8%(+20.7)#52 | 6.0%(+21.5)#1,235 |
| 53. | Grafton | 26.7% | 6.8%(+19.8)#53 | 6.0%(+20.7)#1,318 |
| 54. | Atalissa | 26.1% | 6.8%(+19.3)#54 | 6.0%(+20.1)#1,365 |
| 55. | Fairport | 25.8% | 6.8%(+19.0)#55 | 6.0%(+19.8)#1,386 |
| 56. | Pomeroy | 25.4% | 6.8%(+18.6)#56 | 6.0%(+19.4)#1,409 |
| 57. | Ocheyedan | 25.0% | 6.8%(+18.2)#57 | 6.0%(+19.0)#1,435 |
| 58. | Crystal Lake | 25.0% | 6.8%(+18.2)#58 | 6.0%(+19.0)#1,456 |
| 59. | Henderson | 25.0% | 6.8%(+18.2)#59 | 6.0%(+19.0)#1,463 |
| 60. | Ayrshire | 25.0% | 6.8%(+18.2)#60 | 6.0%(+19.0)#1,479 |
| 61. | Lone Rock | 25.0% | 6.8%(+18.2)#61 | 6.0%(+19.0)#1,485 |
| 62. | Hamilton | 25.0% | 6.8%(+18.2)#62 | 6.0%(+19.0)#1,496 |
| 63. | Arispe | 25.0% | 6.8%(+18.2)#63 | 6.0%(+19.0)#1,497 |
| 64. | Gray | 25.0% | 6.8%(+18.2)#64 | 6.0%(+19.0)#1,498 |
| 65. | Morley | 25.0% | 6.8%(+18.2)#65 | 6.0%(+19.0)#1,506 |
| 66. | Ottosen | 25.0% | 6.8%(+18.2)#66 | 6.0%(+19.0)#1,513 |
| 67. | Shell Rock | 24.2% | 6.8%(+17.4)#67 | 6.0%(+18.2)#1,557 |
| 68. | Merrill | 24.0% | 6.8%(+17.2)#68 | 6.0%(+18.0)#1,591 |
| 69. | Gladbrook | 23.8% | 6.8%(+17.0)#69 | 6.0%(+17.8)#1,613 |
| 70. | Westgate | 23.5% | 6.8%(+16.7)#70 | 6.0%(+17.5)#1,652 |
| 71. | Gilmore City | 23.1% | 6.8%(+16.3)#71 | 6.0%(+17.1)#1,695 |
| 72. | Lehigh | 23.1% | 6.8%(+16.3)#72 | 6.0%(+17.1)#1,698 |
| 73. | Marne | 23.1% | 6.8%(+16.3)#73 | 6.0%(+17.1)#1,706 |
| 74. | Evansdale | 23.0% | 6.8%(+16.2)#74 | 6.0%(+17.0)#1,712 |
| 75. | Sergeant Bluff | 22.6% | 6.8%(+15.7)#75 | 6.0%(+16.6)#1,767 |
| 76. | Hayesville | 22.2% | 6.8%(+15.4)#76 | 6.0%(+16.2)#1,826 |
| 77. | Elkader | 21.5% | 6.8%(+14.7)#77 | 6.0%(+15.5)#1,925 |
| 78. | Letts | 21.4% | 6.8%(+14.6)#78 | 6.0%(+15.4)#1,937 |
| 79. | Rudd | 21.2% | 6.8%(+14.4)#79 | 6.0%(+15.2)#1,966 |
| 80. | Odebolt | 21.2% | 6.8%(+14.4)#80 | 6.0%(+15.2)#1,973 |
| 81. | Livermore | 21.1% | 6.8%(+14.2)#81 | 6.0%(+15.1)#1,993 |
| 82. | Alburnett | 20.1% | 6.8%(+13.3)#82 | 6.0%(+14.2)#2,124 |
| 83. | Albert City | 20.0% | 6.8%(+13.2)#83 | 6.0%(+14.0)#2,154 |
| 84. | Galva | 20.0% | 6.8%(+13.2)#84 | 6.0%(+14.0)#2,168 |
| 85. | Plymouth | 20.0% | 6.8%(+13.2)#85 | 6.0%(+14.0)#2,172 |
| 86. | Mingo | 20.0% | 6.8%(+13.2)#86 | 6.0%(+14.0)#2,176 |
| 87. | Meservey | 20.0% | 6.8%(+13.2)#87 | 6.0%(+14.0)#2,182 |
| 88. | Moorhead | 20.0% | 6.8%(+13.2)#88 | 6.0%(+14.0)#2,188 |
| 89. | Barnes City | 20.0% | 6.8%(+13.2)#89 | 6.0%(+14.0)#2,209 |
| 90. | Hartwick | 20.0% | 6.8%(+13.2)#90 | 6.0%(+14.0)#2,211 |
| 91. | Clayton | 20.0% | 6.8%(+13.2)#91 | 6.0%(+14.0)#2,217 |
| 92. | Benton | 20.0% | 6.8%(+13.2)#92 | 6.0%(+14.0)#2,219 |
| 93. | Donnellson | 19.9% | 6.8%(+13.1)#93 | 6.0%(+13.9)#2,229 |
| 94. | Prairie City | 19.3% | 6.8%(+12.5)#94 | 6.0%(+13.3)#2,336 |
| 95. | Luana | 19.2% | 6.8%(+12.4)#95 | 6.0%(+13.2)#2,353 |
| 96. | Harvey | 19.2% | 6.8%(+12.4)#96 | 6.0%(+13.2)#2,354 |
| 97. | Anamosa | 19.1% | 6.8%(+12.3)#97 | 6.0%(+13.1)#2,373 |
| 98. | Hedrick | 18.8% | 6.8%(+12.0)#98 | 6.0%(+12.8)#2,434 |
| 99. | Geneva | 18.8% | 6.8%(+11.9)#99 | 6.0%(+12.8)#2,458 |
| 100. | Monroe | 18.5% | 6.8%(+11.7)#100 | 6.0%(+12.5)#2,494 |
Common Questions
What are the Top 10 Cities with the Highest Percentage of Population with a Degree in Arts and Humanities in Iowa?
Top 10 Cities with the Highest Percentage of Population with a Degree in Arts and Humanities in Iowa are:
#1
100.0%
#2
100.0%
#3
100.0%
#4
100.0%
#5
91.7%
#6
75.0%
#7
66.7%
#8
66.7%
#9
64.7%
#10
63.2%
What city has the Highest Percentage of Population with a Degree in Arts and Humanities in Iowa?
Masonville has the Highest Percentage of Population with a Degree in Arts and Humanities in Iowa with 100.0%.
What is the Percentage of Population with a Degree in Arts and Humanities in the State of Iowa?
Percentage of Population with a Degree in Arts and Humanities in Iowa is 6.8%.
What is the Percentage of Population with a Degree in Arts and Humanities in the United States?
Percentage of Population with a Degree in Arts and Humanities in the United States is 6.0%.