Cities with the Highest Percentage of Population with a Degree in Arts and Humanities in Idaho
RELATED REPORTS & OPTIONS
Arts and Humanities
Idaho
Compare Cities
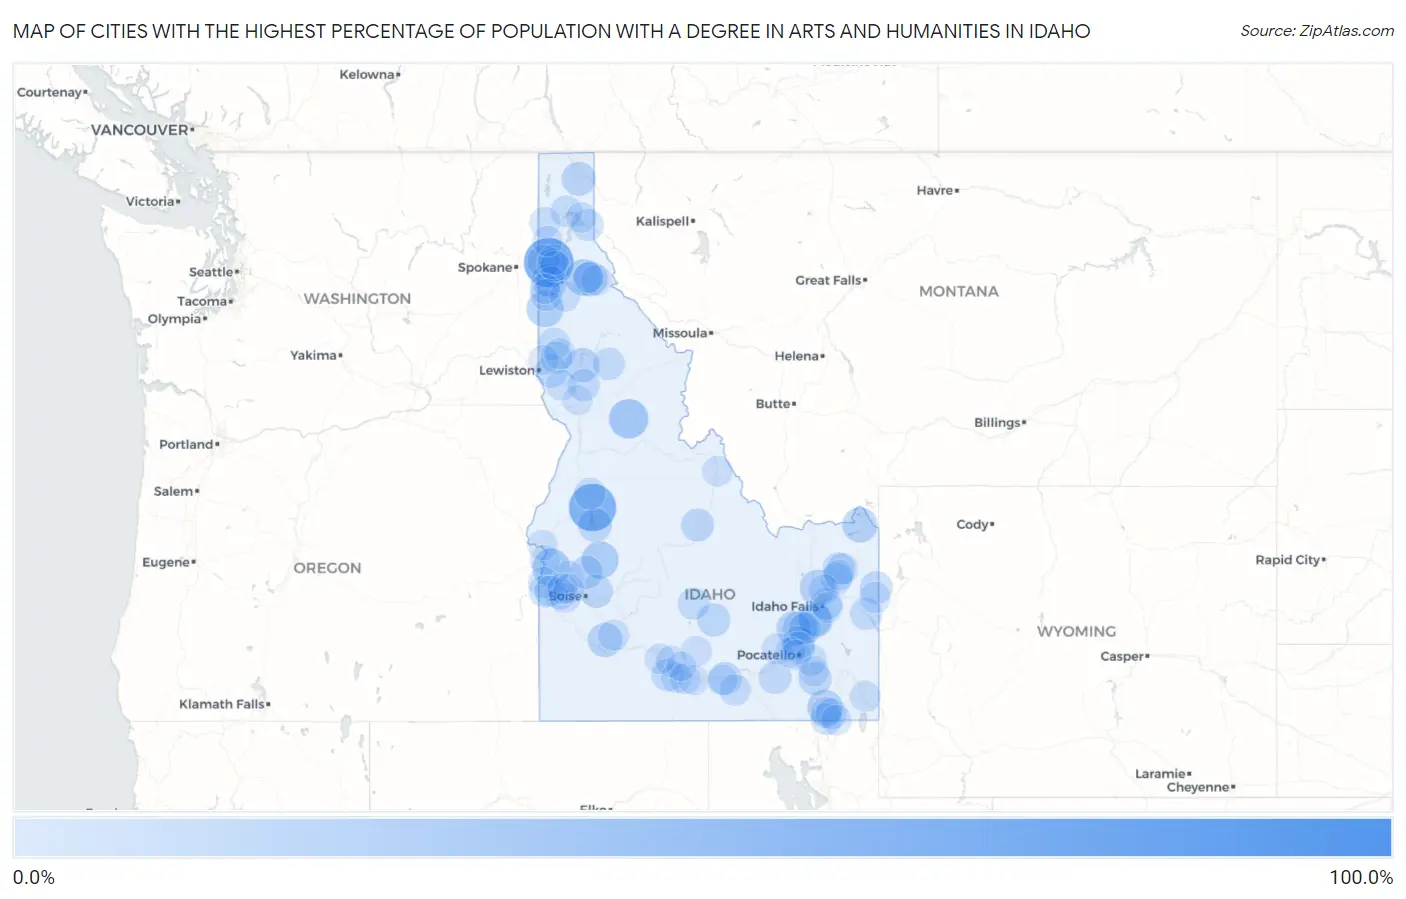
Map of Cities with the Highest Percentage of Population with a Degree in Arts and Humanities in Idaho
0.0%
100.0%
Cities with the Highest Percentage of Population with a Degree in Arts and Humanities in Idaho
| City | % Graduates | vs State | vs National | |
| 1. | Fernwood | 100.0% | 6.9%(+93.1)#1 | 6.0%(+94.0)#63 |
| 2. | Huetter | 66.7% | 6.9%(+59.8)#2 | 6.0%(+60.7)#217 |
| 3. | Donnelly | 60.0% | 6.9%(+53.1)#3 | 6.0%(+54.0)#260 |
| 4. | Elk City | 34.8% | 6.9%(+27.9)#4 | 6.0%(+28.8)#766 |
| 5. | Silverton | 32.4% | 6.9%(+25.5)#5 | 6.0%(+26.4)#903 |
| 6. | New Plymouth | 30.0% | 6.9%(+23.1)#6 | 6.0%(+24.0)#1,034 |
| 7. | Garden Valley | 28.2% | 6.9%(+21.3)#7 | 6.0%(+22.2)#1,177 |
| 8. | Tensed | 27.3% | 6.9%(+20.4)#8 | 6.0%(+21.3)#1,266 |
| 9. | Pinehurst | 26.2% | 6.9%(+19.4)#9 | 6.0%(+20.2)#1,355 |
| 10. | Firth | 23.7% | 6.9%(+16.8)#10 | 6.0%(+17.7)#1,629 |
| 11. | Clifton | 23.2% | 6.9%(+16.3)#11 | 6.0%(+17.2)#1,688 |
| 12. | Roberts | 23.1% | 6.9%(+16.2)#12 | 6.0%(+17.1)#1,696 |
| 13. | Island Park | 21.8% | 6.9%(+15.0)#13 | 6.0%(+15.8)#1,881 |
| 14. | Wardner | 21.6% | 6.9%(+14.7)#14 | 6.0%(+15.6)#1,918 |
| 15. | Riverside | 21.2% | 6.9%(+14.3)#15 | 6.0%(+15.2)#1,972 |
| 16. | Rockford | 20.3% | 6.9%(+13.5)#16 | 6.0%(+14.3)#2,099 |
| 17. | Mountain Home Afb | 20.2% | 6.9%(+13.3)#17 | 6.0%(+14.2)#2,117 |
| 18. | Orofino | 18.9% | 6.9%(+12.1)#18 | 6.0%(+12.9)#2,416 |
| 19. | Bonners Ferry | 18.7% | 6.9%(+11.9)#19 | 6.0%(+12.7)#2,464 |
| 20. | Cascade | 18.2% | 6.9%(+11.4)#20 | 6.0%(+12.2)#2,548 |
| 21. | Carey | 16.7% | 6.9%(+9.81)#21 | 6.0%(+10.7)#2,958 |
| 22. | Arimo | 16.3% | 6.9%(+9.47)#22 | 6.0%(+10.3)#3,119 |
| 23. | Heyburn | 16.2% | 6.9%(+9.36)#23 | 6.0%(+10.2)#3,150 |
| 24. | Robie Creek | 15.9% | 6.9%(+9.00)#24 | 6.0%(+9.86)#3,266 |
| 25. | Horseshoe Bend | 15.8% | 6.9%(+8.89)#25 | 6.0%(+9.76)#3,307 |
| 26. | Challis | 15.4% | 6.9%(+8.58)#26 | 6.0%(+9.45)#3,397 |
| 27. | Fort Hall | 15.3% | 6.9%(+8.48)#27 | 6.0%(+9.34)#3,466 |
| 28. | Rockland | 15.2% | 6.9%(+8.36)#28 | 6.0%(+9.22)#3,516 |
| 29. | Basalt | 15.0% | 6.9%(+8.14)#29 | 6.0%(+9.00)#3,600 |
| 30. | Driggs | 14.9% | 6.9%(+8.03)#30 | 6.0%(+8.89)#3,653 |
| 31. | Lapwai | 14.7% | 6.9%(+7.85)#31 | 6.0%(+8.71)#3,714 |
| 32. | Rockford Bay | 14.7% | 6.9%(+7.83)#32 | 6.0%(+8.69)#3,728 |
| 33. | Blackfoot | 14.6% | 6.9%(+7.75)#33 | 6.0%(+8.62)#3,757 |
| 34. | Post Falls | 14.4% | 6.9%(+7.51)#34 | 6.0%(+8.38)#3,851 |
| 35. | Parker | 14.3% | 6.9%(+7.43)#35 | 6.0%(+8.29)#3,884 |
| 36. | Buhl | 13.9% | 6.9%(+7.04)#36 | 6.0%(+7.90)#4,077 |
| 37. | Pierce | 13.5% | 6.9%(+6.60)#37 | 6.0%(+7.47)#4,282 |
| 38. | Irwin | 13.5% | 6.9%(+6.60)#38 | 6.0%(+7.47)#4,285 |
| 39. | Wilder | 13.3% | 6.9%(+6.47)#39 | 6.0%(+7.34)#4,341 |
| 40. | Lincoln | 13.3% | 6.9%(+6.42)#40 | 6.0%(+7.29)#4,397 |
| 41. | Nezperce | 13.2% | 6.9%(+6.30)#41 | 6.0%(+7.16)#4,471 |
| 42. | Troy | 13.0% | 6.9%(+6.17)#42 | 6.0%(+7.03)#4,550 |
| 43. | Clark Fork | 12.9% | 6.9%(+6.04)#43 | 6.0%(+6.91)#4,617 |
| 44. | Juliaetta | 12.7% | 6.9%(+5.87)#44 | 6.0%(+6.73)#4,716 |
| 45. | Hailey | 12.5% | 6.9%(+5.65)#45 | 6.0%(+6.51)#4,812 |
| 46. | Rexburg | 12.4% | 6.9%(+5.58)#46 | 6.0%(+6.45)#4,909 |
| 47. | Tyhee | 12.1% | 6.9%(+5.24)#47 | 6.0%(+6.10)#5,124 |
| 48. | Harrison | 12.1% | 6.9%(+5.22)#48 | 6.0%(+6.08)#5,139 |
| 49. | Mccall | 11.8% | 6.9%(+4.92)#49 | 6.0%(+5.79)#5,340 |
| 50. | Plummer | 11.6% | 6.9%(+4.72)#50 | 6.0%(+5.58)#5,493 |
| 51. | Weston | 11.3% | 6.9%(+4.46)#51 | 6.0%(+5.33)#5,685 |
| 52. | Ponderay | 11.0% | 6.9%(+4.17)#52 | 6.0%(+5.03)#5,924 |
| 53. | Albion | 10.8% | 6.9%(+3.91)#53 | 6.0%(+4.77)#6,111 |
| 54. | Inkom | 10.7% | 6.9%(+3.85)#54 | 6.0%(+4.72)#6,146 |
| 55. | St Anthony | 10.6% | 6.9%(+3.76)#55 | 6.0%(+4.62)#6,254 |
| 56. | Caldwell | 10.2% | 6.9%(+3.30)#56 | 6.0%(+4.16)#6,695 |
| 57. | Preston | 10.1% | 6.9%(+3.27)#57 | 6.0%(+4.14)#6,717 |
| 58. | Aberdeen | 10.1% | 6.9%(+3.23)#58 | 6.0%(+4.10)#6,756 |
| 59. | Victor | 10.1% | 6.9%(+3.23)#59 | 6.0%(+4.09)#6,762 |
| 60. | Dayton | 10.0% | 6.9%(+3.14)#60 | 6.0%(+4.00)#6,863 |
| 61. | Kendrick | 10.0% | 6.9%(+3.14)#61 | 6.0%(+4.00)#6,877 |
| 62. | Priest River | 9.9% | 6.9%(+3.07)#62 | 6.0%(+3.94)#6,965 |
| 63. | Emmett | 9.8% | 6.9%(+2.99)#63 | 6.0%(+3.85)#7,043 |
| 64. | Parma | 9.8% | 6.9%(+2.97)#64 | 6.0%(+3.83)#7,071 |
| 65. | Mountain Home | 9.7% | 6.9%(+2.82)#65 | 6.0%(+3.68)#7,245 |
| 66. | Wendell | 9.4% | 6.9%(+2.50)#66 | 6.0%(+3.36)#7,588 |
| 67. | Greenleaf | 9.3% | 6.9%(+2.44)#67 | 6.0%(+3.31)#7,666 |
| 68. | Montpelier | 9.2% | 6.9%(+2.31)#68 | 6.0%(+3.17)#7,828 |
| 69. | Osburn | 9.0% | 6.9%(+2.17)#69 | 6.0%(+3.03)#8,015 |
| 70. | Coeur D Alene | 8.9% | 6.9%(+2.01)#70 | 6.0%(+2.88)#8,205 |
| 71. | Dietrich | 8.8% | 6.9%(+1.96)#71 | 6.0%(+2.83)#8,269 |
| 72. | Winchester | 8.8% | 6.9%(+1.96)#72 | 6.0%(+2.83)#8,270 |
| 73. | Filer | 8.6% | 6.9%(+1.78)#73 | 6.0%(+2.65)#8,488 |
| 74. | Nampa | 8.6% | 6.9%(+1.77)#74 | 6.0%(+2.64)#8,510 |
| 75. | Twin Falls | 8.6% | 6.9%(+1.72)#75 | 6.0%(+2.58)#8,579 |
| 76. | Lewisville | 8.6% | 6.9%(+1.71)#76 | 6.0%(+2.58)#8,600 |
| 77. | Salmon | 8.6% | 6.9%(+1.70)#77 | 6.0%(+2.56)#8,617 |
| 78. | Franklin | 8.3% | 6.9%(+1.47)#78 | 6.0%(+2.34)#8,899 |
| 79. | Fernan Lake Village | 8.3% | 6.9%(+1.47)#79 | 6.0%(+2.34)#8,951 |
| 80. | Dalton Gardens | 8.2% | 6.9%(+1.36)#80 | 6.0%(+2.23)#9,075 |
| 81. | St Maries | 8.1% | 6.9%(+1.24)#81 | 6.0%(+2.10)#9,249 |
| 82. | Kellogg | 8.0% | 6.9%(+1.18)#82 | 6.0%(+2.04)#9,330 |
| 83. | Spirit Lake | 8.0% | 6.9%(+1.14)#83 | 6.0%(+2.00)#9,392 |
| 84. | Arbon Valley | 8.0% | 6.9%(+1.14)#84 | 6.0%(+2.00)#9,398 |
| 85. | Middleton | 7.9% | 6.9%(+1.00)#85 | 6.0%(+1.87)#9,603 |
| 86. | Ammon | 7.8% | 6.9%(+0.973)#86 | 6.0%(+1.84)#9,667 |
| 87. | East Hope | 7.8% | 6.9%(+0.966)#87 | 6.0%(+1.83)#9,677 |
| 88. | Hagerman | 7.8% | 6.9%(+0.895)#88 | 6.0%(+1.76)#9,777 |
| 89. | Worley | 7.7% | 6.9%(+0.833)#89 | 6.0%(+1.70)#9,888 |
| 90. | Weiser | 7.6% | 6.9%(+0.721)#90 | 6.0%(+1.58)#10,046 |
| 91. | Pocatello | 7.4% | 6.9%(+0.500)#91 | 6.0%(+1.36)#10,420 |
| 92. | Star | 7.3% | 6.9%(+0.452)#92 | 6.0%(+1.32)#10,509 |
| 93. | Sugar City | 7.3% | 6.9%(+0.409)#93 | 6.0%(+1.27)#10,580 |
| 94. | Hansen | 7.2% | 6.9%(+0.357)#94 | 6.0%(+1.22)#10,667 |
| 95. | Genesee | 7.2% | 6.9%(+0.306)#95 | 6.0%(+1.17)#10,752 |
| 96. | Payette | 7.1% | 6.9%(+0.232)#96 | 6.0%(+1.10)#10,941 |
| 97. | Cottonwood | 7.1% | 6.9%(+0.206)#97 | 6.0%(+1.07)#10,982 |
| 98. | Mccammon | 7.0% | 6.9%(+0.189)#98 | 6.0%(+1.05)#11,019 |
| 99. | Burley | 7.0% | 6.9%(+0.090)#99 | 6.0%(+0.954)#11,186 |
| 100. | Jerome | 6.8% | 6.9%(-0.075)#100 | 6.0%(+0.789)#11,446 |
Common Questions
What are the Top 10 Cities with the Highest Percentage of Population with a Degree in Arts and Humanities in Idaho?
Top 10 Cities with the Highest Percentage of Population with a Degree in Arts and Humanities in Idaho are:
#1
66.7%
#2
60.0%
#3
34.8%
#4
30.0%
#5
28.2%
#6
27.3%
#7
26.2%
#8
23.7%
#9
23.2%
#10
23.1%
What city has the Highest Percentage of Population with a Degree in Arts and Humanities in Idaho?
Huetter has the Highest Percentage of Population with a Degree in Arts and Humanities in Idaho with 66.7%.
What is the Percentage of Population with a Degree in Arts and Humanities in the State of Idaho?
Percentage of Population with a Degree in Arts and Humanities in Idaho is 6.9%.
What is the Percentage of Population with a Degree in Arts and Humanities in the United States?
Percentage of Population with a Degree in Arts and Humanities in the United States is 6.0%.