Cities with the Highest Percentage of Population with a Degree in Arts and Humanities in West Virginia
RELATED REPORTS & OPTIONS
Arts and Humanities
West Virginia
Compare Cities
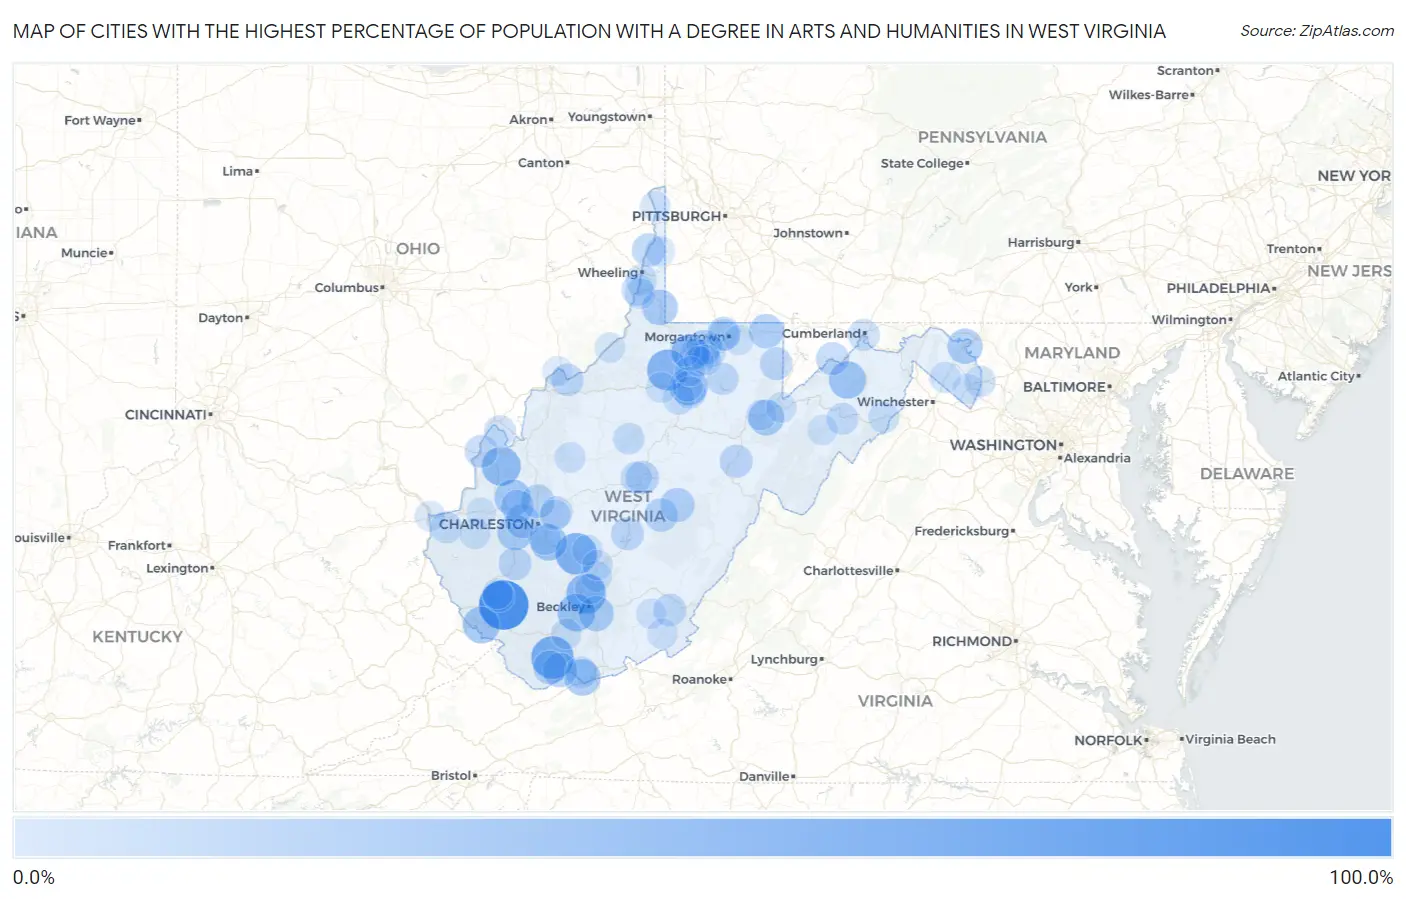
Map of Cities with the Highest Percentage of Population with a Degree in Arts and Humanities in West Virginia
0.0%
100.0%
Cities with the Highest Percentage of Population with a Degree in Arts and Humanities in West Virginia
| City | % Graduates | vs State | vs National | |
| 1. | Neibert | 100.0% | 7.4%(+92.6)#1 | 6.0%(+94.0)#30 |
| 2. | Cottageville | 100.0% | 7.4%(+92.6)#2 | 6.0%(+94.0)#50 |
| 3. | Kimball | 66.7% | 7.4%(+59.3)#3 | 6.0%(+60.7)#207 |
| 4. | Newark | 64.0% | 7.4%(+56.6)#4 | 6.0%(+58.0)#233 |
| 5. | Kimberly | 61.3% | 7.4%(+53.9)#5 | 6.0%(+55.3)#253 |
| 6. | Wallace | 58.3% | 7.4%(+51.0)#6 | 6.0%(+52.3)#275 |
| 7. | Bradley | 53.3% | 7.4%(+46.0)#7 | 6.0%(+47.3)#324 |
| 8. | West Dunbar | 53.0% | 7.4%(+45.7)#8 | 6.0%(+47.0)#330 |
| 9. | Leon | 50.0% | 7.4%(+42.6)#9 | 6.0%(+44.0)#360 |
| 10. | Adrian | 50.0% | 7.4%(+42.6)#10 | 6.0%(+44.0)#387 |
| 11. | Despard | 45.5% | 7.4%(+38.1)#11 | 6.0%(+39.5)#449 |
| 12. | Lester | 43.3% | 7.4%(+36.0)#12 | 6.0%(+37.3)#486 |
| 13. | Burlington | 41.5% | 7.4%(+34.1)#13 | 6.0%(+35.5)#523 |
| 14. | Hinkleville | 41.2% | 7.4%(+33.8)#14 | 6.0%(+35.2)#531 |
| 15. | Crooked Creek | 39.7% | 7.4%(+32.4)#15 | 6.0%(+33.7)#595 |
| 16. | Red Jacket | 39.6% | 7.4%(+32.2)#16 | 6.0%(+33.6)#599 |
| 17. | Rachel | 38.1% | 7.4%(+30.7)#17 | 6.0%(+32.1)#641 |
| 18. | Chesapeake | 37.4% | 7.4%(+30.1)#18 | 6.0%(+31.4)#672 |
| 19. | Brush Fork | 36.9% | 7.4%(+29.5)#19 | 6.0%(+30.9)#680 |
| 20. | Hometown | 36.8% | 7.4%(+29.5)#20 | 6.0%(+30.8)#682 |
| 21. | Hendricks | 35.5% | 7.4%(+28.1)#21 | 6.0%(+29.5)#734 |
| 22. | Clifton | 35.4% | 7.4%(+28.0)#22 | 6.0%(+29.4)#735 |
| 23. | Cameron | 33.9% | 7.4%(+26.5)#23 | 6.0%(+27.9)#792 |
| 24. | Alum Creek | 33.2% | 7.4%(+25.8)#24 | 6.0%(+27.2)#879 |
| 25. | Daniels | 32.2% | 7.4%(+24.8)#25 | 6.0%(+26.2)#913 |
| 26. | Arthurdale | 31.8% | 7.4%(+24.4)#26 | 6.0%(+25.8)#930 |
| 27. | Falling Waters | 31.6% | 7.4%(+24.2)#27 | 6.0%(+25.6)#950 |
| 28. | Grant Town | 30.4% | 7.4%(+23.1)#28 | 6.0%(+24.4)#1,019 |
| 29. | Jefferson | 28.6% | 7.4%(+21.2)#29 | 6.0%(+22.6)#1,118 |
| 30. | Anawalt | 28.6% | 7.4%(+21.2)#30 | 6.0%(+22.6)#1,140 |
| 31. | Brandonville | 28.3% | 7.4%(+21.0)#31 | 6.0%(+22.3)#1,170 |
| 32. | Addison Webster Springs | 27.5% | 7.4%(+20.1)#32 | 6.0%(+21.5)#1,237 |
| 33. | Gary | 25.9% | 7.4%(+18.6)#33 | 6.0%(+19.9)#1,373 |
| 34. | Beech Bottom | 25.0% | 7.4%(+17.6)#34 | 6.0%(+19.0)#1,433 |
| 35. | Cowen | 25.0% | 7.4%(+17.6)#35 | 6.0%(+19.0)#1,434 |
| 36. | Sissonville | 24.4% | 7.4%(+17.0)#36 | 6.0%(+18.4)#1,545 |
| 37. | Granville | 24.4% | 7.4%(+17.0)#37 | 6.0%(+18.4)#1,547 |
| 38. | Sutton | 22.8% | 7.4%(+15.4)#38 | 6.0%(+16.8)#1,738 |
| 39. | Poca | 22.5% | 7.4%(+15.2)#39 | 6.0%(+16.5)#1,775 |
| 40. | Piedmont | 22.2% | 7.4%(+14.9)#40 | 6.0%(+16.2)#1,801 |
| 41. | East Dailey | 22.1% | 7.4%(+14.7)#41 | 6.0%(+16.1)#1,843 |
| 42. | Danville | 21.6% | 7.4%(+14.2)#42 | 6.0%(+15.6)#1,916 |
| 43. | Booth | 21.5% | 7.4%(+14.2)#43 | 6.0%(+15.5)#1,924 |
| 44. | Summersville | 21.4% | 7.4%(+14.1)#44 | 6.0%(+15.4)#1,932 |
| 45. | Point Pleasant | 21.1% | 7.4%(+13.7)#45 | 6.0%(+15.1)#1,985 |
| 46. | Terra Alta | 20.7% | 7.4%(+13.4)#46 | 6.0%(+14.7)#2,037 |
| 47. | Ronceverte | 20.3% | 7.4%(+12.9)#47 | 6.0%(+14.3)#2,103 |
| 48. | Elkview | 20.0% | 7.4%(+12.6)#48 | 6.0%(+14.0)#2,153 |
| 49. | Marmet | 19.7% | 7.4%(+12.4)#49 | 6.0%(+13.7)#2,259 |
| 50. | Waverly | 19.5% | 7.4%(+12.1)#50 | 6.0%(+13.5)#2,294 |
| 51. | Grafton | 18.5% | 7.4%(+11.2)#51 | 6.0%(+12.5)#2,507 |
| 52. | New Haven | 17.4% | 7.4%(+10.1)#52 | 6.0%(+11.5)#2,766 |
| 53. | Bluewell | 17.3% | 7.4%(+9.90)#53 | 6.0%(+11.3)#2,818 |
| 54. | Stonewood | 17.0% | 7.4%(+9.69)#54 | 6.0%(+11.0)#2,876 |
| 55. | Glen Dale | 17.0% | 7.4%(+9.68)#55 | 6.0%(+11.0)#2,877 |
| 56. | Ridgeley | 17.0% | 7.4%(+9.63)#56 | 6.0%(+11.0)#2,886 |
| 57. | Justice Addition | 16.9% | 7.4%(+9.50)#57 | 6.0%(+10.9)#2,914 |
| 58. | Moorefield | 16.8% | 7.4%(+9.41)#58 | 6.0%(+10.8)#2,934 |
| 59. | Rivesville | 16.7% | 7.4%(+9.32)#59 | 6.0%(+10.7)#2,965 |
| 60. | Lavalette | 16.2% | 7.4%(+8.84)#60 | 6.0%(+10.2)#3,158 |
| 61. | West Milford | 15.7% | 7.4%(+8.36)#61 | 6.0%(+9.72)#3,314 |
| 62. | Gassaway | 15.3% | 7.4%(+7.92)#62 | 6.0%(+9.27)#3,493 |
| 63. | Logan | 15.1% | 7.4%(+7.71)#63 | 6.0%(+9.06)#3,574 |
| 64. | Westover | 14.9% | 7.4%(+7.59)#64 | 6.0%(+8.95)#3,632 |
| 65. | Glenville | 14.9% | 7.4%(+7.55)#65 | 6.0%(+8.91)#3,647 |
| 66. | Benwood | 13.8% | 7.4%(+6.48)#66 | 6.0%(+7.83)#4,113 |
| 67. | Bolivar | 13.8% | 7.4%(+6.45)#67 | 6.0%(+7.81)#4,124 |
| 68. | Barrackville | 13.4% | 7.4%(+6.09)#68 | 6.0%(+7.45)#4,290 |
| 69. | Wardensville | 13.3% | 7.4%(+5.98)#69 | 6.0%(+7.34)#4,359 |
| 70. | Oak Hill | 13.3% | 7.4%(+5.91)#70 | 6.0%(+7.27)#4,404 |
| 71. | Inwood | 13.1% | 7.4%(+5.79)#71 | 6.0%(+7.15)#4,481 |
| 72. | Farmington | 12.8% | 7.4%(+5.47)#72 | 6.0%(+6.82)#4,669 |
| 73. | Moundsville | 12.5% | 7.4%(+5.18)#73 | 6.0%(+6.54)#4,804 |
| 74. | Spencer | 12.3% | 7.4%(+4.97)#74 | 6.0%(+6.32)#4,973 |
| 75. | Salem | 12.2% | 7.4%(+4.86)#75 | 6.0%(+6.22)#5,045 |
| 76. | Pinch | 12.1% | 7.4%(+4.78)#76 | 6.0%(+6.13)#5,091 |
| 77. | West Hamlin | 12.0% | 7.4%(+4.65)#77 | 6.0%(+6.00)#5,195 |
| 78. | Mullens | 11.7% | 7.4%(+4.37)#78 | 6.0%(+5.73)#5,406 |
| 79. | Gauley Bridge | 11.5% | 7.4%(+4.19)#79 | 6.0%(+5.54)#5,530 |
| 80. | Union | 11.4% | 7.4%(+4.01)#80 | 6.0%(+5.37)#5,651 |
| 81. | West Logan | 11.1% | 7.4%(+3.76)#81 | 6.0%(+5.12)#5,840 |
| 82. | Fairmont | 11.0% | 7.4%(+3.65)#82 | 6.0%(+5.01)#5,938 |
| 83. | Parsons | 11.0% | 7.4%(+3.62)#83 | 6.0%(+4.97)#5,967 |
| 84. | Mannington | 10.9% | 7.4%(+3.58)#84 | 6.0%(+4.94)#5,991 |
| 85. | Petersburg | 10.9% | 7.4%(+3.54)#85 | 6.0%(+4.89)#6,021 |
| 86. | Kenova | 10.7% | 7.4%(+3.32)#86 | 6.0%(+4.67)#6,201 |
| 87. | Clarksburg | 10.6% | 7.4%(+3.29)#87 | 6.0%(+4.65)#6,225 |
| 88. | Thomas | 10.6% | 7.4%(+3.27)#88 | 6.0%(+4.63)#6,251 |
| 89. | Mount Hope | 10.6% | 7.4%(+3.21)#89 | 6.0%(+4.57)#6,308 |
| 90. | New Cumberland | 10.5% | 7.4%(+3.18)#90 | 6.0%(+4.53)#6,342 |
| 91. | Sistersville | 10.4% | 7.4%(+3.01)#91 | 6.0%(+4.37)#6,492 |
| 92. | Fayetteville | 10.2% | 7.4%(+2.89)#92 | 6.0%(+4.24)#6,608 |
| 93. | Alderson | 9.9% | 7.4%(+2.55)#93 | 6.0%(+3.91)#6,995 |
| 94. | Williamstown | 9.8% | 7.4%(+2.46)#94 | 6.0%(+3.82)#7,080 |
| 95. | Shinnston | 9.7% | 7.4%(+2.35)#95 | 6.0%(+3.70)#7,211 |
| 96. | Monongah | 9.6% | 7.4%(+2.30)#96 | 6.0%(+3.65)#7,266 |
| 97. | Charles Town | 9.5% | 7.4%(+2.16)#97 | 6.0%(+3.51)#7,426 |
| 98. | Milton | 9.2% | 7.4%(+1.89)#98 | 6.0%(+3.24)#7,738 |
| 99. | Bethany | 9.2% | 7.4%(+1.87)#99 | 6.0%(+3.22)#7,764 |
| 100. | Brookhaven | 9.2% | 7.4%(+1.85)#100 | 6.0%(+3.20)#7,787 |
Common Questions
What are the Top 10 Cities with the Highest Percentage of Population with a Degree in Arts and Humanities in West Virginia?
Top 10 Cities with the Highest Percentage of Population with a Degree in Arts and Humanities in West Virginia are:
#1
100.0%
#2
66.7%
#3
61.3%
#4
58.3%
#5
53.3%
#6
50.0%
#7
45.5%
#8
43.3%
#9
41.5%
#10
39.6%
What city has the Highest Percentage of Population with a Degree in Arts and Humanities in West Virginia?
Neibert has the Highest Percentage of Population with a Degree in Arts and Humanities in West Virginia with 100.0%.
What is the Percentage of Population with a Degree in Arts and Humanities in the State of West Virginia?
Percentage of Population with a Degree in Arts and Humanities in West Virginia is 7.4%.
What is the Percentage of Population with a Degree in Arts and Humanities in the United States?
Percentage of Population with a Degree in Arts and Humanities in the United States is 6.0%.