Cities with the Highest Percentage of Population with a Degree in Arts and Humanities in Vermont
RELATED REPORTS & OPTIONS
Arts and Humanities
Vermont
Compare Cities
Map of Cities with the Highest Percentage of Population with a Degree in Arts and Humanities in Vermont
0.0%
100.0%
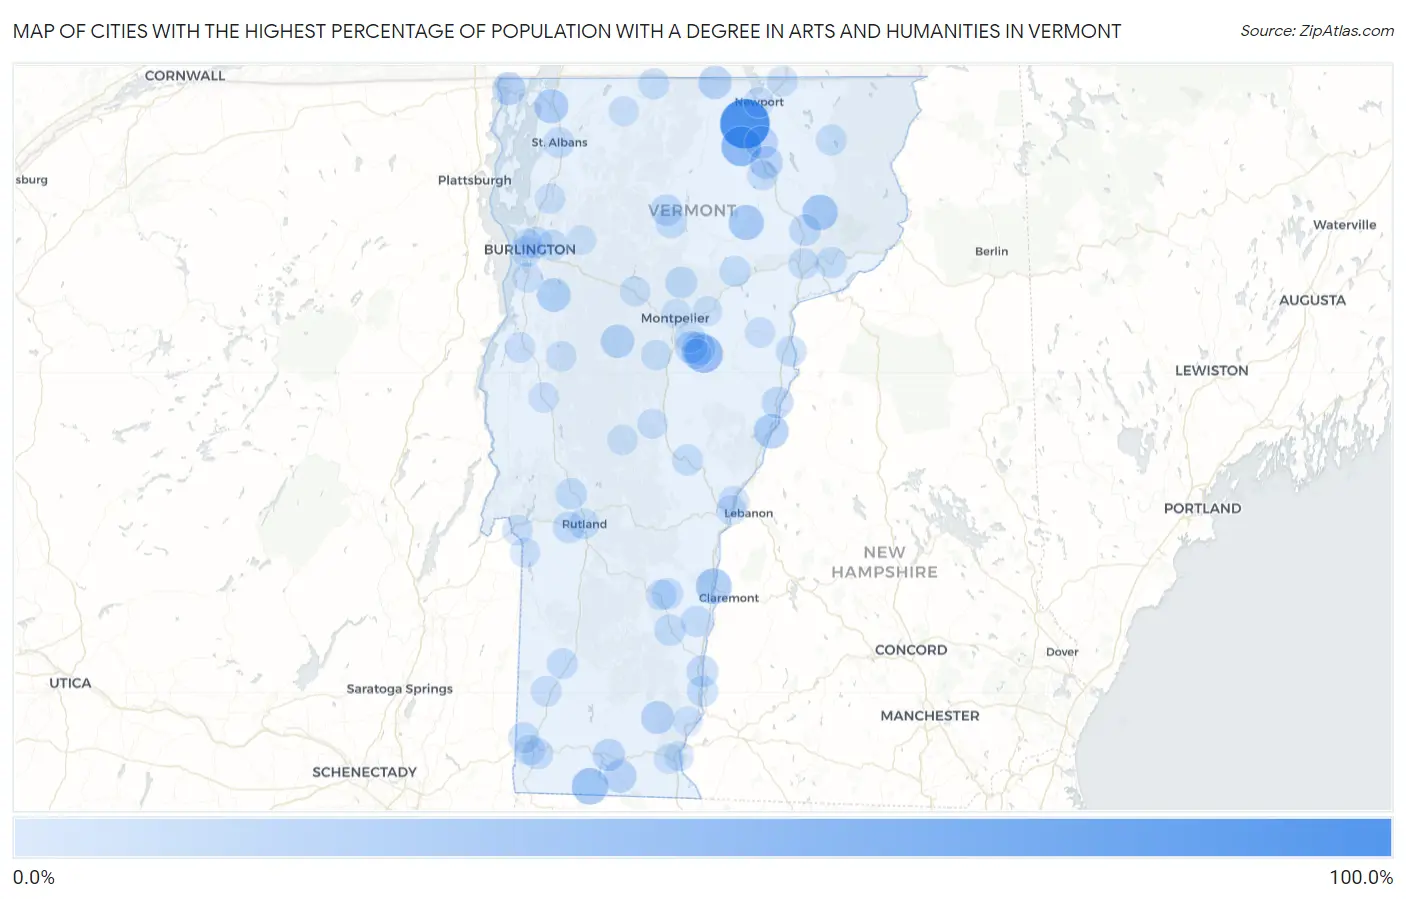
Cities with the Highest Percentage of Population with a Degree in Arts and Humanities in Vermont
| City | % Graduates | vs State | vs National | |
| 1. | Coventry | 100.0% | 5.9%(+94.1)#1 | 6.0%(+94.0)#123 |
| 2. | Irasburg | 50.0% | 5.9%(+44.1)#2 | 6.0%(+44.0)#370 |
| 3. | East Barre | 42.3% | 5.9%(+36.4)#3 | 6.0%(+36.3)#506 |
| 4. | Waterbury Center | 35.8% | 5.9%(+29.9)#4 | 6.0%(+29.8)#714 |
| 5. | Readsboro | 33.3% | 5.9%(+27.4)#5 | 6.0%(+27.3)#828 |
| 6. | Ascutney | 30.0% | 5.9%(+24.1)#6 | 6.0%(+24.0)#1,036 |
| 7. | East Burke | 28.8% | 5.9%(+22.9)#7 | 6.0%(+22.8)#1,112 |
| 8. | Underhill Center | 27.3% | 5.9%(+21.4)#8 | 6.0%(+21.3)#1,268 |
| 9. | Greensboro Bend | 27.1% | 5.9%(+21.2)#9 | 6.0%(+21.1)#1,280 |
| 10. | Lunenburg | 26.8% | 5.9%(+20.9)#10 | 6.0%(+20.8)#1,304 |
| 11. | South Londonderry | 25.4% | 5.9%(+19.5)#11 | 6.0%(+19.4)#1,411 |
| 12. | Bakersfield | 25.0% | 5.9%(+19.1)#12 | 6.0%(+19.0)#1,442 |
| 13. | Fairlee | 24.0% | 5.9%(+18.1)#13 | 6.0%(+18.0)#1,600 |
| 14. | Swanton | 22.9% | 5.9%(+17.0)#14 | 6.0%(+16.9)#1,726 |
| 15. | Harmonyville | 20.6% | 5.9%(+14.7)#15 | 6.0%(+14.6)#2,064 |
| 16. | Hinesburg | 20.1% | 5.9%(+14.2)#16 | 6.0%(+14.1)#2,132 |
| 17. | Gilman | 20.0% | 5.9%(+14.1)#17 | 6.0%(+14.0)#2,192 |
| 18. | Websterville | 19.4% | 5.9%(+13.5)#18 | 6.0%(+13.4)#2,304 |
| 19. | Waitsfield | 19.2% | 5.9%(+13.3)#19 | 6.0%(+13.2)#2,367 |
| 20. | North Troy | 18.2% | 5.9%(+12.3)#20 | 6.0%(+12.2)#2,563 |
| 21. | Danby | 17.8% | 5.9%(+11.9)#21 | 6.0%(+11.8)#2,672 |
| 22. | Alburgh | 17.7% | 5.9%(+11.8)#22 | 6.0%(+11.7)#2,689 |
| 23. | Wolcott | 17.4% | 5.9%(+11.5)#23 | 6.0%(+11.4)#2,786 |
| 24. | Newfane | 17.0% | 5.9%(+11.1)#24 | 6.0%(+11.0)#2,887 |
| 25. | Jacksonville | 16.7% | 5.9%(+10.8)#25 | 6.0%(+10.7)#3,004 |
| 26. | Orleans | 16.5% | 5.9%(+10.5)#26 | 6.0%(+10.5)#3,079 |
| 27. | Barton | 16.2% | 5.9%(+10.3)#27 | 6.0%(+10.2)#3,160 |
| 28. | Sutton | 15.0% | 5.9%(+9.09)#28 | 6.0%(+9.00)#3,611 |
| 29. | Wilmington | 14.7% | 5.9%(+8.76)#29 | 6.0%(+8.67)#3,737 |
| 30. | South Barre | 14.0% | 5.9%(+8.06)#30 | 6.0%(+7.98)#4,048 |
| 31. | Bellows Falls | 11.3% | 5.9%(+5.36)#31 | 6.0%(+5.28)#5,717 |
| 32. | Worcester | 10.8% | 5.9%(+4.90)#32 | 6.0%(+4.82)#6,092 |
| 33. | Hyde Park | 10.7% | 5.9%(+4.76)#33 | 6.0%(+4.67)#6,208 |
| 34. | North Clarendon | 10.6% | 5.9%(+4.73)#34 | 6.0%(+4.64)#6,236 |
| 35. | Bradford | 10.5% | 5.9%(+4.54)#35 | 6.0%(+4.46)#6,431 |
| 36. | Lyndonville | 10.4% | 5.9%(+4.52)#36 | 6.0%(+4.43)#6,448 |
| 37. | Winooski | 10.4% | 5.9%(+4.49)#37 | 6.0%(+4.41)#6,465 |
| 38. | New Haven | 10.3% | 5.9%(+4.35)#38 | 6.0%(+4.26)#6,593 |
| 39. | Morrisville | 10.1% | 5.9%(+4.23)#39 | 6.0%(+4.14)#6,713 |
| 40. | Chester | 10.0% | 5.9%(+4.04)#40 | 6.0%(+3.96)#6,944 |
| 41. | Hartford | 9.7% | 5.9%(+3.82)#41 | 6.0%(+3.74)#7,171 |
| 42. | West Rutland | 9.7% | 5.9%(+3.78)#42 | 6.0%(+3.70)#7,213 |
| 43. | Cavendish | 9.4% | 5.9%(+3.46)#43 | 6.0%(+3.38)#7,576 |
| 44. | Concord | 9.3% | 5.9%(+3.39)#44 | 6.0%(+3.31)#7,674 |
| 45. | Middletown Springs | 9.1% | 5.9%(+3.18)#45 | 6.0%(+3.10)#7,963 |
| 46. | Westminster | 8.9% | 5.9%(+2.98)#46 | 6.0%(+2.89)#8,186 |
| 47. | Pittsford | 8.8% | 5.9%(+2.86)#47 | 6.0%(+2.78)#8,332 |
| 48. | Bolton Valley | 8.7% | 5.9%(+2.84)#48 | 6.0%(+2.75)#8,357 |
| 49. | Springfield | 8.6% | 5.9%(+2.64)#49 | 6.0%(+2.56)#8,635 |
| 50. | Cabot | 8.5% | 5.9%(+2.60)#50 | 6.0%(+2.52)#8,682 |
| 51. | Bennington | 8.2% | 5.9%(+2.33)#51 | 6.0%(+2.24)#9,054 |
| 52. | North Bennington | 8.2% | 5.9%(+2.30)#52 | 6.0%(+2.22)#9,090 |
| 53. | South Royalton | 8.1% | 5.9%(+2.18)#53 | 6.0%(+2.09)#9,263 |
| 54. | Proctor | 7.8% | 5.9%(+1.93)#54 | 6.0%(+1.84)#9,656 |
| 55. | Richford | 7.6% | 5.9%(+1.65)#55 | 6.0%(+1.56)#10,094 |
| 56. | Wells River | 7.5% | 5.9%(+1.59)#56 | 6.0%(+1.50)#10,198 |
| 57. | Manchester | 7.5% | 5.9%(+1.54)#57 | 6.0%(+1.46)#10,263 |
| 58. | St Albans | 7.4% | 5.9%(+1.53)#58 | 6.0%(+1.44)#10,285 |
| 59. | Island Pond | 7.3% | 5.9%(+1.39)#59 | 6.0%(+1.31)#10,523 |
| 60. | Rutland | 7.2% | 5.9%(+1.26)#60 | 6.0%(+1.17)#10,746 |
| 61. | St Johnsbury | 7.0% | 5.9%(+1.05)#61 | 6.0%(+0.968)#11,168 |
| 62. | East Dorset | 6.9% | 5.9%(+0.985)#62 | 6.0%(+0.901)#11,286 |
| 63. | Proctorsville | 6.9% | 5.9%(+0.951)#63 | 6.0%(+0.867)#11,336 |
| 64. | Old Bennington | 6.8% | 5.9%(+0.885)#64 | 6.0%(+0.800)#11,428 |
| 65. | Barre | 6.8% | 5.9%(+0.862)#65 | 6.0%(+0.778)#11,466 |
| 66. | Arlington | 6.5% | 5.9%(+0.622)#66 | 6.0%(+0.538)#11,902 |
| 67. | South Burlington | 6.5% | 5.9%(+0.608)#67 | 6.0%(+0.524)#11,937 |
| 68. | Derby Line | 6.5% | 5.9%(+0.570)#68 | 6.0%(+0.486)#12,004 |
| 69. | Underhill Flats | 6.4% | 5.9%(+0.484)#69 | 6.0%(+0.400)#12,154 |
| 70. | Wilder | 5.9% | 5.9%(-0.032)#70 | 6.0%(-0.117)#13,181 |
| 71. | Killington | 5.8% | 5.9%(-0.072)#71 | 6.0%(-0.156)#13,234 |
| 72. | Glover | 5.8% | 5.9%(-0.114)#72 | 6.0%(-0.199)#13,304 |
| 73. | Essex Junction | 5.7% | 5.9%(-0.259)#73 | 6.0%(-0.343)#13,601 |
| 74. | Fair Haven | 5.5% | 5.9%(-0.373)#74 | 6.0%(-0.457)#13,821 |
| 75. | Northfield | 5.5% | 5.9%(-0.391)#75 | 6.0%(-0.475)#13,855 |
| 76. | Huntington | 5.4% | 5.9%(-0.466)#76 | 6.0%(-0.550)#13,986 |
| 77. | Newport | 5.4% | 5.9%(-0.552)#77 | 6.0%(-0.636)#14,145 |
| 78. | Rochester | 5.2% | 5.9%(-0.694)#78 | 6.0%(-0.778)#14,413 |
| 79. | Middlebury | 5.0% | 5.9%(-0.879)#79 | 6.0%(-0.963)#14,777 |
| 80. | Groton | 5.0% | 5.9%(-0.911)#80 | 6.0%(-0.996)#14,821 |
| 81. | Bristol | 5.0% | 5.9%(-0.957)#81 | 6.0%(-1.04)#14,908 |
| 82. | Milton | 4.9% | 5.9%(-1.00)#82 | 6.0%(-1.09)#15,008 |
| 83. | Stamford | 4.9% | 5.9%(-1.02)#83 | 6.0%(-1.10)#15,033 |
| 84. | Randolph | 4.7% | 5.9%(-1.19)#84 | 6.0%(-1.28)#15,363 |
| 85. | Lincoln | 4.6% | 5.9%(-1.31)#85 | 6.0%(-1.40)#15,609 |
| 86. | Waterbury | 4.5% | 5.9%(-1.43)#86 | 6.0%(-1.51)#15,816 |
| 87. | St. George | 4.4% | 5.9%(-1.47)#87 | 6.0%(-1.55)#15,901 |
| 88. | Vergennes | 4.3% | 5.9%(-1.56)#88 | 6.0%(-1.65)#16,077 |
| 89. | Graniteville | 4.3% | 5.9%(-1.56)#89 | 6.0%(-1.65)#16,109 |
| 90. | White River Junction | 4.3% | 5.9%(-1.60)#90 | 6.0%(-1.69)#16,178 |
| 91. | Burlington | 4.0% | 5.9%(-1.87)#91 | 6.0%(-1.95)#16,688 |
| 92. | Enosburg Falls | 4.0% | 5.9%(-1.91)#92 | 6.0%(-2.00)#16,752 |
| 93. | West Brattleboro | 3.6% | 5.9%(-2.27)#93 | 6.0%(-2.36)#17,381 |
| 94. | Shelburne | 3.5% | 5.9%(-2.40)#94 | 6.0%(-2.49)#17,635 |
| 95. | Putney | 3.5% | 5.9%(-2.41)#95 | 6.0%(-2.50)#17,659 |
| 96. | Plainfield | 3.3% | 5.9%(-2.61)#96 | 6.0%(-2.70)#17,985 |
| 97. | Brattleboro | 3.2% | 5.9%(-2.67)#97 | 6.0%(-2.75)#18,086 |
| 98. | Poultney | 3.1% | 5.9%(-2.81)#98 | 6.0%(-2.89)#18,339 |
| 99. | Montpelier | 3.1% | 5.9%(-2.81)#99 | 6.0%(-2.89)#18,341 |
| 100. | Jericho | 3.0% | 5.9%(-2.92)#100 | 6.0%(-3.01)#18,529 |
1
2Common Questions
What are the Top 10 Cities with the Highest Percentage of Population with a Degree in Arts and Humanities in Vermont?
Top 10 Cities with the Highest Percentage of Population with a Degree in Arts and Humanities in Vermont are:
#1
100.0%
#2
50.0%
#3
42.3%
#4
33.3%
#5
30.0%
#6
28.8%
#7
27.1%
#8
24.0%
#9
22.9%
#10
20.1%
What city has the Highest Percentage of Population with a Degree in Arts and Humanities in Vermont?
Coventry has the Highest Percentage of Population with a Degree in Arts and Humanities in Vermont with 100.0%.
What is the Percentage of Population with a Degree in Arts and Humanities in the State of Vermont?
Percentage of Population with a Degree in Arts and Humanities in Vermont is 5.9%.
What is the Percentage of Population with a Degree in Arts and Humanities in the United States?
Percentage of Population with a Degree in Arts and Humanities in the United States is 6.0%.