Cities with the Highest Percentage of Population with a Degree in Arts and Humanities in Delaware
RELATED REPORTS & OPTIONS
Arts and Humanities
Delaware
Compare Cities
Map of Cities with the Highest Percentage of Population with a Degree in Arts and Humanities in Delaware
0.0%
40.0%
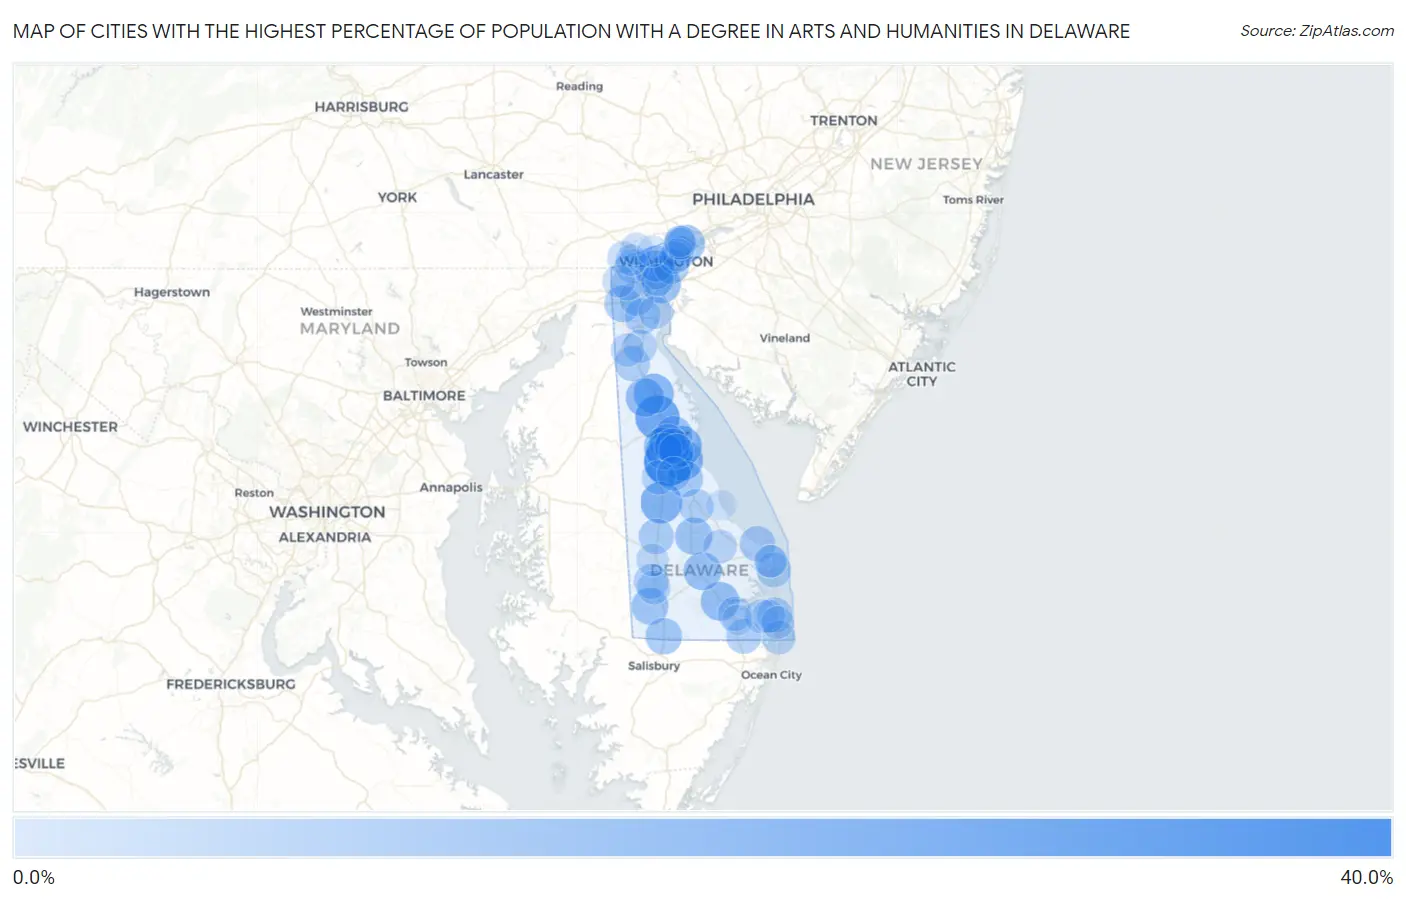
Cities with the Highest Percentage of Population with a Degree in Arts and Humanities in Delaware
| City | % Graduates | vs State | vs National | |
| 1. | Woodside East | 30.6% | 6.8%(+23.8)#1 | 6.0%(+24.6)#1,010 |
| 2. | Cheswold | 21.9% | 6.8%(+15.1)#2 | 6.0%(+15.9)#1,864 |
| 3. | Harrington | 17.9% | 6.8%(+11.1)#3 | 6.0%(+11.9)#2,636 |
| 4. | Magnolia | 17.2% | 6.8%(+10.4)#4 | 6.0%(+11.2)#2,829 |
| 5. | Dover Base Housing | 16.9% | 6.8%(+10.1)#5 | 6.0%(+10.9)#2,900 |
| 6. | Smyrna | 15.6% | 6.8%(+8.79)#6 | 6.0%(+9.60)#3,354 |
| 7. | New Castle | 14.3% | 6.8%(+7.45)#7 | 6.0%(+8.26)#3,960 |
| 8. | Newport | 13.4% | 6.8%(+6.61)#8 | 6.0%(+7.42)#4,300 |
| 9. | Millsboro | 13.2% | 6.8%(+6.36)#9 | 6.0%(+7.16)#4,463 |
| 10. | Clayton | 13.1% | 6.8%(+6.31)#10 | 6.0%(+7.11)#4,497 |
| 11. | Georgetown | 12.0% | 6.8%(+5.20)#11 | 6.0%(+6.01)#5,186 |
| 12. | Dover | 11.6% | 6.8%(+4.80)#12 | 6.0%(+5.61)#5,476 |
| 13. | Claymont | 11.5% | 6.8%(+4.70)#13 | 6.0%(+5.51)#5,556 |
| 14. | Wyoming | 11.4% | 6.8%(+4.61)#14 | 6.0%(+5.42)#5,618 |
| 15. | Ellendale | 11.1% | 6.8%(+4.31)#15 | 6.0%(+5.12)#5,827 |
| 16. | Rodney Village | 10.8% | 6.8%(+4.04)#16 | 6.0%(+4.85)#6,056 |
| 17. | Bethel | 10.6% | 6.8%(+3.77)#17 | 6.0%(+4.58)#6,293 |
| 18. | Camden | 10.2% | 6.8%(+3.37)#18 | 6.0%(+4.18)#6,678 |
| 19. | Delmar | 9.8% | 6.8%(+3.04)#19 | 6.0%(+3.85)#7,042 |
| 20. | Glasgow | 9.4% | 6.8%(+2.57)#20 | 6.0%(+3.38)#7,581 |
| 21. | Elsmere | 9.3% | 6.8%(+2.54)#21 | 6.0%(+3.35)#7,623 |
| 22. | Frederica | 9.0% | 6.8%(+2.19)#22 | 6.0%(+2.99)#8,057 |
| 23. | Highland Acres | 8.5% | 6.8%(+1.70)#23 | 6.0%(+2.51)#8,687 |
| 24. | St Georges | 8.4% | 6.8%(+1.62)#24 | 6.0%(+2.43)#8,791 |
| 25. | Lewes | 8.4% | 6.8%(+1.58)#25 | 6.0%(+2.39)#8,836 |
| 26. | Greenwood | 8.0% | 6.8%(+1.22)#26 | 6.0%(+2.03)#9,360 |
| 27. | Wilmington | 7.9% | 6.8%(+1.10)#27 | 6.0%(+1.90)#9,545 |
| 28. | Townsend | 7.5% | 6.8%(+0.678)#28 | 6.0%(+1.48)#10,220 |
| 29. | Bethany Beach | 7.5% | 6.8%(+0.672)#29 | 6.0%(+1.48)#10,231 |
| 30. | Selbyville | 7.4% | 6.8%(+0.621)#30 | 6.0%(+1.43)#10,304 |
| 31. | Seaford | 7.3% | 6.8%(+0.480)#31 | 6.0%(+1.29)#10,555 |
| 32. | Dewey Beach | 7.3% | 6.8%(+0.462)#32 | 6.0%(+1.27)#10,587 |
| 33. | Rising Sun Lebanon | 7.2% | 6.8%(+0.350)#33 | 6.0%(+1.16)#10,775 |
| 34. | Milford | 6.9% | 6.8%(+0.115)#34 | 6.0%(+0.922)#11,241 |
| 35. | Dagsboro | 6.5% | 6.8%(-0.261)#35 | 6.0%(+0.546)#11,887 |
| 36. | Bear | 6.1% | 6.8%(-0.664)#36 | 6.0%(+0.143)#12,665 |
| 37. | Felton | 6.1% | 6.8%(-0.716)#37 | 6.0%(+0.091)#12,770 |
| 38. | Pike Creek Valley | 6.1% | 6.8%(-0.717)#38 | 6.0%(+0.090)#12,773 |
| 39. | Riverview | 5.8% | 6.8%(-0.998)#39 | 6.0%(-0.190)#13,286 |
| 40. | Millville | 5.7% | 6.8%(-1.15)#40 | 6.0%(-0.339)#13,595 |
| 41. | Fenwick Island | 5.6% | 6.8%(-1.20)#41 | 6.0%(-0.388)#13,680 |
| 42. | Blades | 5.5% | 6.8%(-1.35)#42 | 6.0%(-0.541)#13,962 |
| 43. | Odessa | 5.3% | 6.8%(-1.46)#43 | 6.0%(-0.652)#14,175 |
| 44. | Milton | 5.2% | 6.8%(-1.62)#44 | 6.0%(-0.808)#14,475 |
| 45. | Brookside | 5.0% | 6.8%(-1.80)#45 | 6.0%(-0.994)#14,809 |
| 46. | Middletown | 4.9% | 6.8%(-1.90)#46 | 6.0%(-1.10)#15,026 |
| 47. | Ocean View | 4.7% | 6.8%(-2.07)#47 | 6.0%(-1.27)#15,351 |
| 48. | Ardentown | 4.6% | 6.8%(-2.17)#48 | 6.0%(-1.36)#15,530 |
| 49. | Delaware City | 4.3% | 6.8%(-2.51)#49 | 6.0%(-1.70)#16,192 |
| 50. | Bellefonte | 4.2% | 6.8%(-2.60)#50 | 6.0%(-1.80)#16,378 |
| 51. | North Star | 4.2% | 6.8%(-2.64)#51 | 6.0%(-1.83)#16,472 |
| 52. | South Bethany | 4.1% | 6.8%(-2.66)#52 | 6.0%(-1.85)#16,509 |
| 53. | Rehoboth Beach | 4.1% | 6.8%(-2.67)#53 | 6.0%(-1.87)#16,541 |
| 54. | Edgemoor | 3.9% | 6.8%(-2.91)#54 | 6.0%(-2.10)#16,941 |
| 55. | Newark | 3.9% | 6.8%(-2.93)#55 | 6.0%(-2.12)#16,971 |
| 56. | Bridgeville | 3.8% | 6.8%(-3.00)#56 | 6.0%(-2.19)#17,115 |
| 57. | Henlopen Acres | 3.7% | 6.8%(-3.05)#57 | 6.0%(-2.25)#17,207 |
| 58. | Wilmington Manor | 3.7% | 6.8%(-3.11)#58 | 6.0%(-2.30)#17,317 |
| 59. | Hockessin | 3.3% | 6.8%(-3.51)#59 | 6.0%(-2.71)#17,996 |
| 60. | Ardencroft | 2.8% | 6.8%(-4.05)#60 | 6.0%(-3.24)#18,888 |
| 61. | Pike Creek | 2.4% | 6.8%(-4.42)#61 | 6.0%(-3.61)#19,442 |
| 62. | Arden | 2.0% | 6.8%(-4.81)#62 | 6.0%(-4.01)#19,940 |
| 63. | Greenville | 1.7% | 6.8%(-5.14)#63 | 6.0%(-4.33)#20,312 |
| 64. | Frankford | 1.0% | 6.8%(-5.76)#64 | 6.0%(-4.95)#20,792 |
| 65. | Slaughter Beach | 0.56% | 6.8%(-6.24)#65 | 6.0%(-5.43)#21,000 |
1
Common Questions
What are the Top 10 Cities with the Highest Percentage of Population with a Degree in Arts and Humanities in Delaware?
Top 10 Cities with the Highest Percentage of Population with a Degree in Arts and Humanities in Delaware are:
#1
30.6%
#2
21.9%
#3
17.9%
#4
17.2%
#5
16.9%
#6
15.6%
#7
14.3%
#8
13.4%
#9
13.2%
#10
13.1%
What city has the Highest Percentage of Population with a Degree in Arts and Humanities in Delaware?
Woodside East has the Highest Percentage of Population with a Degree in Arts and Humanities in Delaware with 30.6%.
What is the Percentage of Population with a Degree in Arts and Humanities in the State of Delaware?
Percentage of Population with a Degree in Arts and Humanities in Delaware is 6.8%.
What is the Percentage of Population with a Degree in Arts and Humanities in the United States?
Percentage of Population with a Degree in Arts and Humanities in the United States is 6.0%.