Zip Codes with the Highest Percentage of Population with a Degree in Arts and Humanities in Chino, CA
RELATED REPORTS & OPTIONS
Arts and Humanities
Chino
Compare Zip Codes
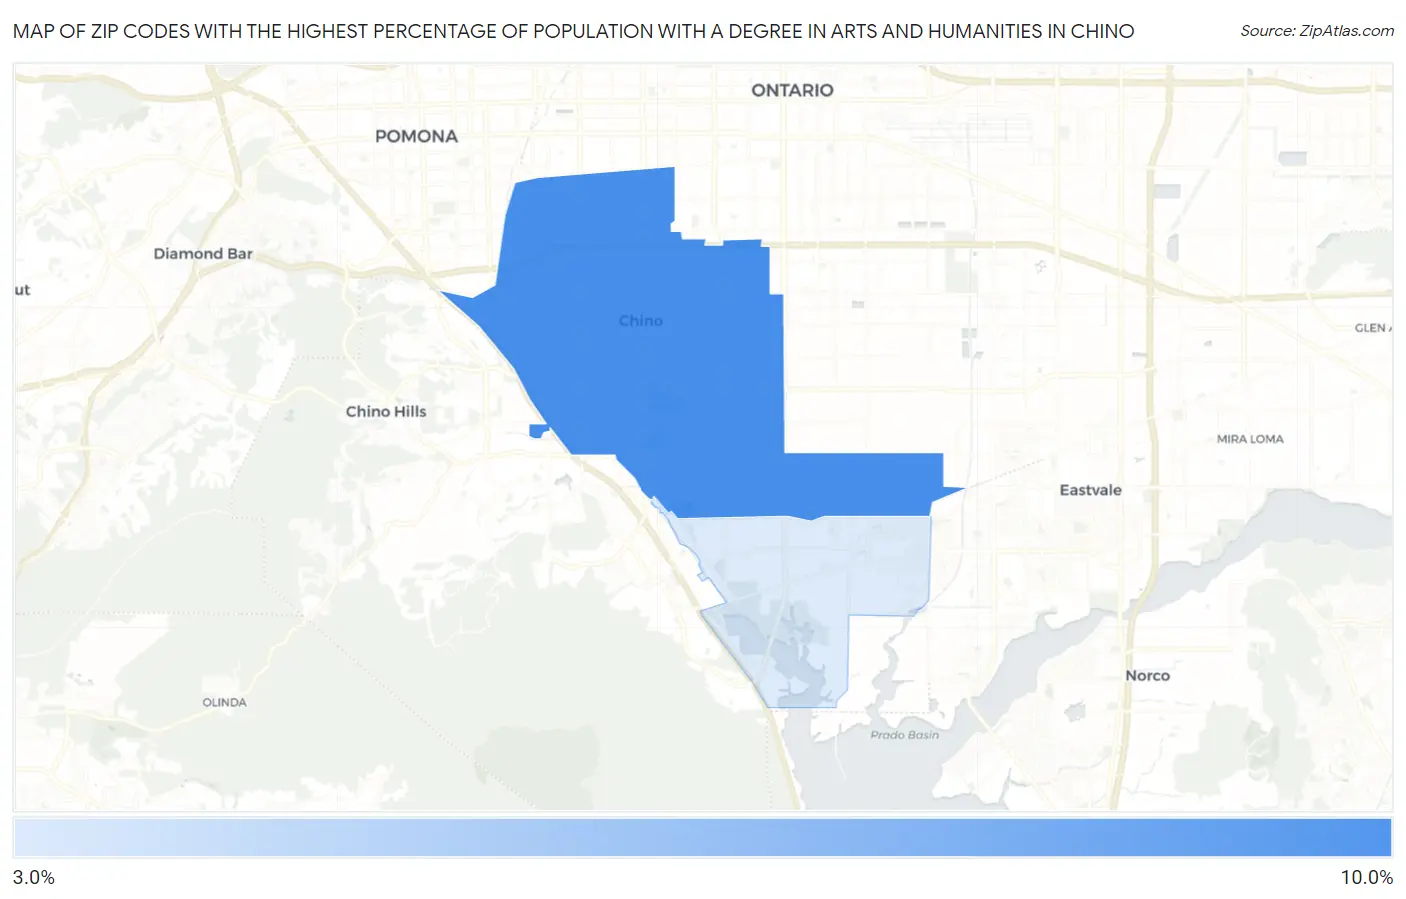
Map of Zip Codes with the Highest Percentage of Population with a Degree in Arts and Humanities in Chino
3.9%
9.1%
Zip Codes with the Highest Percentage of Population with a Degree in Arts and Humanities in Chino, CA
| Zip Code | % Graduates | vs State | vs National | |
| 1. | 91710 | 9.1% | 5.4%(+3.73)#345 | 6.0%(+3.11)#7,542 |
| 2. | 91708 | 3.9% | 5.4%(-1.51)#1,082 | 6.0%(-2.14)#20,690 |
1
Common Questions
What are the Top Zip Codes with the Highest Percentage of Population with a Degree in Arts and Humanities in Chino, CA?
Top Zip Codes with the Highest Percentage of Population with a Degree in Arts and Humanities in Chino, CA are:
What zip code has the Highest Percentage of Population with a Degree in Arts and Humanities in Chino, CA?
91710 has the Highest Percentage of Population with a Degree in Arts and Humanities in Chino, CA with 9.1%.
What is the Percentage of Population with a Degree in Arts and Humanities in Chino, CA?
Percentage of Population with a Degree in Arts and Humanities in Chino is 7.9%.
What is the Percentage of Population with a Degree in Arts and Humanities in California?
Percentage of Population with a Degree in Arts and Humanities in California is 5.4%.
What is the Percentage of Population with a Degree in Arts and Humanities in the United States?
Percentage of Population with a Degree in Arts and Humanities in the United States is 6.0%.