Zip Codes with the Highest Percentage of Population with a Degree in Arts and Humanities in Los Angeles, CA
RELATED REPORTS & OPTIONS
Arts and Humanities
Los Angeles
Compare Zip Codes
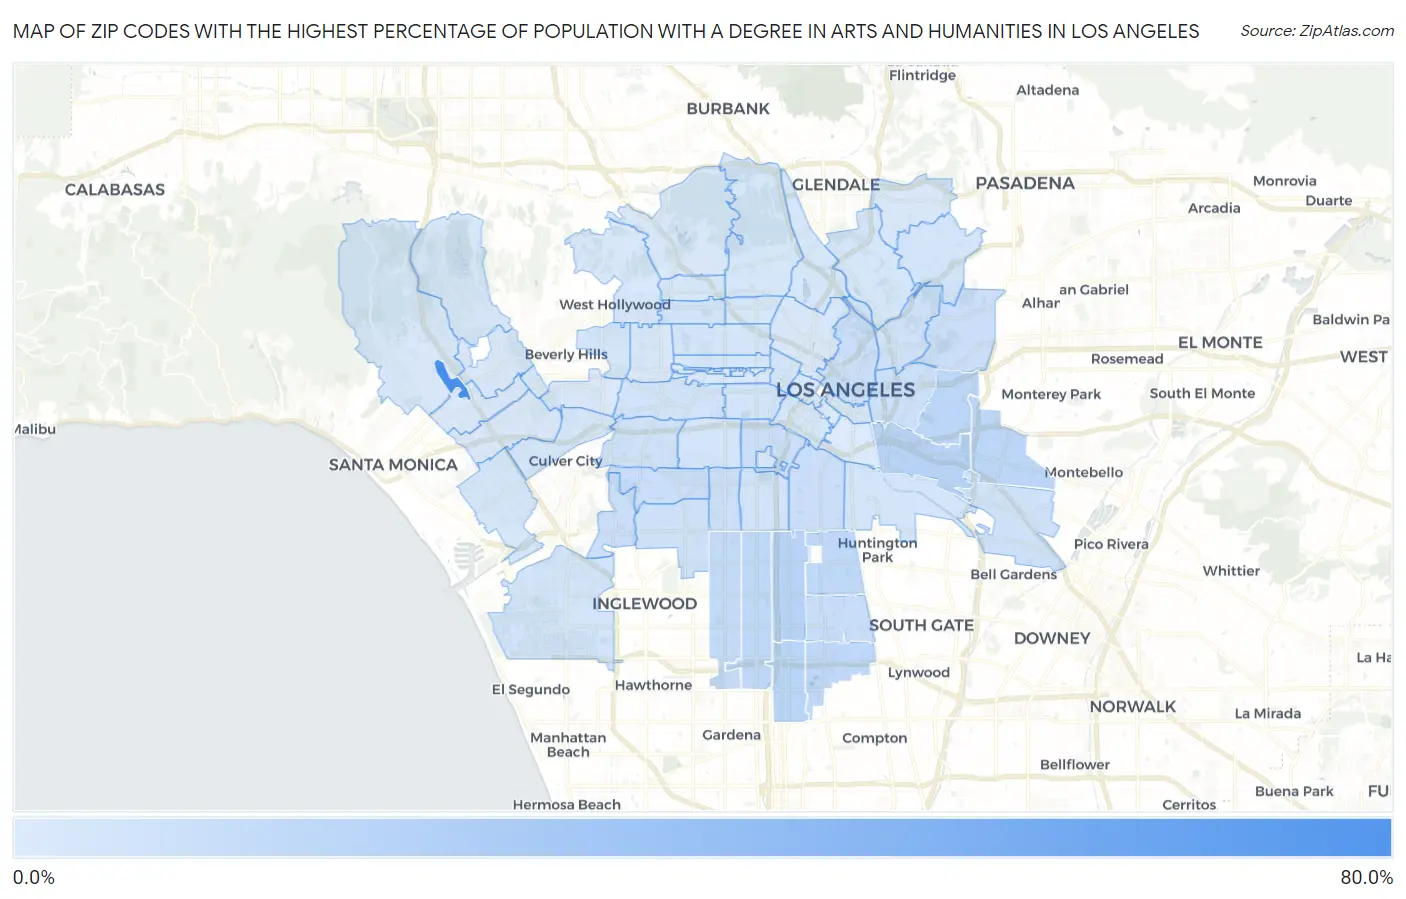
Map of Zip Codes with the Highest Percentage of Population with a Degree in Arts and Humanities in Los Angeles
0.76%
73.8%
Zip Codes with the Highest Percentage of Population with a Degree in Arts and Humanities in Los Angeles, CA
| Zip Code | % Graduates | vs State | vs National | |
| 1. | 90073 | 73.8% | 5.4%(+68.5)#6 | 6.0%(+67.9)#113 |
| 2. | 90003 | 15.4% | 5.4%(+10.1)#88 | 6.0%(+9.43)#2,521 |
| 3. | 90023 | 15.1% | 5.4%(+9.68)#97 | 6.0%(+9.06)#2,654 |
| 4. | 90061 | 14.6% | 5.4%(+9.25)#102 | 6.0%(+8.63)#2,825 |
| 5. | 90063 | 13.6% | 5.4%(+8.26)#121 | 6.0%(+7.64)#3,308 |
| 6. | 90022 | 13.0% | 5.4%(+7.61)#140 | 6.0%(+6.99)#3,651 |
| 7. | 90044 | 12.5% | 5.4%(+7.10)#157 | 6.0%(+6.48)#4,007 |
| 8. | 90059 | 12.5% | 5.4%(+7.10)#158 | 6.0%(+6.47)#4,011 |
| 9. | 90001 | 12.3% | 5.4%(+6.88)#167 | 6.0%(+6.26)#4,142 |
| 10. | 90047 | 10.9% | 5.4%(+5.53)#223 | 6.0%(+4.91)#5,229 |
| 11. | 90002 | 9.1% | 5.4%(+3.72)#349 | 6.0%(+3.09)#7,617 |
| 12. | 90007 | 7.9% | 5.4%(+2.54)#462 | 6.0%(+1.92)#9,828 |
| 13. | 90011 | 7.8% | 5.4%(+2.43)#474 | 6.0%(+1.81)#10,056 |
| 14. | 90012 | 7.8% | 5.4%(+2.41)#478 | 6.0%(+1.79)#10,101 |
| 15. | 90008 | 7.8% | 5.4%(+2.41)#479 | 6.0%(+1.78)#10,109 |
| 16. | 90032 | 7.6% | 5.4%(+2.21)#503 | 6.0%(+1.58)#10,537 |
| 17. | 90056 | 7.4% | 5.4%(+2.07)#520 | 6.0%(+1.45)#10,852 |
| 18. | 90033 | 6.9% | 5.4%(+1.51)#604 | 6.0%(+0.883)#12,272 |
| 19. | 90062 | 6.8% | 5.4%(+1.40)#617 | 6.0%(+0.776)#12,566 |
| 20. | 90016 | 6.3% | 5.4%(+0.948)#681 | 6.0%(+0.324)#13,752 |
| 21. | 90031 | 6.2% | 5.4%(+0.816)#699 | 6.0%(+0.192)#14,134 |
| 22. | 90043 | 6.1% | 5.4%(+0.737)#716 | 6.0%(+0.113)#14,370 |
| 23. | 90040 | 5.9% | 5.4%(+0.578)#743 | 6.0%(-0.046)#14,812 |
| 24. | 90038 | 5.2% | 5.4%(-0.171)#872 | 6.0%(-0.795)#17,008 |
| 25. | 90019 | 5.0% | 5.4%(-0.366)#900 | 6.0%(-0.990)#17,567 |
| 26. | 90037 | 4.9% | 5.4%(-0.424)#912 | 6.0%(-1.05)#17,771 |
| 27. | 90006 | 4.8% | 5.4%(-0.607)#944 | 6.0%(-1.23)#18,267 |
| 28. | 90004 | 4.6% | 5.4%(-0.746)#967 | 6.0%(-1.37)#18,683 |
| 29. | 90058 | 4.6% | 5.4%(-0.798)#971 | 6.0%(-1.42)#18,801 |
| 30. | 90018 | 4.5% | 5.4%(-0.849)#982 | 6.0%(-1.47)#18,942 |
| 31. | 90045 | 4.5% | 5.4%(-0.892)#989 | 6.0%(-1.52)#19,053 |
| 32. | 90048 | 4.4% | 5.4%(-1.00)#1,003 | 6.0%(-1.63)#19,376 |
| 33. | 90042 | 4.1% | 5.4%(-1.30)#1,043 | 6.0%(-1.92)#20,141 |
| 34. | 90057 | 3.8% | 5.4%(-1.55)#1,088 | 6.0%(-2.18)#20,803 |
| 35. | 90067 | 3.5% | 5.4%(-1.88)#1,140 | 6.0%(-2.50)#21,611 |
| 36. | 90013 | 3.3% | 5.4%(-2.04)#1,174 | 6.0%(-2.66)#21,978 |
| 37. | 90089 | 3.3% | 5.4%(-2.07)#1,178 | 6.0%(-2.69)#22,043 |
| 38. | 90065 | 3.3% | 5.4%(-2.08)#1,181 | 6.0%(-2.70)#22,069 |
| 39. | 90029 | 3.2% | 5.4%(-2.12)#1,188 | 6.0%(-2.75)#22,149 |
| 40. | 90015 | 3.2% | 5.4%(-2.17)#1,195 | 6.0%(-2.79)#22,253 |
| 41. | 90066 | 3.1% | 5.4%(-2.23)#1,201 | 6.0%(-2.85)#22,393 |
| 42. | 90039 | 3.1% | 5.4%(-2.31)#1,209 | 6.0%(-2.93)#22,544 |
| 43. | 90034 | 3.1% | 5.4%(-2.32)#1,210 | 6.0%(-2.94)#22,555 |
| 44. | 90020 | 3.0% | 5.4%(-2.36)#1,217 | 6.0%(-2.99)#22,662 |
| 45. | 90027 | 2.9% | 5.4%(-2.46)#1,235 | 6.0%(-3.08)#22,844 |
| 46. | 90028 | 2.9% | 5.4%(-2.47)#1,236 | 6.0%(-3.09)#22,858 |
| 47. | 90036 | 2.9% | 5.4%(-2.50)#1,249 | 6.0%(-3.13)#22,922 |
| 48. | 90077 | 2.8% | 5.4%(-2.59)#1,260 | 6.0%(-3.21)#23,069 |
| 49. | 90017 | 2.5% | 5.4%(-2.83)#1,291 | 6.0%(-3.45)#23,505 |
| 50. | 90049 | 2.5% | 5.4%(-2.84)#1,292 | 6.0%(-3.46)#23,517 |
| 51. | 90046 | 2.5% | 5.4%(-2.92)#1,304 | 6.0%(-3.54)#23,668 |
| 52. | 90068 | 2.4% | 5.4%(-2.93)#1,307 | 6.0%(-3.55)#23,682 |
| 53. | 90026 | 2.4% | 5.4%(-2.99)#1,313 | 6.0%(-3.62)#23,789 |
| 54. | 90005 | 2.4% | 5.4%(-3.02)#1,316 | 6.0%(-3.64)#23,822 |
| 55. | 90041 | 2.2% | 5.4%(-3.18)#1,335 | 6.0%(-3.80)#24,063 |
| 56. | 90024 | 1.9% | 5.4%(-3.49)#1,369 | 6.0%(-4.12)#24,512 |
| 57. | 90064 | 1.6% | 5.4%(-3.81)#1,400 | 6.0%(-4.43)#24,892 |
| 58. | 90025 | 1.5% | 5.4%(-3.85)#1,404 | 6.0%(-4.47)#24,934 |
| 59. | 90035 | 1.4% | 5.4%(-3.93)#1,407 | 6.0%(-4.55)#25,000 |
| 60. | 90021 | 1.1% | 5.4%(-4.26)#1,425 | 6.0%(-4.89)#25,299 |
| 61. | 90010 | 0.91% | 5.4%(-4.46)#1,435 | 6.0%(-5.08)#25,441 |
| 62. | 90014 | 0.76% | 5.4%(-4.61)#1,440 | 6.0%(-5.24)#25,556 |
1
Common Questions
What are the Top 10 Zip Codes with the Highest Percentage of Population with a Degree in Arts and Humanities in Los Angeles, CA?
Top 10 Zip Codes with the Highest Percentage of Population with a Degree in Arts and Humanities in Los Angeles, CA are:
What zip code has the Highest Percentage of Population with a Degree in Arts and Humanities in Los Angeles, CA?
90073 has the Highest Percentage of Population with a Degree in Arts and Humanities in Los Angeles, CA with 73.8%.
What is the Percentage of Population with a Degree in Arts and Humanities in Los Angeles, CA?
Percentage of Population with a Degree in Arts and Humanities in Los Angeles is 4.0%.
What is the Percentage of Population with a Degree in Arts and Humanities in California?
Percentage of Population with a Degree in Arts and Humanities in California is 5.4%.
What is the Percentage of Population with a Degree in Arts and Humanities in the United States?
Percentage of Population with a Degree in Arts and Humanities in the United States is 6.0%.