Cities with the Highest Percentage of Population with a Degree in Arts and Humanities in Minnesota
RELATED REPORTS & OPTIONS
Arts and Humanities
Minnesota
Compare Cities
Map of Cities with the Highest Percentage of Population with a Degree in Arts and Humanities in Minnesota
0.0%
100.0%
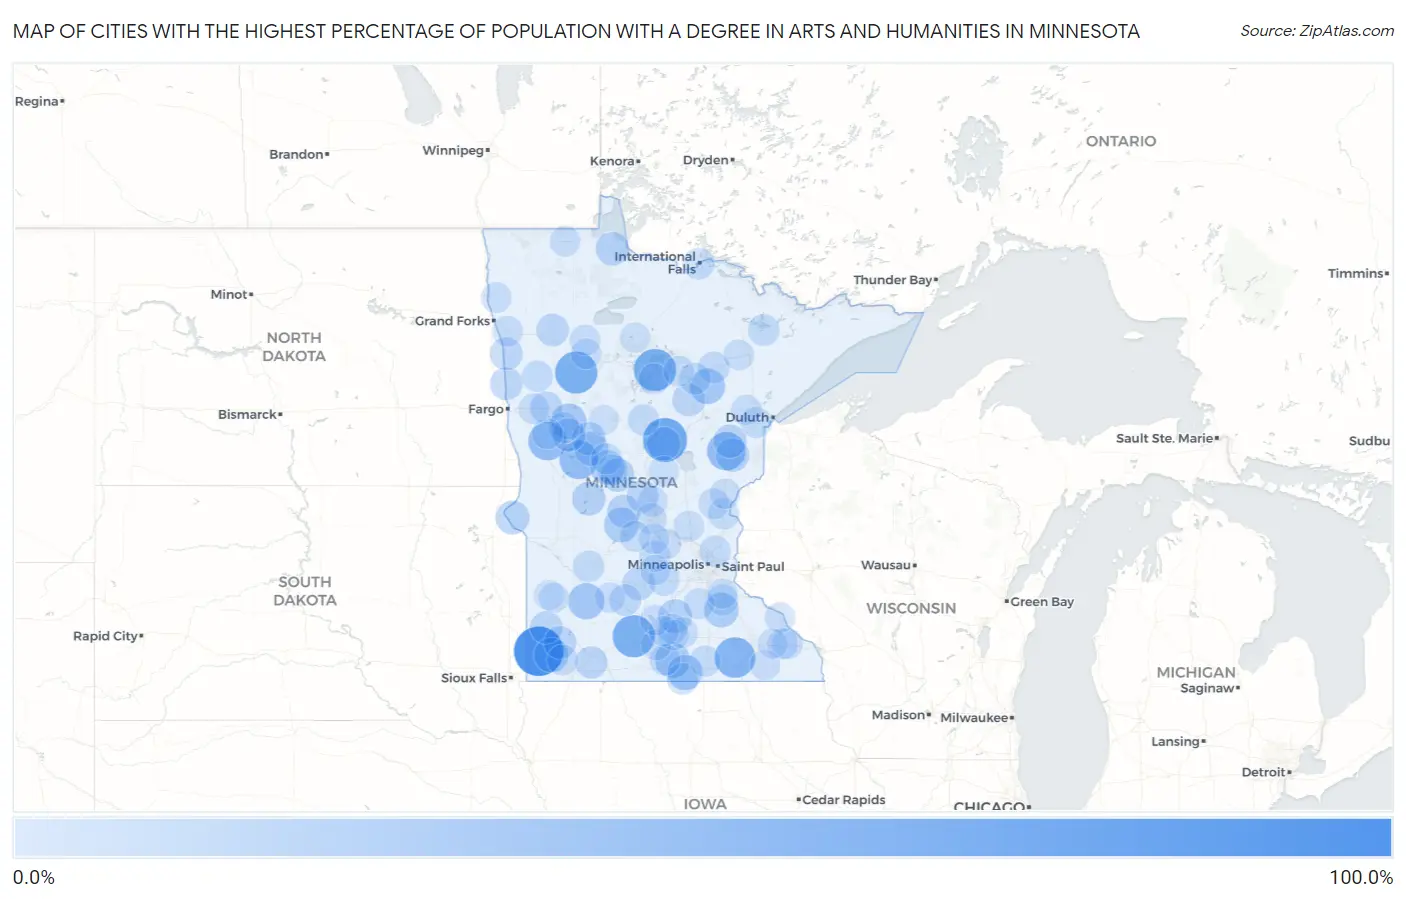
Cities with the Highest Percentage of Population with a Degree in Arts and Humanities in Minnesota
| City | % Graduates | vs State | vs National | |
| 1. | Trosky | 100.0% | 6.2% (+93.8)#1 | 6.0% (+94.0)#96 |
| 2. | Trommald | 75.0% | 6.2% (+68.8)#2 | 6.0% (+69.0)#181 |
| 3. | Bena | 66.7% | 6.2% (+60.5)#3 | 6.0% (+60.7)#218 |
| 4. | La Salle | 66.7% | 6.2% (+60.5)#4 | 6.0% (+60.7)#222 |
| 5. | West Roy Lake | 66.7% | 6.2% (+60.5)#5 | 6.0% (+60.7)#223 |
| 6. | Sargeant | 60.0% | 6.2% (+53.8)#6 | 6.0% (+54.0)#267 |
| 7. | Erhard | 50.0% | 6.2% (+43.8)#7 | 6.0% (+44.0)#376 |
| 8. | Vining | 50.0% | 6.2% (+43.8)#8 | 6.0% (+44.0)#389 |
| 9. | Denham | 50.0% | 6.2% (+43.8)#9 | 6.0% (+44.0)#406 |
| 10. | Vesta | 40.6% | 6.2% (+34.5)#10 | 6.0% (+34.6)#545 |
| 11. | Frazee | 37.5% | 6.2% (+31.3)#11 | 6.0% (+31.5)#650 |
| 12. | Warba | 36.8% | 6.2% (+30.7)#12 | 6.0% (+30.8)#687 |
| 13. | Easton | 36.4% | 6.2% (+30.2)#13 | 6.0% (+30.4)#702 |
| 14. | Walters | 35.3% | 6.2% (+29.1)#14 | 6.0% (+29.3)#742 |
| 15. | Dennison | 33.3% | 6.2% (+27.2)#15 | 6.0% (+27.3)#835 |
| 16. | Leota | 33.3% | 6.2% (+27.2)#16 | 6.0% (+27.3)#849 |
| 17. | Lake Henry | 33.3% | 6.2% (+27.2)#17 | 6.0% (+27.3)#864 |
| 18. | Eagle Bend | 32.3% | 6.2% (+26.1)#18 | 6.0% (+26.3)#907 |
| 19. | Deer Creek | 31.6% | 6.2% (+25.4)#19 | 6.0% (+25.6)#942 |
| 20. | Cleveland | 30.5% | 6.2% (+24.3)#20 | 6.0% (+24.5)#1,015 |
| 21. | Beardsley | 29.6% | 6.2% (+23.5)#21 | 6.0% (+23.6)#1,071 |
| 22. | Riverton | 29.2% | 6.2% (+23.0)#22 | 6.0% (+23.2)#1,096 |
| 23. | Williams | 28.6% | 6.2% (+22.4)#23 | 6.0% (+22.6)#1,132 |
| 24. | Forada | 28.6% | 6.2% (+22.4)#24 | 6.0% (+22.6)#1,145 |
| 25. | New York Mills | 28.3% | 6.2% (+22.1)#25 | 6.0% (+22.3)#1,172 |
| 26. | Browerville | 28.2% | 6.2% (+22.1)#26 | 6.0% (+22.2)#1,175 |
| 27. | Willow River | 28.1% | 6.2% (+22.0)#27 | 6.0% (+22.1)#1,182 |
| 28. | Dent | 27.8% | 6.2% (+21.6)#28 | 6.0% (+21.8)#1,212 |
| 29. | Kettle River | 27.8% | 6.2% (+21.6)#29 | 6.0% (+21.8)#1,215 |
| 30. | New Munich | 26.7% | 6.2% (+20.5)#30 | 6.0% (+20.7)#1,315 |
| 31. | Stewart | 25.0% | 6.2% (+18.8)#31 | 6.0% (+19.0)#1,436 |
| 32. | Hill City | 25.0% | 6.2% (+18.8)#32 | 6.0% (+19.0)#1,440 |
| 33. | Ruthton | 25.0% | 6.2% (+18.8)#33 | 6.0% (+19.0)#1,468 |
| 34. | Perley | 25.0% | 6.2% (+18.8)#34 | 6.0% (+19.0)#1,484 |
| 35. | Brooks | 25.0% | 6.2% (+18.8)#35 | 6.0% (+19.0)#1,486 |
| 36. | Nielsville | 25.0% | 6.2% (+18.8)#36 | 6.0% (+19.0)#1,494 |
| 37. | Hadley | 25.0% | 6.2% (+18.8)#37 | 6.0% (+19.0)#1,509 |
| 38. | Okabena | 23.6% | 6.2% (+17.5)#38 | 6.0% (+17.6)#1,636 |
| 39. | Lake Park | 23.3% | 6.2% (+17.1)#39 | 6.0% (+17.3)#1,677 |
| 40. | Bowlus | 23.1% | 6.2% (+16.9)#40 | 6.0% (+17.1)#1,702 |
| 41. | Fairfax | 21.1% | 6.2% (+15.0)#41 | 6.0% (+15.1)#1,981 |
| 42. | Nashwauk | 21.1% | 6.2% (+14.9)#42 | 6.0% (+15.1)#1,989 |
| 43. | La Prairie | 20.5% | 6.2% (+14.4)#43 | 6.0% (+14.6)#2,067 |
| 44. | Tower | 20.5% | 6.2% (+14.4)#44 | 6.0% (+14.5)#2,075 |
| 45. | International Falls | 20.4% | 6.2% (+14.3)#45 | 6.0% (+14.4)#2,092 |
| 46. | Chickamaw Beach | 20.3% | 6.2% (+14.2)#46 | 6.0% (+14.3)#2,098 |
| 47. | Plato | 20.0% | 6.2% (+13.8)#47 | 6.0% (+14.0)#2,191 |
| 48. | Kiester | 19.6% | 6.2% (+13.5)#48 | 6.0% (+13.6)#2,265 |
| 49. | Clara City | 19.6% | 6.2% (+13.4)#49 | 6.0% (+13.6)#2,275 |
| 50. | Cokato | 19.3% | 6.2% (+13.1)#50 | 6.0% (+13.3)#2,329 |
| 51. | Randolph | 19.2% | 6.2% (+13.1)#51 | 6.0% (+13.2)#2,349 |
| 52. | Twin Valley | 19.2% | 6.2% (+13.0)#52 | 6.0% (+13.2)#2,364 |
| 53. | Clarks Grove | 19.0% | 6.2% (+12.9)#53 | 6.0% (+13.1)#2,390 |
| 54. | Harris | 19.0% | 6.2% (+12.8)#54 | 6.0% (+13.0)#2,405 |
| 55. | Bertha | 18.8% | 6.2% (+12.7)#55 | 6.0% (+12.8)#2,435 |
| 56. | Vergas | 18.8% | 6.2% (+12.6)#56 | 6.0% (+12.8)#2,455 |
| 57. | Circle Pines | 18.6% | 6.2% (+12.5)#57 | 6.0% (+12.6)#2,482 |
| 58. | Clarissa | 18.2% | 6.2% (+12.0)#58 | 6.0% (+12.2)#2,561 |
| 59. | Delavan | 18.2% | 6.2% (+12.0)#59 | 6.0% (+12.2)#2,577 |
| 60. | Scanlon | 18.1% | 6.2% (+11.9)#60 | 6.0% (+12.1)#2,613 |
| 61. | Lonsdale | 18.0% | 6.2% (+11.8)#61 | 6.0% (+12.0)#2,625 |
| 62. | Braham | 17.7% | 6.2% (+11.6)#62 | 6.0% (+11.7)#2,682 |
| 63. | Zimmerman | 17.7% | 6.2% (+11.5)#63 | 6.0% (+11.7)#2,693 |
| 64. | Waite Park | 17.6% | 6.2% (+11.5)#64 | 6.0% (+11.6)#2,721 |
| 65. | Eden Valley | 17.4% | 6.2% (+11.3)#65 | 6.0% (+11.4)#2,768 |
| 66. | Wilmont | 17.4% | 6.2% (+11.2)#66 | 6.0% (+11.4)#2,783 |
| 67. | Pelican Rapids | 17.3% | 6.2% (+11.1)#67 | 6.0% (+11.3)#2,813 |
| 68. | Hawley | 17.0% | 6.2% (+10.8)#68 | 6.0% (+11.0)#2,884 |
| 69. | Fisher | 16.9% | 6.2% (+10.8)#69 | 6.0% (+10.9)#2,903 |
| 70. | Lewiston | 16.9% | 6.2% (+10.7)#70 | 6.0% (+10.9)#2,909 |
| 71. | Clearbrook | 16.8% | 6.2% (+10.7)#71 | 6.0% (+10.8)#2,919 |
| 72. | Janesville | 16.8% | 6.2% (+10.6)#72 | 6.0% (+10.8)#2,929 |
| 73. | Roseau | 16.8% | 6.2% (+10.6)#73 | 6.0% (+10.8)#2,931 |
| 74. | Bagley | 16.7% | 6.2% (+10.5)#74 | 6.0% (+10.7)#2,959 |
| 75. | Alvarado | 16.7% | 6.2% (+10.5)#75 | 6.0% (+10.7)#2,996 |
| 76. | Utica | 16.7% | 6.2% (+10.5)#76 | 6.0% (+10.7)#3,018 |
| 77. | Federal Dam | 16.7% | 6.2% (+10.5)#77 | 6.0% (+10.7)#3,025 |
| 78. | Kinney | 16.7% | 6.2% (+10.5)#78 | 6.0% (+10.7)#3,027 |
| 79. | Zemple | 16.7% | 6.2% (+10.5)#79 | 6.0% (+10.7)#3,035 |
| 80. | Brookston | 16.7% | 6.2% (+10.5)#80 | 6.0% (+10.7)#3,038 |
| 81. | Rice | 16.6% | 6.2% (+10.4)#81 | 6.0% (+10.6)#3,058 |
| 82. | St Clair | 16.3% | 6.2% (+10.1)#82 | 6.0% (+10.3)#3,139 |
| 83. | Maple Lake | 15.7% | 6.2% (+9.55)#83 | 6.0% (+9.71)#3,316 |
| 84. | Morton | 15.6% | 6.2% (+9.47)#84 | 6.0% (+9.63)#3,347 |
| 85. | Vernon Center | 15.6% | 6.2% (+9.47)#85 | 6.0% (+9.63)#3,348 |
| 86. | Nicollet | 15.6% | 6.2% (+9.40)#86 | 6.0% (+9.56)#3,368 |
| 87. | Pine City | 15.5% | 6.2% (+9.37)#87 | 6.0% (+9.53)#3,379 |
| 88. | Silver Lake | 15.4% | 6.2% (+9.23)#88 | 6.0% (+9.39)#3,419 |
| 89. | Kellogg | 15.4% | 6.2% (+9.23)#89 | 6.0% (+9.39)#3,430 |
| 90. | Wykoff | 15.4% | 6.2% (+9.23)#90 | 6.0% (+9.39)#3,432 |
| 91. | South Haven | 15.4% | 6.2% (+9.23)#91 | 6.0% (+9.39)#3,444 |
| 92. | Harding | 15.4% | 6.2% (+9.23)#92 | 6.0% (+9.39)#3,450 |
| 93. | Eagle Lake | 15.1% | 6.2% (+8.99)#93 | 6.0% (+9.15)#3,539 |
| 94. | Menahga | 15.1% | 6.2% (+8.91)#94 | 6.0% (+9.07)#3,572 |
| 95. | Taunton | 15.0% | 6.2% (+8.84)#95 | 6.0% (+9.00)#3,609 |
| 96. | Minneota | 14.9% | 6.2% (+8.78)#96 | 6.0% (+8.94)#3,636 |
| 97. | Hampton | 14.9% | 6.2% (+8.71)#97 | 6.0% (+8.87)#3,660 |
| 98. | Dover | 14.8% | 6.2% (+8.66)#98 | 6.0% (+8.82)#3,674 |
| 99. | Skyline | 14.7% | 6.2% (+8.52)#99 | 6.0% (+8.68)#3,732 |
| 100. | Blackduck | 14.5% | 6.2% (+8.34)#100 | 6.0% (+8.50)#3,814 |
Common Questions
What are the Top 10 Cities with the Highest Percentage of Population with a Degree in Arts and Humanities in Minnesota?
Top 10 Cities with the Highest Percentage of Population with a Degree in Arts and Humanities in Minnesota are:
What city has the Highest Percentage of Population with a Degree in Arts and Humanities in Minnesota?
Trosky has the Highest Percentage of Population with a Degree in Arts and Humanities in Minnesota with 100.0%.
What is the Percentage of Population with a Degree in Arts and Humanities in the State of Minnesota?
Percentage of Population with a Degree in Arts and Humanities in Minnesota is 6.2%.
What is the Percentage of Population with a Degree in Arts and Humanities in the United States?
Percentage of Population with a Degree in Arts and Humanities in the United States is 6.0%.