Zip Codes with the Highest Percentage of Population with a Degree in Arts and Humanities in Hesperia, CA
RELATED REPORTS & OPTIONS
Arts and Humanities
Hesperia
Compare Zip Codes
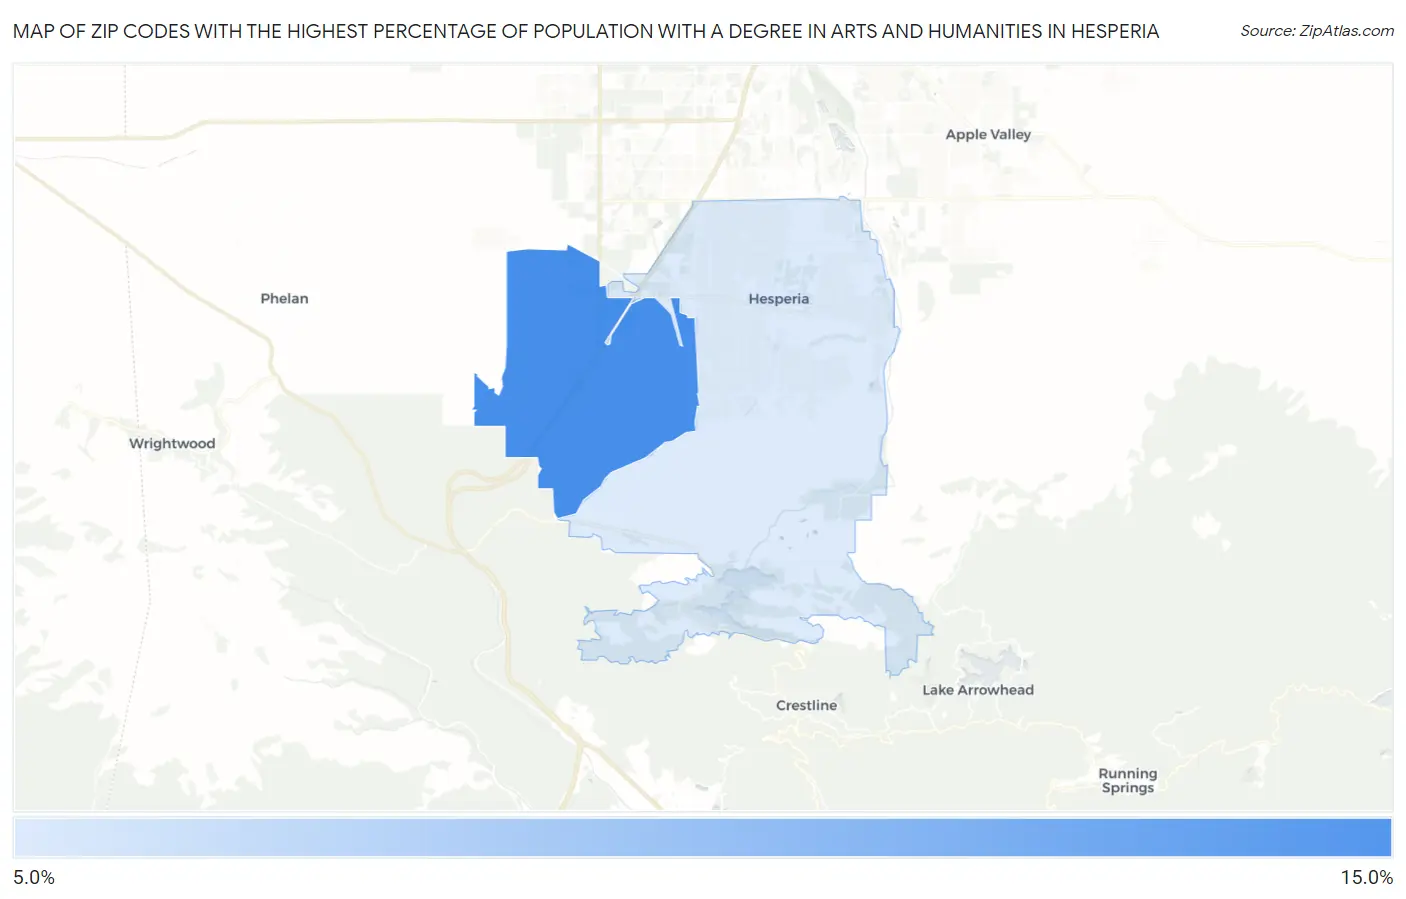
Map of Zip Codes with the Highest Percentage of Population with a Degree in Arts and Humanities in Hesperia
9.8%
12.3%
Zip Codes with the Highest Percentage of Population with a Degree in Arts and Humanities in Hesperia, CA
| Zip Code | % Graduates | vs State | vs National | |
| 1. | 92344 | 12.3% | 5.4%(+6.97)#164 | 6.0%(+6.35)#4,088 |
| 2. | 92345 | 9.8% | 5.4%(+4.38)#289 | 6.0%(+3.75)#6,589 |
1
Common Questions
What are the Top Zip Codes with the Highest Percentage of Population with a Degree in Arts and Humanities in Hesperia, CA?
Top Zip Codes with the Highest Percentage of Population with a Degree in Arts and Humanities in Hesperia, CA are:
What zip code has the Highest Percentage of Population with a Degree in Arts and Humanities in Hesperia, CA?
92344 has the Highest Percentage of Population with a Degree in Arts and Humanities in Hesperia, CA with 12.3%.
What is the Percentage of Population with a Degree in Arts and Humanities in Hesperia, CA?
Percentage of Population with a Degree in Arts and Humanities in Hesperia is 9.9%.
What is the Percentage of Population with a Degree in Arts and Humanities in California?
Percentage of Population with a Degree in Arts and Humanities in California is 5.4%.
What is the Percentage of Population with a Degree in Arts and Humanities in the United States?
Percentage of Population with a Degree in Arts and Humanities in the United States is 6.0%.