Cities with the Highest Percentage of Population Driving Alone to Work in Utah
RELATED REPORTS & OPTIONS
Drive | Alone
Utah
Compare Cities
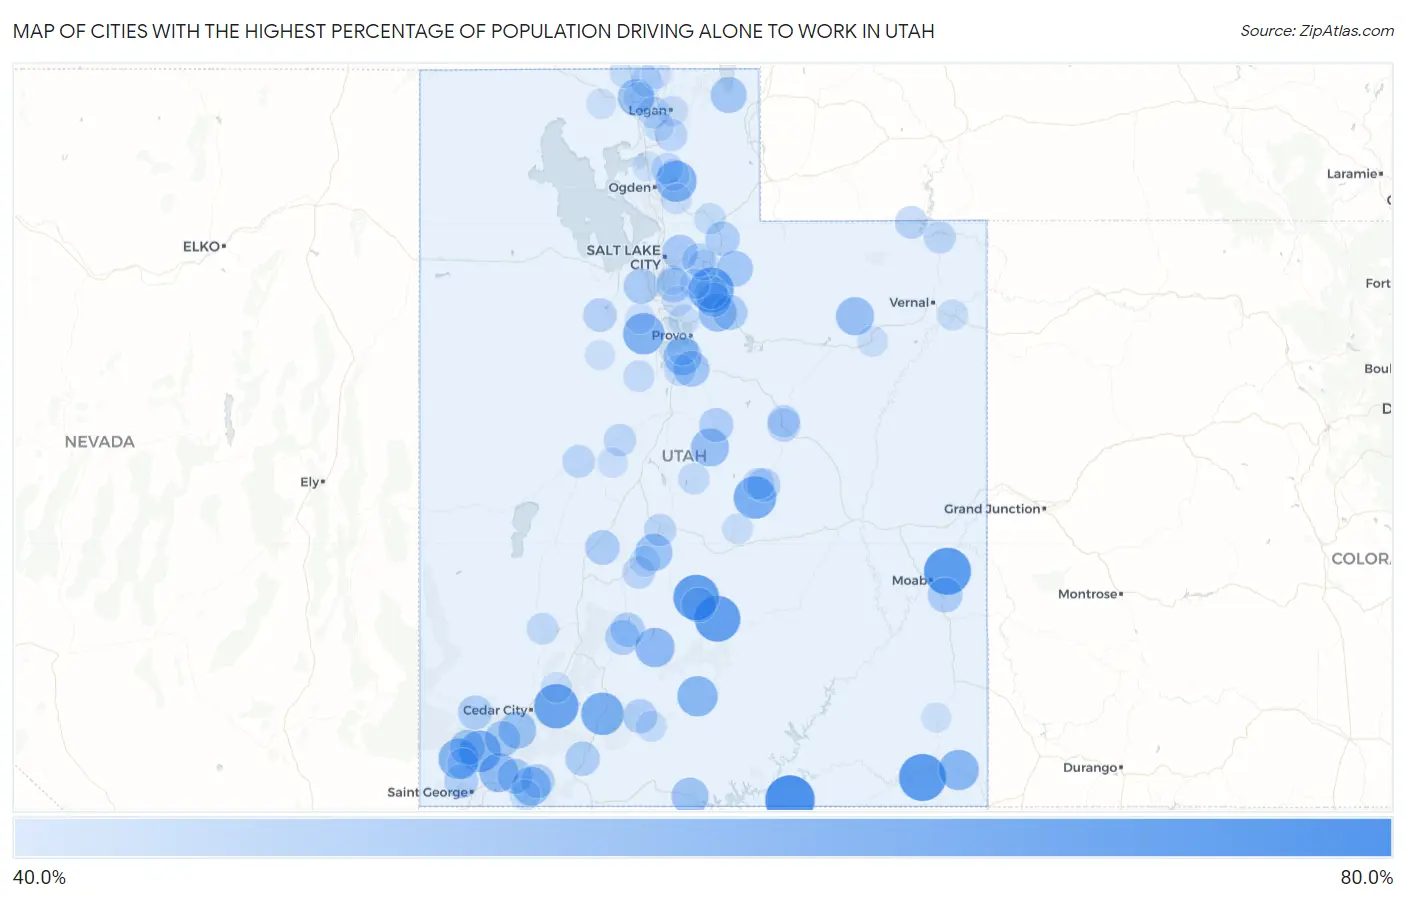
Map of Cities with the Highest Percentage of Population Driving Alone to Work in Utah
0.0%
80.0%
Cities with the Highest Percentage of Population Driving Alone to Work in Utah
| City | % Drive Alone | vs State | vs National | |
| 1. | Navajo Mountain | 67.2% | 38.2%(+29.0)#1 | 42.1%(+25.1)#83 |
| 2. | Tselakai Dezza | 64.1% | 38.2%(+25.9)#2 | 42.1%(+22.0)#208 |
| 3. | Castle Valley | 64.0% | 38.2%(+25.8)#3 | 42.1%(+21.9)#212 |
| 4. | Torrey | 62.5% | 38.2%(+24.3)#4 | 42.1%(+20.4)#311 |
| 5. | Fremont | 62.4% | 38.2%(+24.2)#5 | 42.1%(+20.3)#327 |
| 6. | Interlaken | 61.4% | 38.2%(+23.2)#6 | 42.1%(+19.3)#432 |
| 7. | Brian Head | 60.8% | 38.2%(+22.6)#7 | 42.1%(+18.7)#512 |
| 8. | Hatch | 58.6% | 38.2%(+20.4)#8 | 42.1%(+16.5)#888 |
| 9. | Clawson | 58.5% | 38.2%(+20.3)#9 | 42.1%(+16.4)#919 |
| 10. | Pine Valley | 57.3% | 38.2%(+19.1)#10 | 42.1%(+15.2)#1,214 |
| 11. | Fairfield | 57.0% | 38.2%(+18.8)#11 | 42.1%(+14.9)#1,309 |
| 12. | Huntsville | 56.4% | 38.2%(+18.2)#12 | 42.1%(+14.3)#1,468 |
| 13. | Veyo | 56.0% | 38.2%(+17.8)#13 | 42.1%(+13.9)#1,607 |
| 14. | Escalante | 55.8% | 38.2%(+17.6)#14 | 42.1%(+13.7)#1,644 |
| 15. | Montezuma Creek | 55.7% | 38.2%(+17.5)#15 | 42.1%(+13.6)#1,682 |
| 16. | Antimony | 54.5% | 38.2%(+16.3)#16 | 42.1%(+12.4)#2,124 |
| 17. | Leeds | 54.1% | 38.2%(+15.9)#17 | 42.1%(+12.0)#2,277 |
| 18. | Rockville | 53.8% | 38.2%(+15.6)#18 | 42.1%(+11.7)#2,407 |
| 19. | Bluebell | 53.0% | 38.2%(+14.8)#19 | 42.1%(+10.9)#2,831 |
| 20. | Spring City | 52.9% | 38.2%(+14.7)#20 | 42.1%(+10.8)#2,854 |
| 21. | Wallsburg | 52.9% | 38.2%(+14.7)#21 | 42.1%(+10.8)#2,869 |
| 22. | Benjamin | 52.7% | 38.2%(+14.5)#22 | 42.1%(+10.6)#2,945 |
| 23. | Glenwood | 52.0% | 38.2%(+13.8)#23 | 42.1%(+9.90)#3,386 |
| 24. | Kanarraville | 52.0% | 38.2%(+13.8)#24 | 42.1%(+9.90)#3,395 |
| 25. | Big Water | 51.8% | 38.2%(+13.6)#25 | 42.1%(+9.70)#3,481 |
| 26. | Riverside | 51.6% | 38.2%(+13.4)#26 | 42.1%(+9.50)#3,597 |
| 27. | Laketown | 50.6% | 38.2%(+12.4)#27 | 42.1%(+8.50)#4,324 |
| 28. | Woodland Hills | 50.5% | 38.2%(+12.3)#28 | 42.1%(+8.40)#4,374 |
| 29. | Hobble Creek | 50.5% | 38.2%(+12.3)#29 | 42.1%(+8.40)#4,418 |
| 30. | Marion | 50.4% | 38.2%(+12.2)#30 | 42.1%(+8.30)#4,497 |
| 31. | Central | 50.1% | 38.2%(+11.9)#31 | 42.1%(+8.00)#4,767 |
| 32. | New Harmony | 50.1% | 38.2%(+11.9)#32 | 42.1%(+8.00)#4,783 |
| 33. | Emigration Canyon | 49.7% | 38.2%(+11.5)#33 | 42.1%(+7.60)#5,115 |
| 34. | Copperton | 49.5% | 38.2%(+11.3)#34 | 42.1%(+7.40)#5,316 |
| 35. | Virgin | 49.4% | 38.2%(+11.2)#35 | 42.1%(+7.30)#5,456 |
| 36. | Spanish Valley | 49.1% | 38.2%(+10.9)#36 | 42.1%(+7.00)#5,749 |
| 37. | Independence | 49.1% | 38.2%(+10.9)#37 | 42.1%(+7.00)#5,781 |
| 38. | Lyman | 48.9% | 38.2%(+10.7)#38 | 42.1%(+6.80)#5,966 |
| 39. | Granite | 48.8% | 38.2%(+10.6)#39 | 42.1%(+6.70)#6,038 |
| 40. | Kanosh | 48.8% | 38.2%(+10.6)#40 | 42.1%(+6.70)#6,042 |
| 41. | Circleville | 48.8% | 38.2%(+10.6)#41 | 42.1%(+6.70)#6,048 |
| 42. | Junction | 48.6% | 38.2%(+10.4)#42 | 42.1%(+6.50)#6,262 |
| 43. | Hoytsville | 48.5% | 38.2%(+10.3)#43 | 42.1%(+6.40)#6,341 |
| 44. | Charleston | 48.5% | 38.2%(+10.3)#44 | 42.1%(+6.40)#6,361 |
| 45. | Glendale | 48.5% | 38.2%(+10.3)#45 | 42.1%(+6.40)#6,371 |
| 46. | Fairview | 48.3% | 38.2%(+10.1)#46 | 42.1%(+6.20)#6,586 |
| 47. | Tropic | 48.3% | 38.2%(+10.1)#47 | 42.1%(+6.20)#6,614 |
| 48. | Newcastle | 48.2% | 38.2%(+10.0)#48 | 42.1%(+6.10)#6,771 |
| 49. | Springdale | 48.1% | 38.2%(+9.90)#49 | 42.1%(+6.00)#6,891 |
| 50. | Ivins | 48.0% | 38.2%(+9.80)#50 | 42.1%(+5.90)#6,932 |
| 51. | Castle Dale | 47.5% | 38.2%(+9.30)#51 | 42.1%(+5.40)#7,535 |
| 52. | Rush Valley | 47.5% | 38.2%(+9.30)#52 | 42.1%(+5.40)#7,568 |
| 53. | Midway | 47.2% | 38.2%(+9.00)#53 | 42.1%(+5.10)#7,940 |
| 54. | Summit Park | 47.1% | 38.2%(+8.90)#54 | 42.1%(+5.00)#8,069 |
| 55. | Carbonville | 46.9% | 38.2%(+8.70)#55 | 42.1%(+4.80)#8,378 |
| 56. | Manila | 46.4% | 38.2%(+8.20)#56 | 42.1%(+4.30)#9,076 |
| 57. | Paradise | 46.3% | 38.2%(+8.10)#57 | 42.1%(+4.20)#9,180 |
| 58. | Sutherland | 46.3% | 38.2%(+8.10)#58 | 42.1%(+4.20)#9,238 |
| 59. | Monroe | 46.2% | 38.2%(+8.00)#59 | 42.1%(+4.10)#9,303 |
| 60. | Spring Glen | 46.1% | 38.2%(+7.90)#60 | 42.1%(+4.00)#9,466 |
| 61. | Aurora | 46.1% | 38.2%(+7.90)#61 | 42.1%(+4.00)#9,471 |
| 62. | Mendon | 46.0% | 38.2%(+7.80)#62 | 42.1%(+3.90)#9,596 |
| 63. | Leamington | 46.0% | 38.2%(+7.80)#63 | 42.1%(+3.90)#9,638 |
| 64. | Flaming Gorge | 45.7% | 38.2%(+7.50)#64 | 42.1%(+3.60)#10,096 |
| 65. | Orangeville | 45.3% | 38.2%(+7.10)#65 | 42.1%(+3.20)#10,647 |
| 66. | Minersville | 45.3% | 38.2%(+7.10)#66 | 42.1%(+3.20)#10,659 |
| 67. | Eden | 45.3% | 38.2%(+7.10)#67 | 42.1%(+3.20)#10,660 |
| 68. | Spring Lake | 45.3% | 38.2%(+7.10)#68 | 42.1%(+3.20)#10,685 |
| 69. | Liberty | 45.2% | 38.2%(+7.00)#69 | 42.1%(+3.10)#10,826 |
| 70. | Clarkston | 45.1% | 38.2%(+6.90)#70 | 42.1%(+3.00)#11,008 |
| 71. | Manti | 44.9% | 38.2%(+6.70)#71 | 42.1%(+2.80)#11,263 |
| 72. | Dammeron Valley | 44.9% | 38.2%(+6.70)#72 | 42.1%(+2.80)#11,327 |
| 73. | Henefer | 44.9% | 38.2%(+6.70)#73 | 42.1%(+2.80)#11,332 |
| 74. | Eureka | 44.8% | 38.2%(+6.60)#74 | 42.1%(+2.70)#11,480 |
| 75. | Snyderville | 44.6% | 38.2%(+6.40)#75 | 42.1%(+2.50)#11,766 |
| 76. | Lake Shore | 44.6% | 38.2%(+6.40)#76 | 42.1%(+2.50)#11,819 |
| 77. | Annabella | 44.6% | 38.2%(+6.40)#77 | 42.1%(+2.50)#11,836 |
| 78. | Apple Valley | 44.5% | 38.2%(+6.30)#78 | 42.1%(+2.40)#11,991 |
| 79. | Henrieville | 44.5% | 38.2%(+6.30)#79 | 42.1%(+2.40)#12,062 |
| 80. | Portage | 44.5% | 38.2%(+6.30)#80 | 42.1%(+2.40)#12,069 |
| 81. | Mountain Green | 44.3% | 38.2%(+6.10)#81 | 42.1%(+2.20)#12,339 |
| 82. | Parowan | 44.3% | 38.2%(+6.10)#82 | 42.1%(+2.20)#12,345 |
| 83. | Fielding | 44.3% | 38.2%(+6.10)#83 | 42.1%(+2.20)#12,415 |
| 84. | Jensen | 44.3% | 38.2%(+6.10)#84 | 42.1%(+2.20)#12,440 |
| 85. | Myton | 44.2% | 38.2%(+6.00)#85 | 42.1%(+2.10)#12,601 |
| 86. | Lindon | 44.1% | 38.2%(+5.90)#86 | 42.1%(+2.00)#12,674 |
| 87. | River Heights | 44.0% | 38.2%(+5.80)#87 | 42.1%(+1.90)#12,885 |
| 88. | Alta | 44.0% | 38.2%(+5.80)#88 | 42.1%(+1.90)#12,956 |
| 89. | Emery | 44.0% | 38.2%(+5.80)#89 | 42.1%(+1.90)#12,957 |
| 90. | Alpine | 43.8% | 38.2%(+5.60)#90 | 42.1%(+1.70)#13,183 |
| 91. | Oak City | 43.8% | 38.2%(+5.60)#91 | 42.1%(+1.70)#13,285 |
| 92. | Cornish | 43.8% | 38.2%(+5.60)#92 | 42.1%(+1.70)#13,330 |
| 93. | Cedar Fort | 43.8% | 38.2%(+5.60)#93 | 42.1%(+1.70)#13,339 |
| 94. | Wellsville | 43.7% | 38.2%(+5.50)#94 | 42.1%(+1.60)#13,415 |
| 95. | East Basin | 43.7% | 38.2%(+5.50)#95 | 42.1%(+1.60)#13,421 |
| 96. | Cottonwood Heights | 43.5% | 38.2%(+5.30)#96 | 42.1%(+1.40)#13,710 |
| 97. | South Willard | 43.5% | 38.2%(+5.30)#97 | 42.1%(+1.40)#13,811 |
| 98. | Howell | 43.5% | 38.2%(+5.30)#98 | 42.1%(+1.40)#13,900 |
| 99. | Vernon | 43.5% | 38.2%(+5.30)#99 | 42.1%(+1.40)#13,911 |
| 100. | Blanding | 43.4% | 38.2%(+5.20)#100 | 42.1%(+1.30)#14,030 |
Common Questions
What are the Top 10 Cities with the Highest Percentage of Population Driving Alone to Work in Utah?
Top 10 Cities with the Highest Percentage of Population Driving Alone to Work in Utah are:
#1
67.2%
#2
64.1%
#3
64.0%
#4
62.5%
#5
62.4%
#6
61.4%
#7
60.8%
#8
58.6%
#9
58.5%
#10
57.3%
What city has the Highest Percentage of Population Driving Alone to Work in Utah?
Navajo Mountain has the Highest Percentage of Population Driving Alone to Work in Utah with 67.2%.
What is the Percentage of Population Driving Alone to Work in the State of Utah?
Percentage of Population Driving Alone to Work in Utah is 38.2%.
What is the Percentage of Population Driving Alone to Work in the United States?
Percentage of Population Driving Alone to Work in the United States is 42.1%.