Cities with the Highest Percentage of Population Driving Alone to Work in Massachusetts
RELATED REPORTS & OPTIONS
Drive | Alone
Massachusetts
Compare Cities
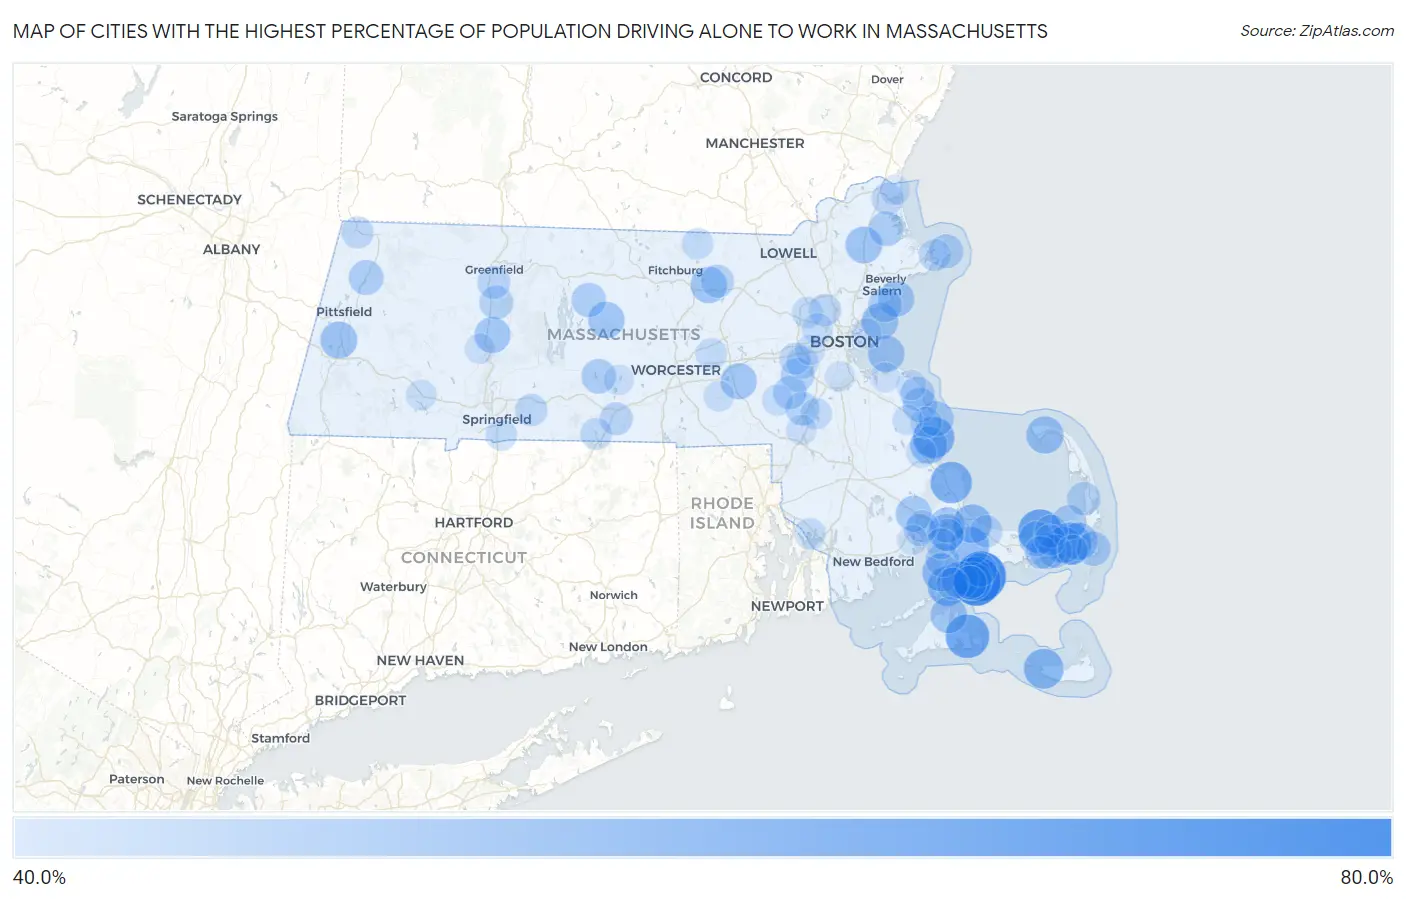
Map of Cities with the Highest Percentage of Population Driving Alone to Work in Massachusetts
0.0%
80.0%
Cities with the Highest Percentage of Population Driving Alone to Work in Massachusetts
| City | % Drive Alone | vs State | vs National | |
| 1. | Popponesset Island | 66.4% | 44.4%(+22.0)#1 | 42.1%(+24.3)#103 |
| 2. | New Seabury | 66.0% | 44.4%(+21.6)#2 | 42.1%(+23.9)#120 |
| 3. | Dennis | 60.7% | 44.4%(+16.3)#3 | 42.1%(+18.6)#518 |
| 4. | Edgartown | 60.6% | 44.4%(+16.2)#4 | 42.1%(+18.5)#526 |
| 5. | Harwich Center | 58.9% | 44.4%(+14.5)#5 | 42.1%(+16.8)#839 |
| 6. | The Pinehills | 58.5% | 44.4%(+14.1)#6 | 42.1%(+16.4)#890 |
| 7. | Duxbury | 58.4% | 44.4%(+14.0)#7 | 42.1%(+16.3)#928 |
| 8. | Seabrook | 57.2% | 44.4%(+12.8)#8 | 42.1%(+15.1)#1,243 |
| 9. | Oak Bluffs | 57.0% | 44.4%(+12.6)#9 | 42.1%(+14.9)#1,294 |
| 10. | Madaket | 57.0% | 44.4%(+12.6)#10 | 42.1%(+14.9)#1,303 |
| 11. | Falmouth | 56.8% | 44.4%(+12.4)#11 | 42.1%(+14.7)#1,324 |
| 12. | Forestdale | 56.0% | 44.4%(+11.6)#12 | 42.1%(+13.9)#1,597 |
| 13. | Sandwich | 55.9% | 44.4%(+11.5)#13 | 42.1%(+13.8)#1,625 |
| 14. | Monomoscoy Island | 55.5% | 44.4%(+11.1)#14 | 42.1%(+13.4)#1,753 |
| 15. | West Falmouth | 55.1% | 44.4%(+10.7)#15 | 42.1%(+13.0)#1,880 |
| 16. | East Falmouth | 54.5% | 44.4%(+10.1)#16 | 42.1%(+12.4)#2,072 |
| 17. | East Harwich | 54.5% | 44.4%(+10.1)#17 | 42.1%(+12.4)#2,074 |
| 18. | Provincetown | 54.5% | 44.4%(+10.1)#18 | 42.1%(+12.4)#2,076 |
| 19. | South Duxbury | 54.5% | 44.4%(+10.1)#19 | 42.1%(+12.4)#2,077 |
| 20. | Lenox | 54.2% | 44.4%(+9.80)#20 | 42.1%(+12.1)#2,234 |
| 21. | Nahant | 54.0% | 44.4%(+9.60)#21 | 42.1%(+11.9)#2,304 |
| 22. | Boxford | 54.0% | 44.4%(+9.60)#22 | 42.1%(+11.9)#2,307 |
| 23. | Hull | 53.9% | 44.4%(+9.50)#23 | 42.1%(+11.8)#2,344 |
| 24. | Vineyard Haven | 53.8% | 44.4%(+9.40)#24 | 42.1%(+11.7)#2,377 |
| 25. | Bourne | 53.8% | 44.4%(+9.40)#25 | 42.1%(+11.7)#2,381 |
| 26. | Northwest Harwich | 53.7% | 44.4%(+9.30)#26 | 42.1%(+11.6)#2,420 |
| 27. | Shirley | 53.7% | 44.4%(+9.30)#27 | 42.1%(+11.6)#2,426 |
| 28. | Barre | 53.7% | 44.4%(+9.30)#28 | 42.1%(+11.6)#2,435 |
| 29. | Hopkinton | 53.4% | 44.4%(+9.00)#29 | 42.1%(+11.3)#2,586 |
| 30. | Marblehead | 53.3% | 44.4%(+8.90)#30 | 42.1%(+11.2)#2,642 |
| 31. | Hatfield | 53.3% | 44.4%(+8.90)#31 | 42.1%(+11.2)#2,649 |
| 32. | West Wareham | 53.2% | 44.4%(+8.80)#32 | 42.1%(+11.1)#2,707 |
| 33. | West Dennis | 53.1% | 44.4%(+8.70)#33 | 42.1%(+11.0)#2,752 |
| 34. | Lenox Dale | 53.1% | 44.4%(+8.70)#34 | 42.1%(+11.0)#2,789 |
| 35. | Buzzards Bay | 52.7% | 44.4%(+8.30)#35 | 42.1%(+10.6)#2,934 |
| 36. | Ocean Bluff Brant Rock | 52.5% | 44.4%(+8.10)#36 | 42.1%(+10.4)#3,020 |
| 37. | Yarmouth Port | 52.4% | 44.4%(+8.00)#37 | 42.1%(+10.3)#3,097 |
| 38. | Rowley | 52.2% | 44.4%(+7.80)#38 | 42.1%(+10.1)#3,249 |
| 39. | Cheshire | 52.2% | 44.4%(+7.80)#39 | 42.1%(+10.1)#3,268 |
| 40. | Brewster | 52.1% | 44.4%(+7.70)#40 | 42.1%(+10.00)#3,309 |
| 41. | West Brookfield | 52.0% | 44.4%(+7.60)#41 | 42.1%(+9.90)#3,371 |
| 42. | Petersham | 51.8% | 44.4%(+7.40)#42 | 42.1%(+9.70)#3,494 |
| 43. | Marshfield Hills | 51.7% | 44.4%(+7.30)#43 | 42.1%(+9.60)#3,533 |
| 44. | Chatham | 51.7% | 44.4%(+7.30)#44 | 42.1%(+9.60)#3,538 |
| 45. | Scituate | 51.6% | 44.4%(+7.20)#45 | 42.1%(+9.50)#3,577 |
| 46. | Rockport | 51.5% | 44.4%(+7.10)#46 | 42.1%(+9.40)#3,637 |
| 47. | Swampscott | 51.4% | 44.4%(+7.00)#47 | 42.1%(+9.30)#3,718 |
| 48. | North Falmouth | 51.4% | 44.4%(+7.00)#48 | 42.1%(+9.30)#3,729 |
| 49. | Dover | 51.2% | 44.4%(+6.80)#49 | 42.1%(+9.10)#3,888 |
| 50. | South Deerfield | 51.2% | 44.4%(+6.80)#50 | 42.1%(+9.10)#3,892 |
| 51. | Walpole | 51.0% | 44.4%(+6.60)#51 | 42.1%(+8.90)#4,025 |
| 52. | Medfield | 51.0% | 44.4%(+6.60)#52 | 42.1%(+8.90)#4,027 |
| 53. | Mashpee Neck | 51.0% | 44.4%(+6.60)#53 | 42.1%(+8.90)#4,045 |
| 54. | North Eastham | 50.9% | 44.4%(+6.50)#54 | 42.1%(+8.80)#4,112 |
| 55. | Seconsett Island | 50.9% | 44.4%(+6.50)#55 | 42.1%(+8.80)#4,143 |
| 56. | Dennis Port | 50.8% | 44.4%(+6.40)#56 | 42.1%(+8.70)#4,163 |
| 57. | Devens | 50.6% | 44.4%(+6.20)#57 | 42.1%(+8.50)#4,294 |
| 58. | East Dennis | 50.5% | 44.4%(+6.10)#58 | 42.1%(+8.40)#4,357 |
| 59. | Sturbridge | 50.5% | 44.4%(+6.10)#59 | 42.1%(+8.40)#4,364 |
| 60. | South Yarmouth | 50.4% | 44.4%(+6.00)#60 | 42.1%(+8.30)#4,450 |
| 61. | Deerfield | 50.4% | 44.4%(+6.00)#61 | 42.1%(+8.30)#4,508 |
| 62. | Wilbraham | 50.0% | 44.4%(+5.60)#62 | 42.1%(+7.90)#4,827 |
| 63. | Monument Beach | 50.0% | 44.4%(+5.60)#63 | 42.1%(+7.90)#4,830 |
| 64. | East Sandwich | 49.9% | 44.4%(+5.50)#64 | 42.1%(+7.80)#4,917 |
| 65. | Needham | 49.7% | 44.4%(+5.30)#65 | 42.1%(+7.60)#5,081 |
| 66. | Gloucester | 49.7% | 44.4%(+5.30)#66 | 42.1%(+7.60)#5,082 |
| 67. | Winchester | 49.7% | 44.4%(+5.30)#67 | 42.1%(+7.60)#5,083 |
| 68. | Newburyport | 49.7% | 44.4%(+5.30)#68 | 42.1%(+7.60)#5,085 |
| 69. | Weweantic | 49.7% | 44.4%(+5.30)#69 | 42.1%(+7.60)#5,111 |
| 70. | Williamstown | 49.6% | 44.4%(+5.20)#70 | 42.1%(+7.50)#5,182 |
| 71. | Wareham Center | 49.6% | 44.4%(+5.20)#71 | 42.1%(+7.50)#5,196 |
| 72. | Teaticket | 49.6% | 44.4%(+5.20)#72 | 42.1%(+7.50)#5,205 |
| 73. | Holland | 49.5% | 44.4%(+5.10)#73 | 42.1%(+7.40)#5,307 |
| 74. | Wellesley | 49.3% | 44.4%(+4.90)#74 | 42.1%(+7.20)#5,505 |
| 75. | Lexington | 49.0% | 44.4%(+4.60)#75 | 42.1%(+6.90)#5,788 |
| 76. | Northborough | 49.0% | 44.4%(+4.60)#76 | 42.1%(+6.90)#5,794 |
| 77. | Marshfield | 49.0% | 44.4%(+4.60)#77 | 42.1%(+6.90)#5,797 |
| 78. | Ocean Grove | 49.0% | 44.4%(+4.60)#78 | 42.1%(+6.90)#5,807 |
| 79. | Townsend | 49.0% | 44.4%(+4.60)#79 | 42.1%(+6.90)#5,829 |
| 80. | Longmeadow | 48.9% | 44.4%(+4.50)#80 | 42.1%(+6.80)#5,886 |
| 81. | Sharon | 48.9% | 44.4%(+4.50)#81 | 42.1%(+6.80)#5,899 |
| 82. | Belmont | 48.8% | 44.4%(+4.40)#82 | 42.1%(+6.70)#5,974 |
| 83. | Millis Clicquot | 48.8% | 44.4%(+4.40)#83 | 42.1%(+6.70)#5,995 |
| 84. | South Dennis | 48.7% | 44.4%(+4.30)#84 | 42.1%(+6.60)#6,118 |
| 85. | Pocasset | 48.6% | 44.4%(+4.20)#85 | 42.1%(+6.50)#6,216 |
| 86. | Blandford | 48.4% | 44.4%(+4.00)#86 | 42.1%(+6.30)#6,503 |
| 87. | Winthrop Town | 48.3% | 44.4%(+3.90)#87 | 42.1%(+6.20)#6,534 |
| 88. | Kingston | 48.3% | 44.4%(+3.90)#88 | 42.1%(+6.20)#6,546 |
| 89. | Upton | 48.3% | 44.4%(+3.90)#89 | 42.1%(+6.20)#6,564 |
| 90. | Foxborough | 48.2% | 44.4%(+3.80)#90 | 42.1%(+6.10)#6,690 |
| 91. | North Pembroke | 48.2% | 44.4%(+3.80)#91 | 42.1%(+6.10)#6,710 |
| 92. | Northampton | 48.1% | 44.4%(+3.70)#92 | 42.1%(+6.00)#6,796 |
| 93. | Harwich Port | 48.1% | 44.4%(+3.70)#93 | 42.1%(+6.00)#6,840 |
| 94. | East Brookfield | 48.1% | 44.4%(+3.70)#94 | 42.1%(+6.00)#6,856 |
| 95. | Newton | 48.0% | 44.4%(+3.60)#95 | 42.1%(+5.90)#6,917 |
| 96. | Salisbury | 48.0% | 44.4%(+3.60)#96 | 42.1%(+5.90)#6,937 |
| 97. | North Scituate | 47.9% | 44.4%(+3.50)#97 | 42.1%(+5.80)#7,052 |
| 98. | Hingham | 47.9% | 44.4%(+3.50)#98 | 42.1%(+5.80)#7,053 |
| 99. | Marion Center | 47.9% | 44.4%(+3.50)#99 | 42.1%(+5.80)#7,091 |
| 100. | Milton | 47.8% | 44.4%(+3.40)#100 | 42.1%(+5.70)#7,136 |
Common Questions
What are the Top 10 Cities with the Highest Percentage of Population Driving Alone to Work in Massachusetts?
Top 10 Cities with the Highest Percentage of Population Driving Alone to Work in Massachusetts are:
#1
66.4%
#2
66.0%
#3
60.7%
#4
60.6%
#5
58.9%
#6
58.5%
#7
58.4%
#8
57.2%
#9
57.0%
#10
56.8%
What city has the Highest Percentage of Population Driving Alone to Work in Massachusetts?
Popponesset Island has the Highest Percentage of Population Driving Alone to Work in Massachusetts with 66.4%.
What is the Percentage of Population Driving Alone to Work in the State of Massachusetts?
Percentage of Population Driving Alone to Work in Massachusetts is 44.4%.
What is the Percentage of Population Driving Alone to Work in the United States?
Percentage of Population Driving Alone to Work in the United States is 42.1%.