Cities with the Highest Percentage of Population Driving Alone to Work in Connecticut
RELATED REPORTS & OPTIONS
Drive | Alone
Connecticut
Compare Cities
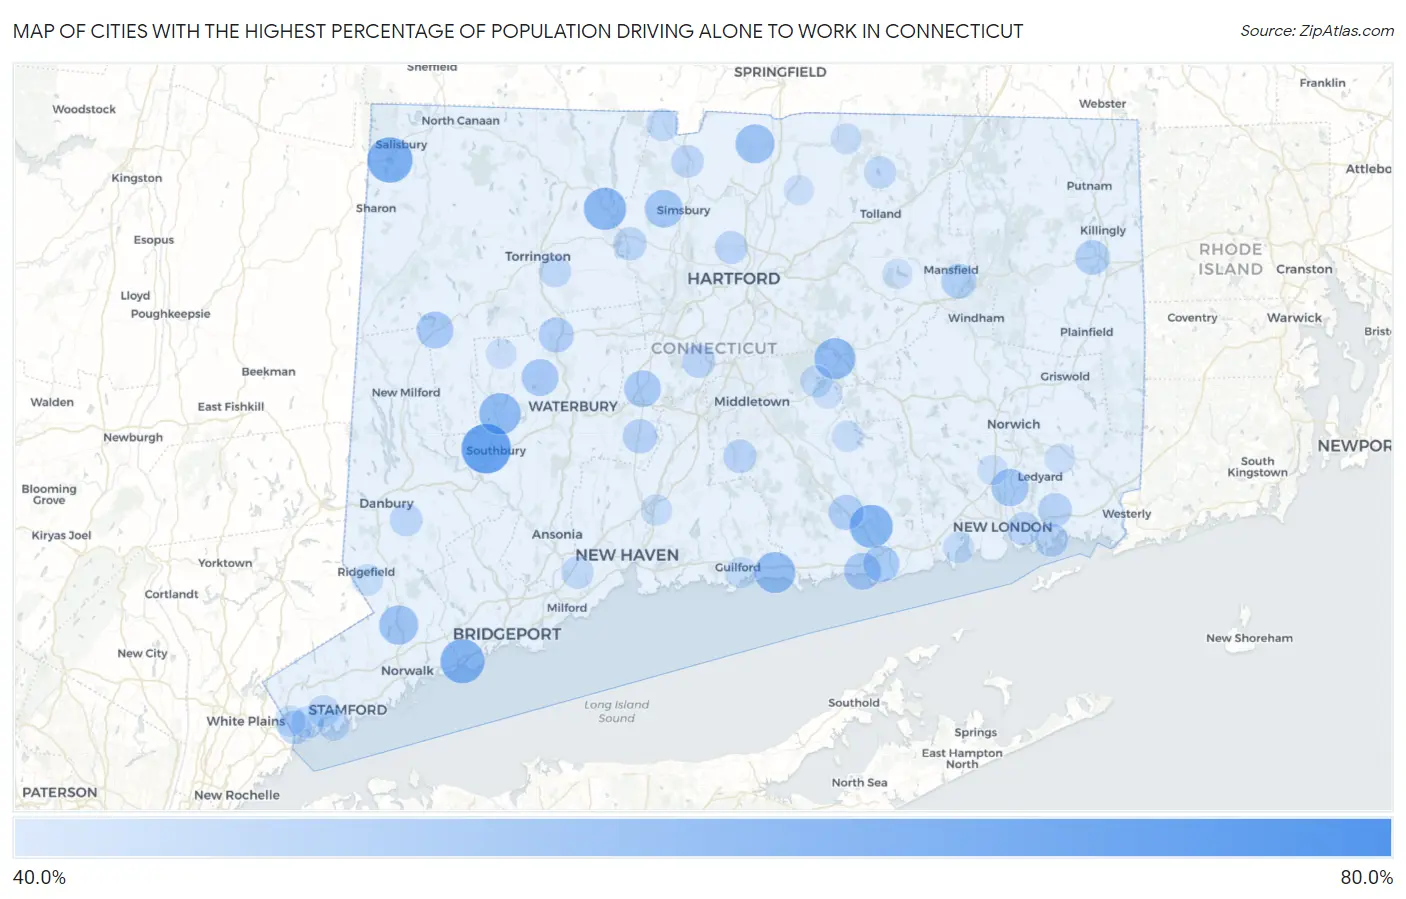
Map of Cities with the Highest Percentage of Population Driving Alone to Work in Connecticut
0.0%
80.0%
Cities with the Highest Percentage of Population Driving Alone to Work in Connecticut
| City | % Drive Alone | vs State | vs National | |
| 1. | Fenwick Borough | 68.0% | 44.5%(+23.5)#1 | 42.1%(+25.9)#68 |
| 2. | West Cornwall | 64.5% | 44.5%(+20.0)#2 | 42.1%(+22.4)#180 |
| 3. | Heritage Village | 63.2% | 44.5%(+18.7)#3 | 42.1%(+21.1)#259 |
| 4. | Rock Ridge | 61.7% | 44.5%(+17.2)#4 | 42.1%(+19.6)#394 |
| 5. | Weston | 60.3% | 44.5%(+15.8)#5 | 42.1%(+18.2)#582 |
| 6. | Lakeville | 59.5% | 44.5%(+15.0)#6 | 42.1%(+17.4)#696 |
| 7. | Indian Field | 59.4% | 44.5%(+14.9)#7 | 42.1%(+17.3)#723 |
| 8. | Southport | 58.6% | 44.5%(+14.1)#8 | 42.1%(+16.5)#880 |
| 9. | Botsford | 58.5% | 44.5%(+14.0)#9 | 42.1%(+16.4)#894 |
| 10. | Essex Village | 57.8% | 44.5%(+13.3)#10 | 42.1%(+15.7)#1,064 |
| 11. | Quasset Lake | 57.7% | 44.5%(+13.2)#11 | 42.1%(+15.6)#1,092 |
| 12. | Oronoque | 57.5% | 44.5%(+13.0)#12 | 42.1%(+15.4)#1,130 |
| 13. | Cornwall | 57.2% | 44.5%(+12.7)#13 | 42.1%(+15.1)#1,253 |
| 14. | New Hartford Center | 57.1% | 44.5%(+12.6)#14 | 42.1%(+15.0)#1,260 |
| 15. | Woodbury Center | 56.4% | 44.5%(+11.9)#15 | 42.1%(+14.3)#1,451 |
| 16. | Knollcrest | 56.2% | 44.5%(+11.7)#16 | 42.1%(+14.1)#1,552 |
| 17. | Terramuggus | 56.1% | 44.5%(+11.6)#17 | 42.1%(+14.0)#1,574 |
| 18. | Madison Center | 55.9% | 44.5%(+11.4)#18 | 42.1%(+13.8)#1,627 |
| 19. | Lakeside Woods | 55.5% | 44.5%(+11.0)#19 | 42.1%(+13.4)#1,736 |
| 20. | Mill Plain | 55.4% | 44.5%(+10.9)#20 | 42.1%(+13.3)#1,771 |
| 21. | Staples | 55.2% | 44.5%(+10.7)#21 | 42.1%(+13.1)#1,833 |
| 22. | Saugatuck | 54.9% | 44.5%(+10.4)#22 | 42.1%(+12.8)#1,949 |
| 23. | Noroton Heights | 54.7% | 44.5%(+10.2)#23 | 42.1%(+12.6)#2,003 |
| 24. | Coleytown | 54.6% | 44.5%(+10.1)#24 | 42.1%(+12.5)#2,040 |
| 25. | Taylor Corners | 54.6% | 44.5%(+10.1)#25 | 42.1%(+12.5)#2,052 |
| 26. | Bridgewater | 54.5% | 44.5%(+10.0)#26 | 42.1%(+12.4)#2,117 |
| 27. | Wilton Center | 54.4% | 44.5%(+9.90)#27 | 42.1%(+12.3)#2,142 |
| 28. | Candlewood Orchards | 54.3% | 44.5%(+9.80)#28 | 42.1%(+12.2)#2,187 |
| 29. | Suffield Depot | 54.2% | 44.5%(+9.70)#29 | 42.1%(+12.1)#2,235 |
| 30. | South Wilton | 54.0% | 44.5%(+9.50)#30 | 42.1%(+11.9)#2,313 |
| 31. | Plattsville | 53.8% | 44.5%(+9.30)#31 | 42.1%(+11.7)#2,390 |
| 32. | Lordship | 53.6% | 44.5%(+9.10)#32 | 42.1%(+11.5)#2,462 |
| 33. | Groton Long Point Borough | 53.6% | 44.5%(+9.10)#33 | 42.1%(+11.5)#2,476 |
| 34. | Stonington Borough | 53.5% | 44.5%(+9.00)#34 | 42.1%(+11.4)#2,510 |
| 35. | West Simsbury | 53.4% | 44.5%(+8.90)#35 | 42.1%(+11.3)#2,588 |
| 36. | Cornwall Bridge | 53.4% | 44.5%(+8.90)#36 | 42.1%(+11.3)#2,623 |
| 37. | Candlewood Knolls | 53.4% | 44.5%(+8.90)#37 | 42.1%(+11.3)#2,633 |
| 38. | New Canaan | 53.1% | 44.5%(+8.60)#38 | 42.1%(+11.0)#2,743 |
| 39. | Gales Ferry | 52.8% | 44.5%(+8.30)#39 | 42.1%(+10.7)#2,894 |
| 40. | Branchville | 52.7% | 44.5%(+8.20)#40 | 42.1%(+10.6)#2,964 |
| 41. | Watertown | 52.6% | 44.5%(+8.10)#41 | 42.1%(+10.5)#2,970 |
| 42. | Lakes West | 52.6% | 44.5%(+8.10)#42 | 42.1%(+10.5)#2,977 |
| 43. | Saybrook Manor | 52.6% | 44.5%(+8.10)#43 | 42.1%(+10.5)#2,979 |
| 44. | New Preston | 52.5% | 44.5%(+8.00)#44 | 42.1%(+10.4)#3,036 |
| 45. | Plantsville | 52.4% | 44.5%(+7.90)#45 | 42.1%(+10.3)#3,111 |
| 46. | East | 52.1% | 44.5%(+7.60)#46 | 42.1%(+10.00)#3,296 |
| 47. | Old Saybrook Center | 52.1% | 44.5%(+7.60)#47 | 42.1%(+10.00)#3,307 |
| 48. | Woodmont Borough | 52.1% | 44.5%(+7.60)#48 | 42.1%(+10.00)#3,311 |
| 49. | Brookfield Center | 52.0% | 44.5%(+7.50)#49 | 42.1%(+9.90)#3,400 |
| 50. | Stepney | 51.8% | 44.5%(+7.30)#50 | 42.1%(+9.70)#3,453 |
| 51. | Old Hill | 51.7% | 44.5%(+7.20)#51 | 42.1%(+9.60)#3,530 |
| 52. | Poplar Plains | 51.6% | 44.5%(+7.10)#52 | 42.1%(+9.50)#3,596 |
| 53. | Tashua | 51.5% | 44.5%(+7.00)#53 | 42.1%(+9.40)#3,640 |
| 54. | Tokeneke | 51.3% | 44.5%(+6.80)#54 | 42.1%(+9.20)#3,797 |
| 55. | Deep River Center | 51.1% | 44.5%(+6.60)#55 | 42.1%(+9.00)#3,956 |
| 56. | Thomaston | 51.1% | 44.5%(+6.60)#56 | 42.1%(+9.00)#3,959 |
| 57. | Bigelow Corners | 51.1% | 44.5%(+6.60)#57 | 42.1%(+9.00)#3,973 |
| 58. | Mansfield Center | 51.0% | 44.5%(+6.50)#58 | 42.1%(+8.90)#4,043 |
| 59. | East Brooklyn | 50.7% | 44.5%(+6.20)#59 | 42.1%(+8.60)#4,238 |
| 60. | Cheshire Village | 50.5% | 44.5%(+6.00)#60 | 42.1%(+8.40)#4,347 |
| 61. | Old Mystic | 50.1% | 44.5%(+5.60)#61 | 42.1%(+8.00)#4,739 |
| 62. | Dayville | 49.9% | 44.5%(+5.40)#62 | 42.1%(+7.80)#4,975 |
| 63. | Durham | 49.8% | 44.5%(+5.30)#63 | 42.1%(+7.70)#5,010 |
| 64. | Pemberwick | 49.8% | 44.5%(+5.30)#64 | 42.1%(+7.70)#5,013 |
| 65. | Kensington | 49.7% | 44.5%(+5.20)#65 | 42.1%(+7.60)#5,089 |
| 66. | Noank | 49.7% | 44.5%(+5.20)#66 | 42.1%(+7.60)#5,110 |
| 67. | Long Hill | 49.6% | 44.5%(+5.10)#67 | 42.1%(+7.50)#5,181 |
| 68. | Collinsville | 49.6% | 44.5%(+5.10)#68 | 42.1%(+7.50)#5,186 |
| 69. | Sandy Hook | 49.5% | 44.5%(+5.00)#69 | 42.1%(+7.40)#5,272 |
| 70. | Blue Hills | 49.4% | 44.5%(+4.90)#70 | 42.1%(+7.30)#5,432 |
| 71. | Bethel | 49.1% | 44.5%(+4.60)#71 | 42.1%(+7.00)#5,688 |
| 72. | Salmon Brook | 49.1% | 44.5%(+4.60)#72 | 42.1%(+7.00)#5,710 |
| 73. | Orange | 48.9% | 44.5%(+4.40)#73 | 42.1%(+6.80)#5,888 |
| 74. | Greenwich | 48.9% | 44.5%(+4.40)#74 | 42.1%(+6.80)#5,889 |
| 75. | Crystal Lake | 48.8% | 44.5%(+4.30)#75 | 42.1%(+6.70)#6,005 |
| 76. | North Granby | 48.8% | 44.5%(+4.30)#76 | 42.1%(+6.70)#6,011 |
| 77. | Cos Cob | 48.6% | 44.5%(+4.10)#77 | 42.1%(+6.50)#6,198 |
| 78. | Lake Pocotopaug | 48.6% | 44.5%(+4.10)#78 | 42.1%(+6.50)#6,203 |
| 79. | Northwest Harwinton | 48.6% | 44.5%(+4.10)#79 | 42.1%(+6.50)#6,212 |
| 80. | Candlewood Shores | 48.5% | 44.5%(+4.00)#80 | 42.1%(+6.40)#6,339 |
| 81. | Old Greenwich | 48.3% | 44.5%(+3.80)#81 | 42.1%(+6.20)#6,541 |
| 82. | Greens Farms | 48.1% | 44.5%(+3.60)#82 | 42.1%(+6.00)#6,825 |
| 83. | Ridgefield | 48.0% | 44.5%(+3.50)#83 | 42.1%(+5.90)#6,934 |
| 84. | Ridgebury | 48.0% | 44.5%(+3.50)#84 | 42.1%(+5.90)#6,958 |
| 85. | Topstone | 48.0% | 44.5%(+3.50)#85 | 42.1%(+5.90)#7,022 |
| 86. | North Haven | 47.9% | 44.5%(+3.40)#86 | 42.1%(+5.80)#7,039 |
| 87. | Niantic | 47.9% | 44.5%(+3.40)#87 | 42.1%(+5.80)#7,064 |
| 88. | Glenville | 47.9% | 44.5%(+3.40)#88 | 42.1%(+5.80)#7,066 |
| 89. | Guilford Center | 47.9% | 44.5%(+3.40)#89 | 42.1%(+5.80)#7,069 |
| 90. | Moodus | 47.8% | 44.5%(+3.30)#90 | 42.1%(+5.70)#7,173 |
| 91. | Somers | 47.6% | 44.5%(+3.10)#91 | 42.1%(+5.50)#7,401 |
| 92. | Candlewood Isle | 47.6% | 44.5%(+3.10)#92 | 42.1%(+5.50)#7,447 |
| 93. | Lakes East | 47.5% | 44.5%(+3.00)#93 | 42.1%(+5.40)#7,531 |
| 94. | Bethlehem Village | 47.4% | 44.5%(+2.90)#94 | 42.1%(+5.30)#7,698 |
| 95. | Oxoboxo River | 47.2% | 44.5%(+2.70)#95 | 42.1%(+5.10)#7,965 |
| 96. | Mashantucket | 47.2% | 44.5%(+2.70)#96 | 42.1%(+5.10)#8,049 |
| 97. | Broad Brook | 47.0% | 44.5%(+2.50)#97 | 42.1%(+4.90)#8,226 |
| 98. | East Hampton | 47.0% | 44.5%(+2.50)#98 | 42.1%(+4.90)#8,237 |
| 99. | Coventry Lake | 47.0% | 44.5%(+2.50)#99 | 42.1%(+4.90)#8,245 |
| 100. | Litchfield Borough | 47.0% | 44.5%(+2.50)#100 | 42.1%(+4.90)#8,255 |
Common Questions
What are the Top 10 Cities with the Highest Percentage of Population Driving Alone to Work in Connecticut?
Top 10 Cities with the Highest Percentage of Population Driving Alone to Work in Connecticut are:
#1
63.2%
#2
59.5%
#3
58.6%
#4
57.8%
#5
57.1%
#6
56.4%
#7
56.1%
#8
55.9%
#9
54.4%
#10
54.2%
What city has the Highest Percentage of Population Driving Alone to Work in Connecticut?
Heritage Village has the Highest Percentage of Population Driving Alone to Work in Connecticut with 63.2%.
What is the Percentage of Population Driving Alone to Work in the State of Connecticut?
Percentage of Population Driving Alone to Work in Connecticut is 44.5%.
What is the Percentage of Population Driving Alone to Work in the United States?
Percentage of Population Driving Alone to Work in the United States is 42.1%.