Cities with the Highest Percentage of Population Driving Alone to Work in Oklahoma
RELATED REPORTS & OPTIONS
Drive | Alone
Oklahoma
Compare Cities
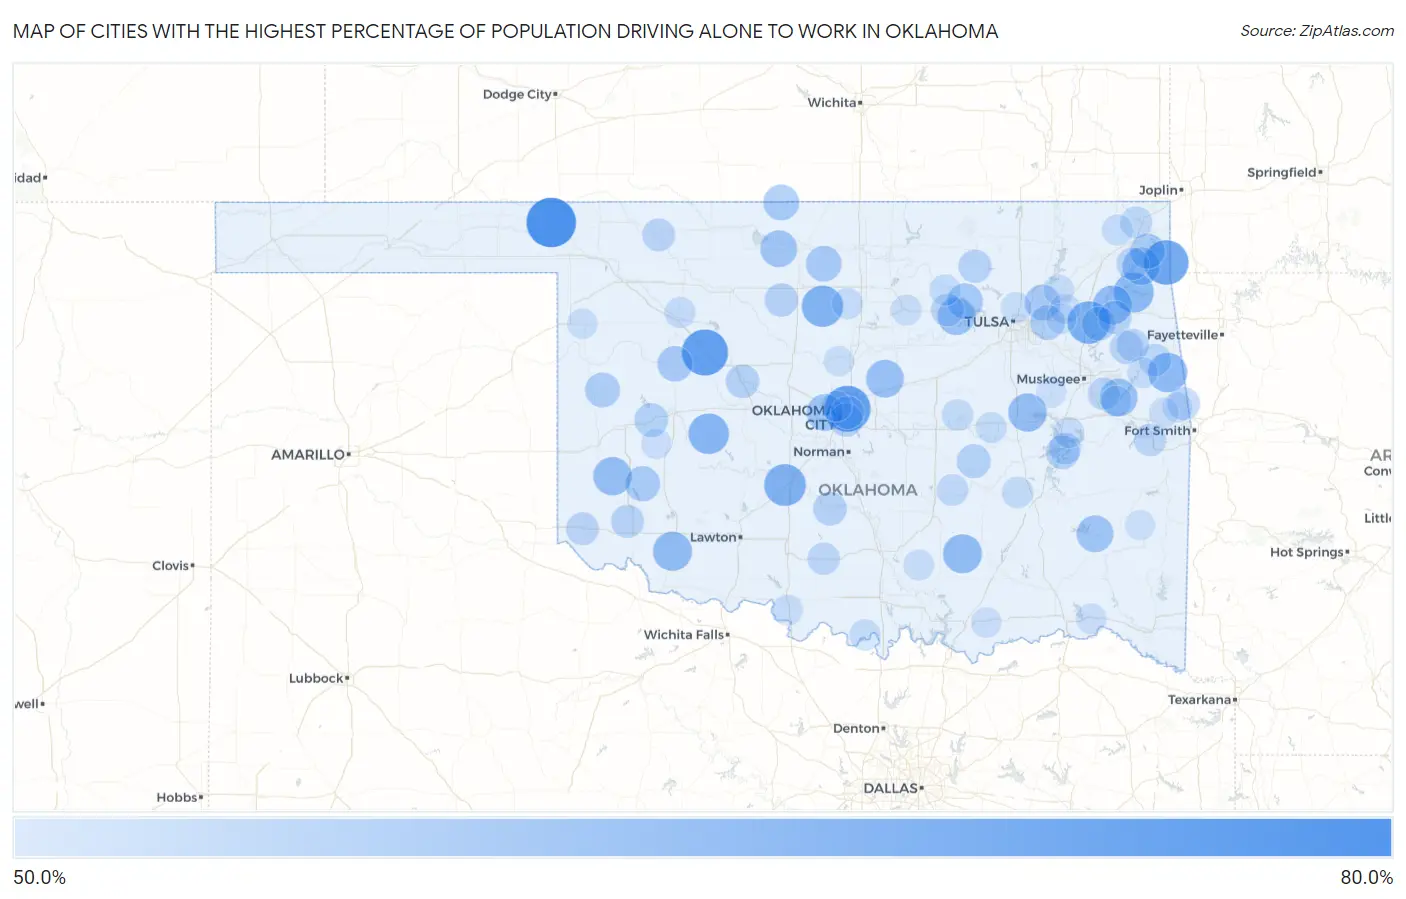
Map of Cities with the Highest Percentage of Population Driving Alone to Work in Oklahoma
0.0%
80.0%
Cities with the Highest Percentage of Population Driving Alone to Work in Oklahoma
| City | % Drive Alone | vs State | vs National | |
| 1. | Gate | 74.2% | 40.9%(+33.3)#1 | 42.1%(+32.1)#12 |
| 2. | Oakwood | 70.0% | 40.9%(+29.1)#2 | 42.1%(+27.9)#42 |
| 3. | Lake Aluma | 69.7% | 40.9%(+28.8)#3 | 42.1%(+27.6)#43 |
| 4. | Dodge | 68.0% | 40.9%(+27.1)#4 | 42.1%(+25.9)#67 |
| 5. | Mazie | 65.5% | 40.9%(+24.6)#5 | 42.1%(+23.4)#136 |
| 6. | Norge | 64.5% | 40.9%(+23.6)#6 | 42.1%(+22.4)#175 |
| 7. | Douglas | 64.0% | 40.9%(+23.1)#7 | 42.1%(+21.9)#218 |
| 8. | Colony | 63.0% | 40.9%(+22.1)#8 | 42.1%(+20.9)#286 |
| 9. | Sand Point | 62.5% | 40.9%(+21.6)#9 | 42.1%(+20.4)#309 |
| 10. | Old Eucha | 62.3% | 40.9%(+21.4)#10 | 42.1%(+20.2)#345 |
| 11. | Hochatown | 61.8% | 40.9%(+20.9)#11 | 42.1%(+19.7)#387 |
| 12. | Zion | 61.8% | 40.9%(+20.9)#12 | 42.1%(+19.7)#390 |
| 13. | Manitou | 61.3% | 40.9%(+20.4)#13 | 42.1%(+19.2)#439 |
| 14. | Clarita | 61.2% | 40.9%(+20.3)#14 | 42.1%(+19.1)#462 |
| 15. | Pump Back | 61.0% | 40.9%(+20.1)#15 | 42.1%(+18.9)#491 |
| 16. | Willow | 60.5% | 40.9%(+19.6)#16 | 42.1%(+18.4)#545 |
| 17. | Grayson | 60.5% | 40.9%(+19.6)#17 | 42.1%(+18.4)#548 |
| 18. | Paradise Hill | 59.5% | 40.9%(+18.6)#18 | 42.1%(+17.4)#703 |
| 19. | Fallis | 59.5% | 40.9%(+18.6)#19 | 42.1%(+17.4)#711 |
| 20. | Terlton | 59.4% | 40.9%(+18.5)#20 | 42.1%(+17.3)#735 |
| 21. | Dennis | 59.3% | 40.9%(+18.4)#21 | 42.1%(+17.2)#753 |
| 22. | Nash | 58.5% | 40.9%(+17.6)#22 | 42.1%(+16.4)#912 |
| 23. | Tuskahoma | 58.5% | 40.9%(+17.6)#23 | 42.1%(+16.4)#918 |
| 24. | Woodlawn Park | 58.3% | 40.9%(+17.4)#24 | 42.1%(+16.2)#974 |
| 25. | Sparrowhawk | 58.2% | 40.9%(+17.3)#25 | 42.1%(+16.1)#1,004 |
| 26. | Taylor Ferry | 58.0% | 40.9%(+17.1)#26 | 42.1%(+15.9)#1,036 |
| 27. | Osage | 57.2% | 40.9%(+16.3)#27 | 42.1%(+15.1)#1,252 |
| 28. | Manchester | 57.1% | 40.9%(+16.2)#28 | 42.1%(+15.0)#1,285 |
| 29. | Valley Park | 57.0% | 40.9%(+16.1)#29 | 42.1%(+14.9)#1,312 |
| 30. | Hunter | 56.9% | 40.9%(+16.0)#30 | 42.1%(+14.8)#1,318 |
| 31. | Putnam | 56.7% | 40.9%(+15.8)#31 | 42.1%(+14.6)#1,369 |
| 32. | Copeland | 56.5% | 40.9%(+15.6)#32 | 42.1%(+14.4)#1,396 |
| 33. | Lone Wolf | 56.5% | 40.9%(+15.6)#33 | 42.1%(+14.4)#1,411 |
| 34. | Strong City | 56.1% | 40.9%(+15.2)#34 | 42.1%(+14.0)#1,594 |
| 35. | Fair Oaks | 55.8% | 40.9%(+14.9)#35 | 42.1%(+13.7)#1,661 |
| 36. | Cookson | 55.6% | 40.9%(+14.7)#36 | 42.1%(+13.5)#1,695 |
| 37. | Oak Hill-Piney | 55.4% | 40.9%(+14.5)#37 | 42.1%(+13.3)#1,787 |
| 38. | Chance | 55.1% | 40.9%(+14.2)#38 | 42.1%(+13.0)#1,898 |
| 39. | Yeager | 55.0% | 40.9%(+14.1)#39 | 42.1%(+12.9)#1,937 |
| 40. | Murphy | 54.9% | 40.9%(+14.0)#40 | 42.1%(+12.8)#1,962 |
| 41. | Foss | 54.8% | 40.9%(+13.9)#41 | 42.1%(+12.7)#1,986 |
| 42. | Greenfield | 54.6% | 40.9%(+13.7)#42 | 42.1%(+12.5)#2,065 |
| 43. | Erin Springs | 54.6% | 40.9%(+13.7)#43 | 42.1%(+12.5)#2,067 |
| 44. | Carlton Landing | 54.5% | 40.9%(+13.6)#44 | 42.1%(+12.4)#2,128 |
| 45. | Drummond | 54.4% | 40.9%(+13.5)#45 | 42.1%(+12.3)#2,154 |
| 46. | Smith Village | 54.4% | 40.9%(+13.5)#46 | 42.1%(+12.3)#2,170 |
| 47. | Snake Creek | 54.3% | 40.9%(+13.4)#47 | 42.1%(+12.2)#2,199 |
| 48. | Wynona | 54.0% | 40.9%(+13.1)#48 | 42.1%(+11.9)#2,331 |
| 49. | Martha | 54.0% | 40.9%(+13.1)#49 | 42.1%(+11.9)#2,336 |
| 50. | Forest Park | 53.9% | 40.9%(+13.0)#50 | 42.1%(+11.8)#2,356 |
| 51. | Gould | 53.8% | 40.9%(+12.9)#51 | 42.1%(+11.7)#2,411 |
| 52. | Grandview | 53.7% | 40.9%(+12.8)#52 | 42.1%(+11.6)#2,429 |
| 53. | Freedom | 53.7% | 40.9%(+12.8)#53 | 42.1%(+11.6)#2,450 |
| 54. | Hough | 53.7% | 40.9%(+12.8)#54 | 42.1%(+11.6)#2,458 |
| 55. | Short | 53.6% | 40.9%(+12.7)#55 | 42.1%(+11.5)#2,483 |
| 56. | Hallett | 53.6% | 40.9%(+12.7)#56 | 42.1%(+11.5)#2,492 |
| 57. | Titanic | 53.3% | 40.9%(+12.4)#57 | 42.1%(+11.2)#2,675 |
| 58. | Cowlington | 53.3% | 40.9%(+12.4)#58 | 42.1%(+11.2)#2,696 |
| 59. | Lone Chimney | 53.3% | 40.9%(+12.4)#59 | 42.1%(+11.2)#2,699 |
| 60. | Avard | 53.3% | 40.9%(+12.4)#60 | 42.1%(+11.2)#2,701 |
| 61. | Cleora | 53.2% | 40.9%(+12.3)#61 | 42.1%(+11.1)#2,712 |
| 62. | Velma | 53.2% | 40.9%(+12.3)#62 | 42.1%(+11.1)#2,721 |
| 63. | Steely Hollow | 53.2% | 40.9%(+12.3)#63 | 42.1%(+11.1)#2,732 |
| 64. | Sand Hill | 53.1% | 40.9%(+12.2)#64 | 42.1%(+11.0)#2,786 |
| 65. | Longtown | 52.8% | 40.9%(+11.9)#65 | 42.1%(+10.7)#2,885 |
| 66. | Cumberland | 52.8% | 40.9%(+11.9)#66 | 42.1%(+10.7)#2,901 |
| 67. | Dotyville | 52.7% | 40.9%(+11.8)#67 | 42.1%(+10.6)#2,963 |
| 68. | Sasakwa | 52.5% | 40.9%(+11.6)#68 | 42.1%(+10.4)#3,082 |
| 69. | Boley | 52.2% | 40.9%(+11.3)#69 | 42.1%(+10.1)#3,254 |
| 70. | Arpelar | 52.1% | 40.9%(+11.2)#70 | 42.1%(+10.00)#3,338 |
| 71. | Norwood | 51.8% | 40.9%(+10.9)#71 | 42.1%(+9.70)#3,463 |
| 72. | Burneyville | 51.8% | 40.9%(+10.9)#72 | 42.1%(+9.70)#3,473 |
| 73. | Blackburn | 51.8% | 40.9%(+10.9)#73 | 42.1%(+9.70)#3,508 |
| 74. | Chester | 51.8% | 40.9%(+10.9)#74 | 42.1%(+9.70)#3,513 |
| 75. | Peckham | 51.8% | 40.9%(+10.9)#75 | 42.1%(+9.70)#3,515 |
| 76. | Bluejacket | 51.7% | 40.9%(+10.8)#76 | 42.1%(+9.60)#3,557 |
| 77. | Lucien | 51.7% | 40.9%(+10.8)#77 | 42.1%(+9.60)#3,563 |
| 78. | Clearview | 51.6% | 40.9%(+10.7)#78 | 42.1%(+9.50)#3,629 |
| 79. | Notchietown | 51.5% | 40.9%(+10.6)#79 | 42.1%(+9.40)#3,678 |
| 80. | Sugden | 51.5% | 40.9%(+10.6)#80 | 42.1%(+9.40)#3,711 |
| 81. | Glencoe | 51.4% | 40.9%(+10.5)#81 | 42.1%(+9.30)#3,753 |
| 82. | Tenkiller | 51.4% | 40.9%(+10.5)#82 | 42.1%(+9.30)#3,766 |
| 83. | Nichols Hills | 51.3% | 40.9%(+10.4)#83 | 42.1%(+9.20)#3,789 |
| 84. | Texanna | 51.3% | 40.9%(+10.4)#84 | 42.1%(+9.20)#3,798 |
| 85. | Sequoyah | 51.3% | 40.9%(+10.4)#85 | 42.1%(+9.20)#3,818 |
| 86. | Mill Creek | 51.3% | 40.9%(+10.4)#86 | 42.1%(+9.20)#3,845 |
| 87. | Turley | 51.2% | 40.9%(+10.3)#87 | 42.1%(+9.10)#3,885 |
| 88. | Fittstown | 51.1% | 40.9%(+10.2)#88 | 42.1%(+9.00)#4,018 |
| 89. | Fort Towson | 51.0% | 40.9%(+10.1)#89 | 42.1%(+8.90)#4,058 |
| 90. | Dill City | 51.0% | 40.9%(+10.1)#90 | 42.1%(+8.90)#4,069 |
| 91. | Cedar Valley | 50.9% | 40.9%(+10.0)#91 | 42.1%(+8.80)#4,127 |
| 92. | Tiawah | 50.9% | 40.9%(+10.0)#92 | 42.1%(+8.80)#4,140 |
| 93. | Arnett | 50.8% | 40.9%(+9.90)#93 | 42.1%(+8.70)#4,186 |
| 94. | Belfonte | 50.8% | 40.9%(+9.90)#94 | 42.1%(+8.70)#4,206 |
| 95. | Blue | 50.8% | 40.9%(+9.90)#95 | 42.1%(+8.70)#4,224 |
| 96. | Fox | 50.8% | 40.9%(+9.90)#96 | 42.1%(+8.70)#4,226 |
| 97. | Gregory | 50.7% | 40.9%(+9.80)#97 | 42.1%(+8.60)#4,257 |
| 98. | Boynton | 50.7% | 40.9%(+9.80)#98 | 42.1%(+8.60)#4,270 |
| 99. | Whitesboro | 50.7% | 40.9%(+9.80)#99 | 42.1%(+8.60)#4,271 |
| 100. | Akins | 50.6% | 40.9%(+9.70)#100 | 42.1%(+8.50)#4,316 |
Common Questions
What are the Top 10 Cities with the Highest Percentage of Population Driving Alone to Work in Oklahoma?
Top 10 Cities with the Highest Percentage of Population Driving Alone to Work in Oklahoma are:
What city has the Highest Percentage of Population Driving Alone to Work in Oklahoma?
Gate has the Highest Percentage of Population Driving Alone to Work in Oklahoma with 74.2%.
What is the Percentage of Population Driving Alone to Work in the State of Oklahoma?
Percentage of Population Driving Alone to Work in Oklahoma is 40.9%.
What is the Percentage of Population Driving Alone to Work in the United States?
Percentage of Population Driving Alone to Work in the United States is 42.1%.