Cities with the Highest Percentage of Population Driving Alone to Work in Ohio
RELATED REPORTS & OPTIONS
Drive | Alone
Ohio
Compare Cities
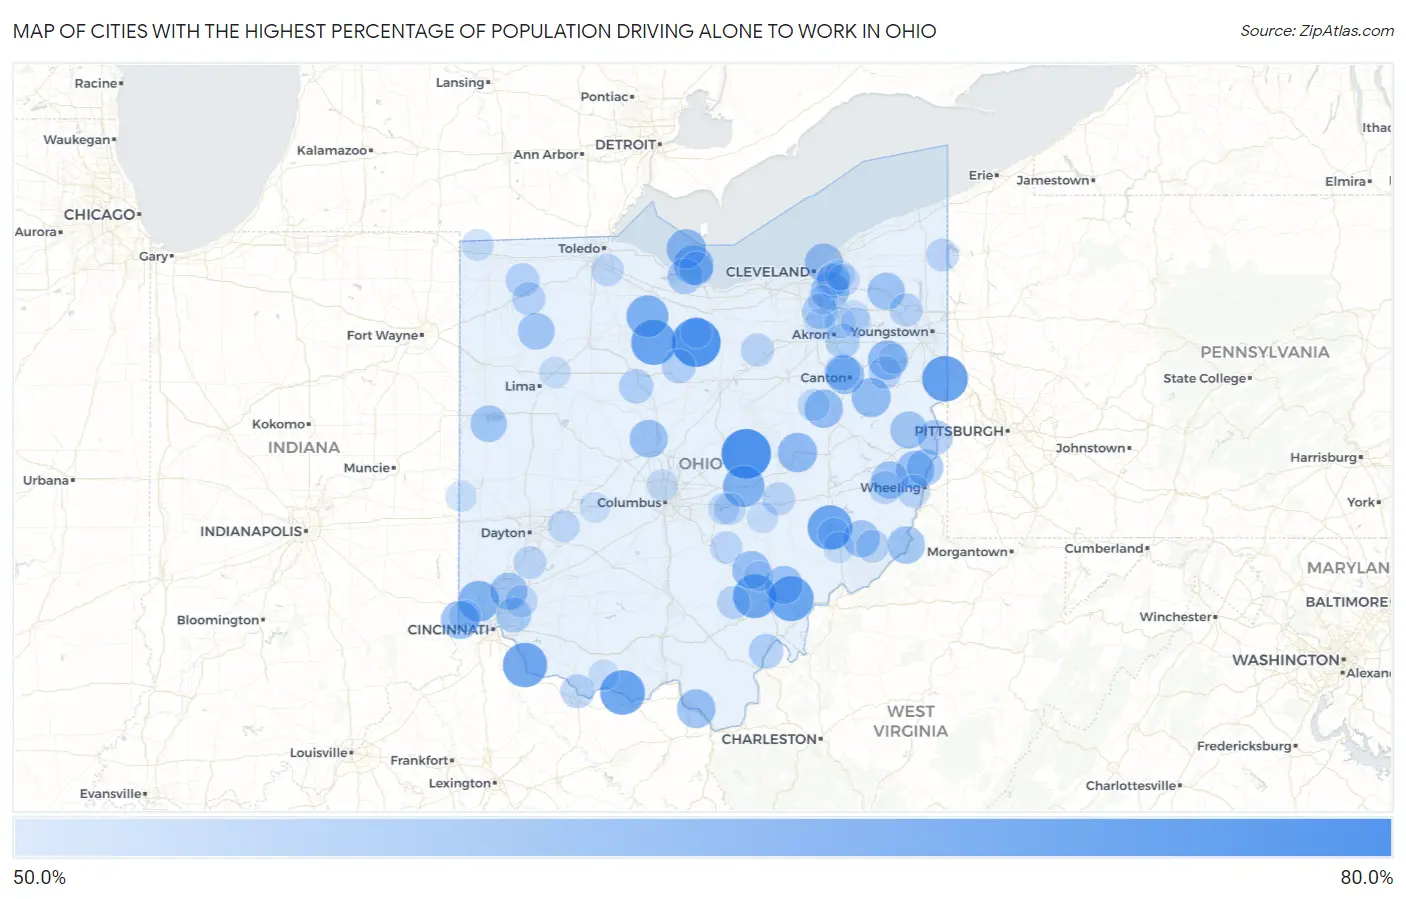
Map of Cities with the Highest Percentage of Population Driving Alone to Work in Ohio
0.0%
80.0%
Cities with the Highest Percentage of Population Driving Alone to Work in Ohio
| City | % Drive Alone | vs State | vs National | |
| 1. | Bladensburg | 66.2% | 42.6%(+23.6)#1 | 42.1%(+24.1)#112 |
| 2. | Birmingham | 66.2% | 42.6%(+23.6)#2 | 42.1%(+24.1)#113 |
| 3. | Celeryville | 65.6% | 42.6%(+23.0)#3 | 42.1%(+23.5)#130 |
| 4. | Negley | 63.1% | 42.6%(+20.5)#4 | 42.1%(+21.0)#273 |
| 5. | Melmore | 62.7% | 42.6%(+20.1)#5 | 42.1%(+20.6)#300 |
| 6. | Stewart | 62.5% | 42.6%(+19.9)#6 | 42.1%(+20.4)#307 |
| 7. | Belle Valley | 62.3% | 42.6%(+19.7)#7 | 42.1%(+20.2)#339 |
| 8. | Rome Stout | 62.3% | 42.6%(+19.7)#8 | 42.1%(+20.2)#344 |
| 9. | Moscow | 62.1% | 42.6%(+19.5)#9 | 42.1%(+20.0)#365 |
| 10. | New Marshfield | 61.6% | 42.6%(+19.0)#10 | 42.1%(+19.5)#402 |
| 11. | Fort Seneca | 60.2% | 42.6%(+17.6)#11 | 42.1%(+18.1)#612 |
| 12. | Hamburg | 59.9% | 42.6%(+17.3)#12 | 42.1%(+17.8)#654 |
| 13. | Marne | 59.9% | 42.6%(+17.3)#13 | 42.1%(+17.8)#655 |
| 14. | Dunlap | 59.4% | 42.6%(+16.8)#14 | 42.1%(+17.3)#717 |
| 15. | Lakeside | 58.3% | 42.6%(+15.7)#15 | 42.1%(+16.2)#958 |
| 16. | Canal Lewisville | 58.1% | 42.6%(+15.5)#16 | 42.1%(+16.0)#1,016 |
| 17. | Maple Ridge | 58.1% | 42.6%(+15.5)#17 | 42.1%(+16.0)#1,018 |
| 18. | Put In Bay | 58.1% | 42.6%(+15.5)#18 | 42.1%(+16.0)#1,029 |
| 19. | Lake Mohawk | 58.0% | 42.6%(+15.4)#19 | 42.1%(+15.9)#1,033 |
| 20. | Jacksontown | 57.7% | 42.6%(+15.1)#20 | 42.1%(+15.6)#1,096 |
| 21. | Dundee | 57.5% | 42.6%(+14.9)#21 | 42.1%(+15.4)#1,145 |
| 22. | Hanging Rock | 57.5% | 42.6%(+14.9)#22 | 42.1%(+15.4)#1,153 |
| 23. | New Haven Cdp Hamilton County | 57.5% | 42.6%(+14.9)#23 | 42.1%(+15.4)#1,156 |
| 24. | Meyers Lake | 57.4% | 42.6%(+14.8)#24 | 42.1%(+15.3)#1,176 |
| 25. | Elizabethtown | 57.4% | 42.6%(+14.8)#25 | 42.1%(+15.3)#1,188 |
| 26. | Mount Pleasant | 57.2% | 42.6%(+14.6)#26 | 42.1%(+15.1)#1,248 |
| 27. | Amesville | 57.2% | 42.6%(+14.6)#27 | 42.1%(+15.1)#1,251 |
| 28. | Walton Hills | 57.1% | 42.6%(+14.5)#28 | 42.1%(+15.0)#1,257 |
| 29. | Bratenahl | 57.1% | 42.6%(+14.5)#29 | 42.1%(+15.0)#1,259 |
| 30. | Carbon Hill | 57.1% | 42.6%(+14.5)#30 | 42.1%(+15.0)#1,286 |
| 31. | Madison Place | 57.0% | 42.6%(+14.4)#31 | 42.1%(+14.9)#1,302 |
| 32. | Radnor | 57.0% | 42.6%(+14.4)#32 | 42.1%(+14.9)#1,305 |
| 33. | Hannibal | 56.7% | 42.6%(+14.1)#33 | 42.1%(+14.6)#1,365 |
| 34. | Wetherington | 56.5% | 42.6%(+13.9)#34 | 42.1%(+14.4)#1,397 |
| 35. | Lafferty | 56.5% | 42.6%(+13.9)#35 | 42.1%(+14.4)#1,436 |
| 36. | Parkman | 56.4% | 42.6%(+13.8)#36 | 42.1%(+14.3)#1,480 |
| 37. | East Springfield | 56.4% | 42.6%(+13.8)#37 | 42.1%(+14.3)#1,481 |
| 38. | Stafford | 56.4% | 42.6%(+13.8)#38 | 42.1%(+14.3)#1,487 |
| 39. | Miller City | 56.1% | 42.6%(+13.5)#39 | 42.1%(+14.0)#1,588 |
| 40. | Connorville | 56.1% | 42.6%(+13.5)#40 | 42.1%(+14.0)#1,589 |
| 41. | Montezuma | 56.0% | 42.6%(+13.4)#41 | 42.1%(+13.9)#1,617 |
| 42. | Hills And Dales | 55.5% | 42.6%(+12.9)#42 | 42.1%(+13.4)#1,743 |
| 43. | Lloydsville | 55.2% | 42.6%(+12.6)#43 | 42.1%(+13.1)#1,851 |
| 44. | Richfield | 55.1% | 42.6%(+12.5)#44 | 42.1%(+13.0)#1,870 |
| 45. | Pottery Addition | 55.1% | 42.6%(+12.5)#45 | 42.1%(+13.0)#1,906 |
| 46. | Bay View | 55.0% | 42.6%(+12.4)#46 | 42.1%(+12.9)#1,919 |
| 47. | Petersburg | 55.0% | 42.6%(+12.4)#47 | 42.1%(+12.9)#1,926 |
| 48. | The Village Of Indian Hill | 54.9% | 42.6%(+12.3)#48 | 42.1%(+12.8)#1,947 |
| 49. | Saybrook-On-The-Lake | 54.7% | 42.6%(+12.1)#49 | 42.1%(+12.6)#2,010 |
| 50. | Cheshire | 54.5% | 42.6%(+11.9)#50 | 42.1%(+12.4)#2,119 |
| 51. | Sawyerwood | 54.4% | 42.6%(+11.8)#51 | 42.1%(+12.3)#2,143 |
| 52. | Harpster | 54.3% | 42.6%(+11.7)#52 | 42.1%(+12.2)#2,203 |
| 53. | Marblehead | 54.1% | 42.6%(+11.5)#53 | 42.1%(+12.0)#2,273 |
| 54. | Guilford Lake | 54.1% | 42.6%(+11.5)#54 | 42.1%(+12.0)#2,274 |
| 55. | Sulphur Springs | 54.1% | 42.6%(+11.5)#55 | 42.1%(+12.0)#2,297 |
| 56. | Aberdeen | 54.0% | 42.6%(+11.4)#56 | 42.1%(+11.9)#2,316 |
| 57. | North Randall | 54.0% | 42.6%(+11.4)#57 | 42.1%(+11.9)#2,318 |
| 58. | Ridgeville Corners | 53.9% | 42.6%(+11.3)#58 | 42.1%(+11.8)#2,364 |
| 59. | Leavittsburg | 53.5% | 42.6%(+10.9)#59 | 42.1%(+11.4)#2,507 |
| 60. | Zaleski | 53.5% | 42.6%(+10.9)#60 | 42.1%(+11.4)#2,532 |
| 61. | Florida | 53.5% | 42.6%(+10.9)#61 | 42.1%(+11.4)#2,541 |
| 62. | Cinnamon Lake | 53.4% | 42.6%(+10.8)#62 | 42.1%(+11.3)#2,599 |
| 63. | Jersey | 53.4% | 42.6%(+10.8)#63 | 42.1%(+11.3)#2,615 |
| 64. | North Zanesville | 53.3% | 42.6%(+10.7)#64 | 42.1%(+11.2)#2,645 |
| 65. | Morristown | 53.3% | 42.6%(+10.7)#65 | 42.1%(+11.2)#2,688 |
| 66. | Five Points | 53.2% | 42.6%(+10.6)#66 | 42.1%(+11.1)#2,711 |
| 67. | Highland Hills | 53.2% | 42.6%(+10.6)#67 | 42.1%(+11.1)#2,717 |
| 68. | Homeworth | 53.2% | 42.6%(+10.6)#68 | 42.1%(+11.1)#2,719 |
| 69. | Graysville | 53.2% | 42.6%(+10.6)#69 | 42.1%(+11.1)#2,740 |
| 70. | Neffs | 53.1% | 42.6%(+10.5)#70 | 42.1%(+11.0)#2,760 |
| 71. | Andover | 53.1% | 42.6%(+10.5)#71 | 42.1%(+11.0)#2,771 |
| 72. | Hide A Way Hills | 52.9% | 42.6%(+10.3)#72 | 42.1%(+10.8)#2,855 |
| 73. | Stony Ridge | 52.9% | 42.6%(+10.3)#73 | 42.1%(+10.8)#2,859 |
| 74. | Loveland Park | 52.8% | 42.6%(+10.2)#74 | 42.1%(+10.7)#2,888 |
| 75. | Hooven | 52.8% | 42.6%(+10.2)#75 | 42.1%(+10.7)#2,904 |
| 76. | Yellow Springs | 52.6% | 42.6%(+10.0)#76 | 42.1%(+10.5)#2,971 |
| 77. | Moreland Hills | 52.6% | 42.6%(+10.0)#77 | 42.1%(+10.5)#2,972 |
| 78. | Thornport | 52.6% | 42.6%(+10.0)#78 | 42.1%(+10.5)#2,981 |
| 79. | Reno Beach | 52.6% | 42.6%(+10.0)#79 | 42.1%(+10.5)#2,993 |
| 80. | Winesburg | 52.6% | 42.6%(+10.0)#80 | 42.1%(+10.5)#3,003 |
| 81. | Blaine | 52.5% | 42.6%(+9.90)#81 | 42.1%(+10.4)#3,048 |
| 82. | Lake Seneca | 52.4% | 42.6%(+9.80)#82 | 42.1%(+10.3)#3,130 |
| 83. | Caldwell | 52.3% | 42.6%(+9.70)#83 | 42.1%(+10.2)#3,170 |
| 84. | Fairfield Beach | 52.3% | 42.6%(+9.70)#84 | 42.1%(+10.2)#3,178 |
| 85. | Riverlea | 52.2% | 42.6%(+9.60)#85 | 42.1%(+10.1)#3,269 |
| 86. | Sugar Bush Knolls | 52.2% | 42.6%(+9.60)#86 | 42.1%(+10.1)#3,273 |
| 87. | Fultonham | 52.2% | 42.6%(+9.60)#87 | 42.1%(+10.1)#3,286 |
| 88. | Silver Lake | 52.1% | 42.6%(+9.50)#88 | 42.1%(+10.00)#3,302 |
| 89. | Beaverdam | 52.0% | 42.6%(+9.40)#89 | 42.1%(+9.90)#3,393 |
| 90. | Dexter City | 52.0% | 42.6%(+9.40)#90 | 42.1%(+9.90)#3,406 |
| 91. | Montrose Ghent | 51.9% | 42.6%(+9.30)#91 | 42.1%(+9.80)#3,417 |
| 92. | Holiday Lakes | 51.9% | 42.6%(+9.30)#92 | 42.1%(+9.80)#3,431 |
| 93. | Hollansburg | 51.8% | 42.6%(+9.20)#93 | 42.1%(+9.70)#3,496 |
| 94. | Pepper Pike | 51.7% | 42.6%(+9.10)#94 | 42.1%(+9.60)#3,521 |
| 95. | West Union | 51.6% | 42.6%(+9.00)#95 | 42.1%(+9.50)#3,584 |
| 96. | South Vienna | 51.5% | 42.6%(+8.90)#96 | 42.1%(+9.40)#3,666 |
| 97. | Brady Lake | 51.4% | 42.6%(+8.80)#97 | 42.1%(+9.30)#3,742 |
| 98. | Beloit | 51.3% | 42.6%(+8.70)#98 | 42.1%(+9.20)#3,808 |
| 99. | Buchtel | 51.3% | 42.6%(+8.70)#99 | 42.1%(+9.20)#3,833 |
| 100. | Brecksville | 51.1% | 42.6%(+8.50)#100 | 42.1%(+9.00)#3,941 |
Common Questions
What are the Top 10 Cities with the Highest Percentage of Population Driving Alone to Work in Ohio?
Top 10 Cities with the Highest Percentage of Population Driving Alone to Work in Ohio are:
#1
66.2%
#2
65.6%
#3
63.1%
#4
62.7%
#5
62.5%
#6
62.3%
#7
62.3%
#8
62.1%
#9
61.6%
#10
60.2%
What city has the Highest Percentage of Population Driving Alone to Work in Ohio?
Bladensburg has the Highest Percentage of Population Driving Alone to Work in Ohio with 66.2%.
What is the Percentage of Population Driving Alone to Work in the State of Ohio?
Percentage of Population Driving Alone to Work in Ohio is 42.6%.
What is the Percentage of Population Driving Alone to Work in the United States?
Percentage of Population Driving Alone to Work in the United States is 42.1%.