Cities with the Highest Percentage of Population Driving Alone to Work in Pennsylvania
RELATED REPORTS & OPTIONS
Drive | Alone
Pennsylvania
Compare Cities
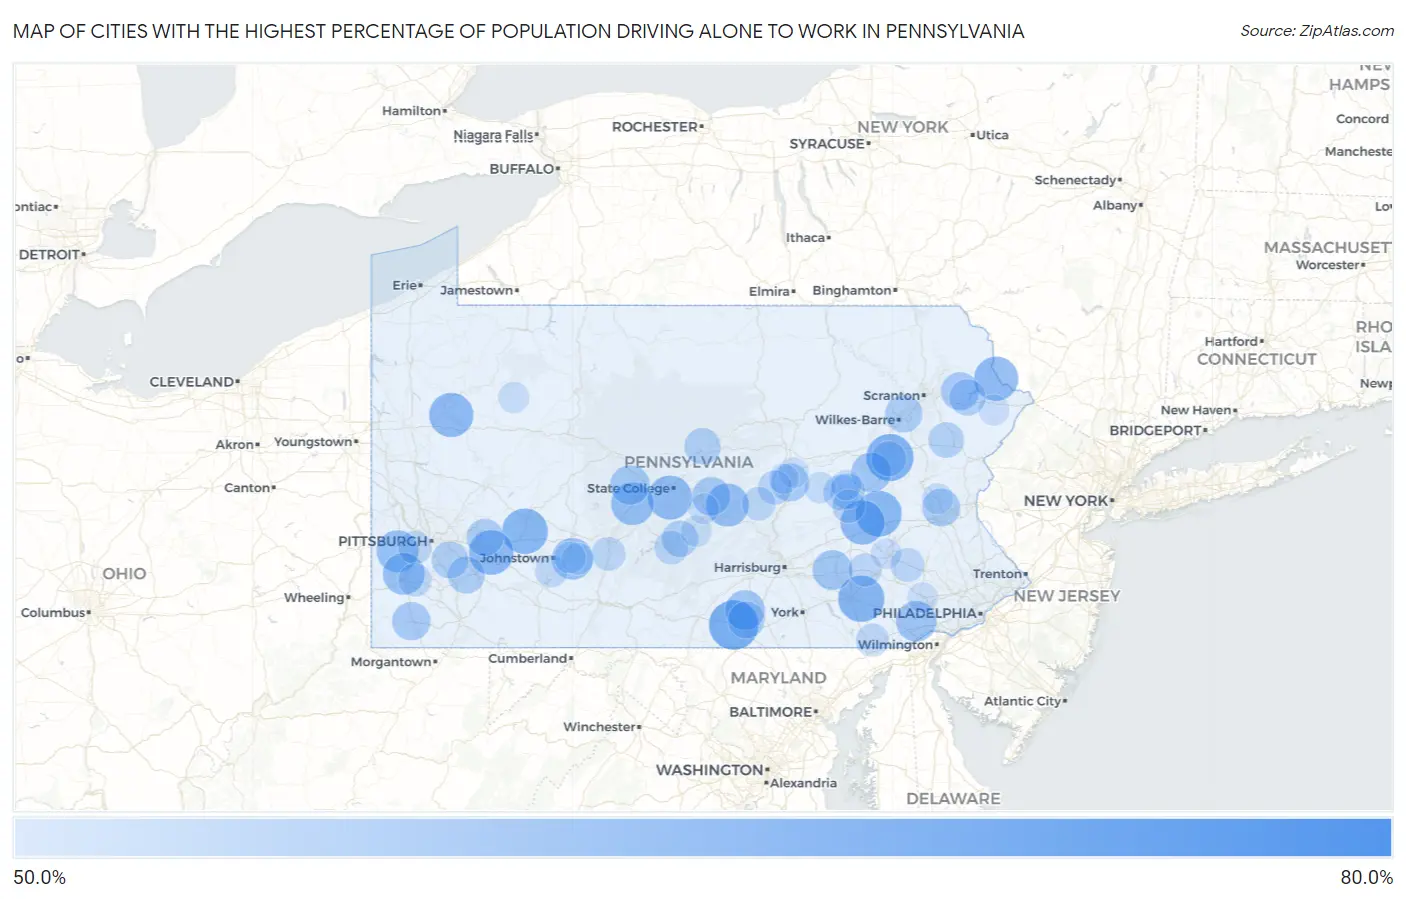
Map of Cities with the Highest Percentage of Population Driving Alone to Work in Pennsylvania
0.0%
80.0%
Cities with the Highest Percentage of Population Driving Alone to Work in Pennsylvania
| City | % Drive Alone | vs State | vs National | |
| 1. | Reightown | 74.1% | 44.0%(+30.1)#1 | 42.1%(+32.0)#14 |
| 2. | Eagles Mere Borough | 70.3% | 44.0%(+26.3)#2 | 42.1%(+28.2)#35 |
| 3. | Eldorado | 69.0% | 44.0%(+25.0)#3 | 42.1%(+26.9)#55 |
| 4. | Mcknightstown | 66.8% | 44.0%(+22.8)#4 | 42.1%(+24.7)#95 |
| 5. | Lattimer | 65.2% | 44.0%(+21.2)#5 | 42.1%(+23.1)#144 |
| 6. | Witmer | 64.6% | 44.0%(+20.6)#6 | 42.1%(+22.5)#168 |
| 7. | Deer Lake | 64.4% | 44.0%(+20.4)#7 | 42.1%(+22.3)#186 |
| 8. | Graceton | 64.2% | 44.0%(+20.2)#8 | 42.1%(+22.1)#199 |
| 9. | Crabtree | 63.5% | 44.0%(+19.5)#9 | 42.1%(+21.4)#237 |
| 10. | Masthope | 63.2% | 44.0%(+19.2)#10 | 42.1%(+21.1)#262 |
| 11. | Summit Station | 63.2% | 44.0%(+19.2)#11 | 42.1%(+21.1)#265 |
| 12. | Kennerdell | 63.2% | 44.0%(+19.2)#12 | 42.1%(+21.1)#267 |
| 13. | Pine Grove Mills | 63.1% | 44.0%(+19.1)#13 | 42.1%(+21.0)#271 |
| 14. | Wagner | 62.3% | 44.0%(+18.3)#14 | 42.1%(+20.2)#341 |
| 15. | Friesville | 62.1% | 44.0%(+18.1)#15 | 42.1%(+20.0)#364 |
| 16. | Northwood | 62.1% | 44.0%(+18.1)#16 | 42.1%(+20.0)#367 |
| 17. | Midway | 61.6% | 44.0%(+17.6)#17 | 42.1%(+19.5)#398 |
| 18. | Meadowlands | 61.6% | 44.0%(+17.6)#18 | 42.1%(+19.5)#401 |
| 19. | Sidman | 61.4% | 44.0%(+17.4)#19 | 42.1%(+19.3)#427 |
| 20. | Laporte Borough | 61.0% | 44.0%(+17.0)#20 | 42.1%(+18.9)#489 |
| 21. | Unionville | 60.8% | 44.0%(+16.8)#21 | 42.1%(+18.7)#505 |
| 22. | Spring Drive Mobile Home Park | 60.7% | 44.0%(+16.7)#22 | 42.1%(+18.6)#523 |
| 23. | Sheppton | 60.3% | 44.0%(+16.3)#23 | 42.1%(+18.2)#584 |
| 24. | Mount Gretna Heights | 60.2% | 44.0%(+16.2)#24 | 42.1%(+18.1)#608 |
| 25. | Aspers | 60.1% | 44.0%(+16.1)#25 | 42.1%(+18.0)#622 |
| 26. | Sandy Ridge | 60.0% | 44.0%(+16.0)#26 | 42.1%(+17.9)#641 |
| 27. | Morrisville | 59.3% | 44.0%(+15.3)#27 | 42.1%(+17.2)#741 |
| 28. | Mount Gretna Borough | 59.3% | 44.0%(+15.3)#28 | 42.1%(+17.2)#754 |
| 29. | Siglerville | 59.3% | 44.0%(+15.3)#29 | 42.1%(+17.2)#755 |
| 30. | Morgan Hill | 59.2% | 44.0%(+15.2)#30 | 42.1%(+17.1)#775 |
| 31. | The Hideout | 59.1% | 44.0%(+15.1)#31 | 42.1%(+17.0)#797 |
| 32. | Hummels Wharf | 59.0% | 44.0%(+15.0)#32 | 42.1%(+16.9)#821 |
| 33. | Stiles | 58.9% | 44.0%(+14.9)#33 | 42.1%(+16.8)#840 |
| 34. | Hilldale | 58.7% | 44.0%(+14.7)#34 | 42.1%(+16.6)#866 |
| 35. | Slickville | 58.5% | 44.0%(+14.5)#35 | 42.1%(+16.4)#901 |
| 36. | Yukon | 58.4% | 44.0%(+14.4)#36 | 42.1%(+16.3)#933 |
| 37. | Boston | 58.3% | 44.0%(+14.3)#37 | 42.1%(+16.2)#963 |
| 38. | East Altoona | 58.2% | 44.0%(+14.2)#38 | 42.1%(+16.1)#998 |
| 39. | Table Rock | 58.2% | 44.0%(+14.2)#39 | 42.1%(+16.1)#1,007 |
| 40. | Jacksonville Cdp Centre County | 58.1% | 44.0%(+14.1)#40 | 42.1%(+16.0)#1,031 |
| 41. | Wallenpaupack Lake Estates | 57.9% | 44.0%(+13.9)#41 | 42.1%(+15.8)#1,054 |
| 42. | Blanchard | 57.8% | 44.0%(+13.8)#42 | 42.1%(+15.7)#1,072 |
| 43. | Atkinson Mills | 57.8% | 44.0%(+13.8)#43 | 42.1%(+15.7)#1,078 |
| 44. | Volant Borough | 57.8% | 44.0%(+13.8)#44 | 42.1%(+15.7)#1,081 |
| 45. | Pocono Pines | 57.5% | 44.0%(+13.5)#45 | 42.1%(+15.4)#1,137 |
| 46. | Donegal Borough | 57.5% | 44.0%(+13.5)#46 | 42.1%(+15.4)#1,157 |
| 47. | New Hope Borough | 57.4% | 44.0%(+13.4)#47 | 42.1%(+15.3)#1,172 |
| 48. | Lavelle | 57.4% | 44.0%(+13.4)#48 | 42.1%(+15.3)#1,185 |
| 49. | Fountain Springs | 57.3% | 44.0%(+13.3)#49 | 42.1%(+15.2)#1,218 |
| 50. | Harleigh | 57.0% | 44.0%(+13.0)#50 | 42.1%(+14.9)#1,297 |
| 51. | Jeddo Borough | 57.0% | 44.0%(+13.0)#51 | 42.1%(+14.9)#1,304 |
| 52. | Fort Fetter | 57.0% | 44.0%(+13.0)#52 | 42.1%(+14.9)#1,310 |
| 53. | Smicksburg Borough | 56.5% | 44.0%(+12.5)#53 | 42.1%(+14.4)#1,442 |
| 54. | Kreamer | 56.4% | 44.0%(+12.4)#54 | 42.1%(+14.3)#1,466 |
| 55. | Baumstown | 56.3% | 44.0%(+12.3)#55 | 42.1%(+14.2)#1,514 |
| 56. | Coalmont Borough | 56.3% | 44.0%(+12.3)#56 | 42.1%(+14.2)#1,528 |
| 57. | East Freedom | 56.2% | 44.0%(+12.2)#57 | 42.1%(+14.1)#1,546 |
| 58. | Cedar Crest | 56.2% | 44.0%(+12.2)#58 | 42.1%(+14.1)#1,562 |
| 59. | Richfield | 56.0% | 44.0%(+12.0)#59 | 42.1%(+13.9)#1,608 |
| 60. | Rennerdale | 55.9% | 44.0%(+11.9)#60 | 42.1%(+13.8)#1,629 |
| 61. | Mckee | 55.9% | 44.0%(+11.9)#61 | 42.1%(+13.8)#1,633 |
| 62. | Armagh Borough | 55.9% | 44.0%(+11.9)#62 | 42.1%(+13.8)#1,636 |
| 63. | Schoeneck | 55.8% | 44.0%(+11.8)#63 | 42.1%(+13.7)#1,642 |
| 64. | Eighty Four | 55.8% | 44.0%(+11.8)#64 | 42.1%(+13.7)#1,645 |
| 65. | Branchdale | 55.8% | 44.0%(+11.8)#65 | 42.1%(+13.7)#1,648 |
| 66. | Worthville Borough | 55.8% | 44.0%(+11.8)#66 | 42.1%(+13.7)#1,662 |
| 67. | Little Britain | 55.7% | 44.0%(+11.7)#67 | 42.1%(+13.6)#1,681 |
| 68. | New Boston | 55.5% | 44.0%(+11.5)#68 | 42.1%(+13.4)#1,751 |
| 69. | Davidsville | 55.4% | 44.0%(+11.4)#69 | 42.1%(+13.3)#1,774 |
| 70. | Royer | 55.4% | 44.0%(+11.4)#70 | 42.1%(+13.3)#1,791 |
| 71. | Le Raysville Borough | 55.3% | 44.0%(+11.3)#71 | 42.1%(+13.2)#1,809 |
| 72. | Glenfield Borough | 55.3% | 44.0%(+11.3)#72 | 42.1%(+13.2)#1,815 |
| 73. | Edgeworth Borough | 55.0% | 44.0%(+11.0)#73 | 42.1%(+12.9)#1,915 |
| 74. | Platea Borough | 55.0% | 44.0%(+11.0)#74 | 42.1%(+12.9)#1,925 |
| 75. | Timblin Borough | 55.0% | 44.0%(+11.0)#75 | 42.1%(+12.9)#1,935 |
| 76. | Beaverdale | 54.8% | 44.0%(+10.8)#76 | 42.1%(+12.7)#1,970 |
| 77. | St Michael | 54.8% | 44.0%(+10.8)#77 | 42.1%(+12.7)#1,976 |
| 78. | Hookstown Borough | 54.8% | 44.0%(+10.8)#78 | 42.1%(+12.7)#1,991 |
| 79. | Runville | 54.7% | 44.0%(+10.7)#79 | 42.1%(+12.6)#2,022 |
| 80. | Tharptown Uniontown | 54.7% | 44.0%(+10.7)#80 | 42.1%(+12.6)#2,024 |
| 81. | Snydertown Borough | 54.5% | 44.0%(+10.5)#81 | 42.1%(+12.4)#2,101 |
| 82. | Indian Lake Borough | 54.5% | 44.0%(+10.5)#82 | 42.1%(+12.4)#2,104 |
| 83. | Union Dale Borough | 54.5% | 44.0%(+10.5)#83 | 42.1%(+12.4)#2,115 |
| 84. | Linds Crossing | 54.5% | 44.0%(+10.5)#84 | 42.1%(+12.4)#2,116 |
| 85. | Longfellow | 54.5% | 44.0%(+10.5)#85 | 42.1%(+12.4)#2,122 |
| 86. | Laurys Station | 54.4% | 44.0%(+10.4)#86 | 42.1%(+12.3)#2,148 |
| 87. | Crown | 54.4% | 44.0%(+10.4)#87 | 42.1%(+12.3)#2,157 |
| 88. | Hemlock Farms | 54.3% | 44.0%(+10.3)#88 | 42.1%(+12.2)#2,174 |
| 89. | Woodcock Borough | 54.3% | 44.0%(+10.3)#89 | 42.1%(+12.2)#2,215 |
| 90. | Spring Ridge | 54.2% | 44.0%(+10.2)#90 | 42.1%(+12.1)#2,243 |
| 91. | Youngstown Borough | 54.2% | 44.0%(+10.2)#91 | 42.1%(+12.1)#2,254 |
| 92. | Eagleview | 54.1% | 44.0%(+10.1)#92 | 42.1%(+12.0)#2,266 |
| 93. | Lumber City | 54.1% | 44.0%(+10.1)#93 | 42.1%(+12.0)#2,291 |
| 94. | Aristes | 54.1% | 44.0%(+10.1)#94 | 42.1%(+12.0)#2,296 |
| 95. | Midland Borough | 54.0% | 44.0%(+10.0)#95 | 42.1%(+11.9)#2,309 |
| 96. | Kapp Heights | 54.0% | 44.0%(+10.0)#96 | 42.1%(+11.9)#2,322 |
| 97. | Cherry Valley Borough | 54.0% | 44.0%(+10.0)#97 | 42.1%(+11.9)#2,340 |
| 98. | Great Bend Borough | 53.9% | 44.0%(+9.90)#98 | 42.1%(+11.8)#2,357 |
| 99. | Orangeville Borough | 53.8% | 44.0%(+9.80)#99 | 42.1%(+11.7)#2,395 |
| 100. | Kratzerville | 53.8% | 44.0%(+9.80)#100 | 42.1%(+11.7)#2,400 |
Common Questions
What are the Top 10 Cities with the Highest Percentage of Population Driving Alone to Work in Pennsylvania?
Top 10 Cities with the Highest Percentage of Population Driving Alone to Work in Pennsylvania are:
#1
66.8%
#2
65.2%
#3
64.6%
#4
64.4%
#5
64.2%
#6
63.5%
#7
63.2%
#8
63.2%
#9
63.2%
#10
63.1%
What city has the Highest Percentage of Population Driving Alone to Work in Pennsylvania?
McKnightstown has the Highest Percentage of Population Driving Alone to Work in Pennsylvania with 66.8%.
What is the Percentage of Population Driving Alone to Work in the State of Pennsylvania?
Percentage of Population Driving Alone to Work in Pennsylvania is 44.0%.
What is the Percentage of Population Driving Alone to Work in the United States?
Percentage of Population Driving Alone to Work in the United States is 42.1%.