Cities with the Highest Percentage of Nigerian Population in Michigan
RELATED REPORTS & OPTIONS
Nigerian
Michigan
Compare Cities
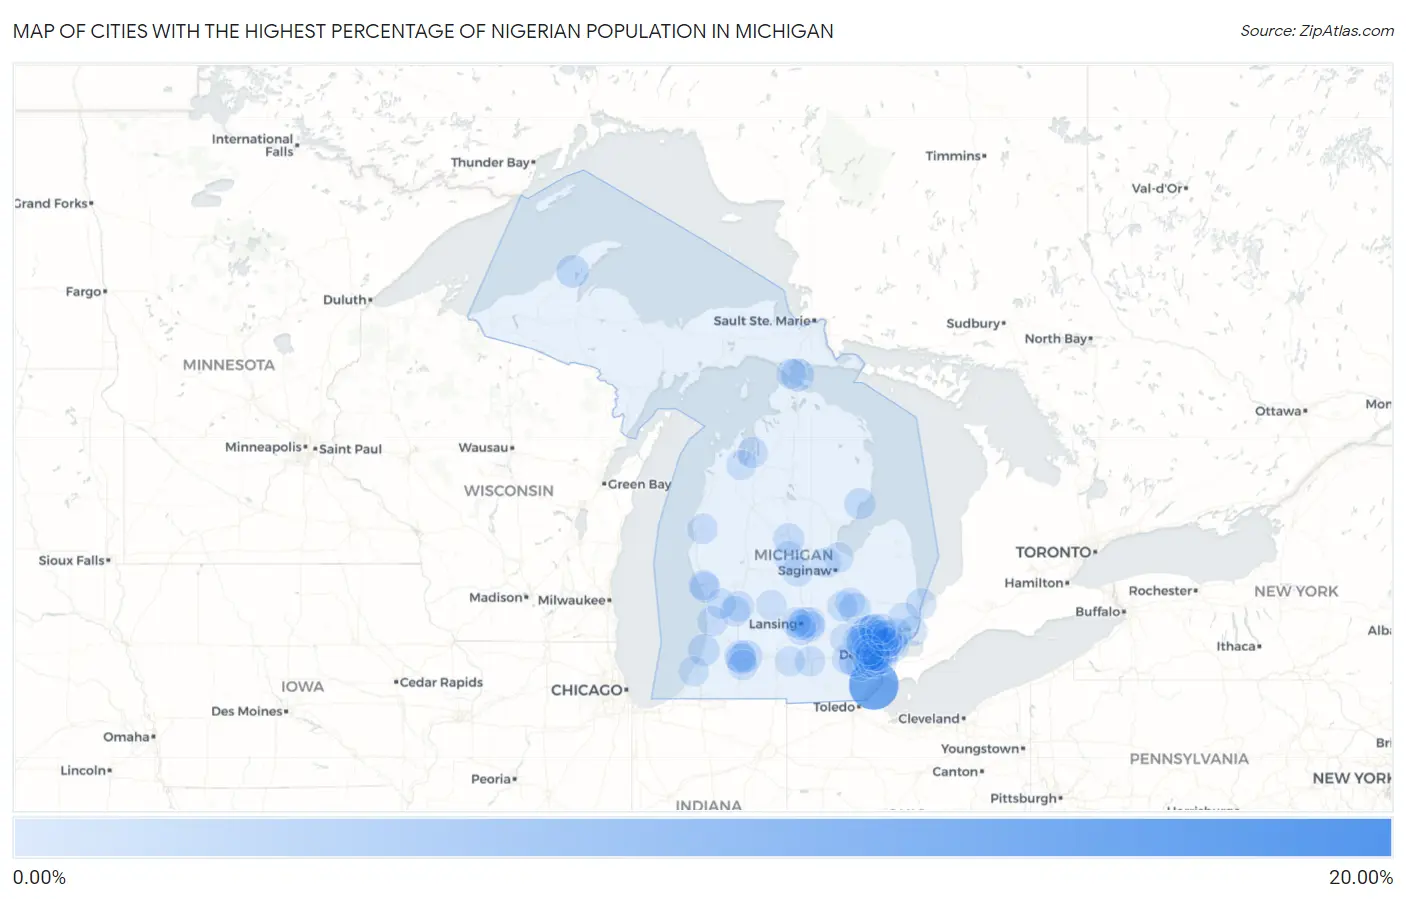
Map of Cities with the Highest Percentage of Nigerian Population in Michigan
0.00%
20.00%
Cities with the Highest Percentage of Nigerian Population in Michigan
| City | Nigerian | vs State | vs National | |
| 1. | Scotts | 16.48% | 0.10%(+16.4)#1 | 0.18%(+16.3)#4 |
| 2. | Stony Point | 12.00% | 0.10%(+11.9)#2 | 0.18%(+11.8)#8 |
| 3. | Orchard Lake Village | 4.31% | 0.10%(+4.21)#3 | 0.18%(+4.14)#53 |
| 4. | Mackinac Island | 1.79% | 0.10%(+1.69)#4 | 0.18%(+1.62)#173 |
| 5. | Houghton | 1.49% | 0.10%(+1.39)#5 | 0.18%(+1.32)#222 |
| 6. | Highland Park | 1.31% | 0.10%(+1.20)#6 | 0.18%(+1.13)#267 |
| 7. | Comstock Northwest | 1.19% | 0.10%(+1.08)#7 | 0.18%(+1.01)#306 |
| 8. | Westland | 1.04% | 0.10%(+0.931)#8 | 0.18%(+0.860)#355 |
| 9. | South Haven | 1.03% | 0.10%(+0.921)#9 | 0.18%(+0.850)#361 |
| 10. | Franklin | 1.02% | 0.10%(+0.914)#10 | 0.18%(+0.842)#364 |
| 11. | Grand Blanc | 0.98% | 0.10%(+0.879)#11 | 0.18%(+0.808)#383 |
| 12. | Belleville | 0.88% | 0.10%(+0.776)#12 | 0.18%(+0.704)#436 |
| 13. | Westwood | 0.86% | 0.10%(+0.761)#13 | 0.18%(+0.689)#441 |
| 14. | Southfield | 0.85% | 0.10%(+0.747)#14 | 0.18%(+0.676)#451 |
| 15. | Tawas City | 0.74% | 0.10%(+0.639)#15 | 0.18%(+0.568)#516 |
| 16. | Beverly Hills | 0.68% | 0.10%(+0.578)#16 | 0.18%(+0.507)#561 |
| 17. | Clare | 0.65% | 0.10%(+0.549)#17 | 0.18%(+0.478)#584 |
| 18. | Wayne | 0.63% | 0.10%(+0.528)#18 | 0.18%(+0.456)#616 |
| 19. | Ann Arbor | 0.49% | 0.10%(+0.387)#19 | 0.18%(+0.315)#805 |
| 20. | Port Huron | 0.48% | 0.10%(+0.374)#20 | 0.18%(+0.302)#824 |
| 21. | Inkster | 0.47% | 0.10%(+0.368)#21 | 0.18%(+0.296)#830 |
| 22. | Pontiac | 0.46% | 0.10%(+0.356)#22 | 0.18%(+0.284)#844 |
| 23. | Ferndale | 0.44% | 0.10%(+0.332)#23 | 0.18%(+0.260)#892 |
| 24. | Mount Clemens | 0.43% | 0.10%(+0.323)#24 | 0.18%(+0.252)#907 |
| 25. | Walled Lake | 0.39% | 0.10%(+0.282)#25 | 0.18%(+0.210)#980 |
| 26. | Elk Rapids | 0.38% | 0.10%(+0.279)#26 | 0.18%(+0.207)#988 |
| 27. | Ypsilanti | 0.38% | 0.10%(+0.277)#27 | 0.18%(+0.205)#994 |
| 28. | Harper Woods | 0.38% | 0.10%(+0.275)#28 | 0.18%(+0.203)#998 |
| 29. | Kalamazoo | 0.32% | 0.10%(+0.218)#29 | 0.18%(+0.146)#1,146 |
| 30. | East Lansing | 0.31% | 0.10%(+0.207)#30 | 0.18%(+0.135)#1,177 |
| 31. | Oak Park | 0.31% | 0.10%(+0.201)#31 | 0.18%(+0.129)#1,191 |
| 32. | Mount Pleasant | 0.28% | 0.10%(+0.180)#32 | 0.18%(+0.108)#1,251 |
| 33. | Detroit | 0.28% | 0.10%(+0.175)#33 | 0.18%(+0.103)#1,267 |
| 34. | Haslett | 0.28% | 0.10%(+0.174)#34 | 0.18%(+0.102)#1,273 |
| 35. | Scottville | 0.26% | 0.10%(+0.161)#35 | 0.18%(+0.089)#1,315 |
| 36. | Okemos | 0.24% | 0.10%(+0.139)#36 | 0.18%(+0.067)#1,381 |
| 37. | Romulus | 0.23% | 0.10%(+0.128)#37 | 0.18%(+0.056)#1,434 |
| 38. | Holland | 0.23% | 0.10%(+0.121)#38 | 0.18%(+0.050)#1,450 |
| 39. | Grand Rapids | 0.21% | 0.10%(+0.110)#39 | 0.18%(+0.038)#1,491 |
| 40. | Wyoming | 0.21% | 0.10%(+0.108)#40 | 0.18%(+0.037)#1,497 |
| 41. | Portage | 0.19% | 0.10%(+0.086)#41 | 0.18%(+0.014)#1,576 |
| 42. | Farmington Hills | 0.19% | 0.10%(+0.084)#42 | 0.18%(+0.012)#1,585 |
| 43. | Muskegon Heights | 0.18% | 0.10%(+0.077)#43 | 0.18%(+0.005)#1,621 |
| 44. | Holt | 0.18% | 0.10%(+0.073)#44 | 0.18%(+0.002)#1,643 |
| 45. | Jackson | 0.17% | 0.10%(+0.068)#45 | 0.18%(-0.004)#1,676 |
| 46. | Bloomfield Hills | 0.16% | 0.10%(+0.055)#46 | 0.18%(-0.017)#1,743 |
| 47. | St Louis | 0.16% | 0.10%(+0.055)#47 | 0.18%(-0.017)#1,746 |
| 48. | Pearl Beach | 0.16% | 0.10%(+0.051)#48 | 0.18%(-0.021)#1,771 |
| 49. | Swartz Creek | 0.15% | 0.10%(+0.049)#49 | 0.18%(-0.022)#1,786 |
| 50. | Wixom | 0.15% | 0.10%(+0.049)#50 | 0.18%(-0.023)#1,791 |
| 51. | Taylor | 0.15% | 0.10%(+0.044)#51 | 0.18%(-0.028)#1,826 |
| 52. | River Rouge | 0.14% | 0.10%(+0.035)#52 | 0.18%(-0.037)#1,871 |
| 53. | Allendale | 0.13% | 0.10%(+0.031)#53 | 0.18%(-0.041)#1,899 |
| 54. | Lansing | 0.13% | 0.10%(+0.028)#54 | 0.18%(-0.044)#1,921 |
| 55. | Center Line | 0.13% | 0.10%(+0.026)#55 | 0.18%(-0.046)#1,937 |
| 56. | Ionia | 0.11% | 0.10%(+0.011)#56 | 0.18%(-0.061)#2,024 |
| 57. | Allen Park | 0.11% | 0.10%(+0.009)#57 | 0.18%(-0.063)#2,037 |
| 58. | Dearborn | 0.11% | 0.10%(+0.004)#58 | 0.18%(-0.068)#2,077 |
| 59. | Brighton | 0.11% | 0.10%(+0.003)#59 | 0.18%(-0.069)#2,085 |
| 60. | Novi | 0.099% | 0.10%(-0.005)#60 | 0.18%(-0.077)#2,138 |
| 61. | Roseville | 0.097% | 0.10%(-0.007)#61 | 0.18%(-0.079)#2,152 |
| 62. | Warren | 0.092% | 0.10%(-0.012)#62 | 0.18%(-0.084)#2,184 |
| 63. | St Ignace | 0.090% | 0.10%(-0.014)#63 | 0.18%(-0.086)#2,206 |
| 64. | Richmond | 0.085% | 0.10%(-0.019)#64 | 0.18%(-0.090)#2,245 |
| 65. | Garden City | 0.085% | 0.10%(-0.019)#65 | 0.18%(-0.091)#2,249 |
| 66. | Freeland | 0.082% | 0.10%(-0.022)#66 | 0.18%(-0.094)#2,275 |
| 67. | Muskegon | 0.073% | 0.10%(-0.031)#67 | 0.18%(-0.103)#2,327 |
| 68. | Madison Heights | 0.067% | 0.10%(-0.037)#68 | 0.18%(-0.109)#2,389 |
| 69. | Benton Harbor | 0.066% | 0.10%(-0.038)#69 | 0.18%(-0.110)#2,397 |
| 70. | Traverse City | 0.052% | 0.10%(-0.052)#70 | 0.18%(-0.124)#2,518 |
| 71. | Dearborn Heights | 0.048% | 0.10%(-0.056)#71 | 0.18%(-0.128)#2,554 |
| 72. | Waverly | 0.046% | 0.10%(-0.058)#72 | 0.18%(-0.129)#2,573 |
| 73. | Bay City | 0.031% | 0.10%(-0.073)#73 | 0.18%(-0.145)#2,740 |
| 74. | Auburn Hills | 0.028% | 0.10%(-0.076)#74 | 0.18%(-0.147)#2,762 |
| 75. | Flint | 0.027% | 0.10%(-0.077)#75 | 0.18%(-0.149)#2,780 |
| 76. | Troy | 0.022% | 0.10%(-0.082)#76 | 0.18%(-0.154)#2,817 |
| 77. | Sterling Heights | 0.020% | 0.10%(-0.084)#77 | 0.18%(-0.156)#2,837 |
| 78. | Livonia | 0.016% | 0.10%(-0.088)#78 | 0.18%(-0.160)#2,880 |
| 79. | Rochester Hills | 0.016% | 0.10%(-0.088)#79 | 0.18%(-0.160)#2,881 |
| 80. | Albion | 0.013% | 0.10%(-0.091)#80 | 0.18%(-0.163)#2,908 |
Common Questions
What are the Top 10 Cities with the Highest Percentage of Nigerian Population in Michigan?
Top 10 Cities with the Highest Percentage of Nigerian Population in Michigan are:
#1
12.00%
#2
4.31%
#3
1.79%
#4
1.49%
#5
1.31%
#6
1.19%
#7
1.04%
#8
1.03%
#9
1.02%
#10
0.98%
What city has the Highest Percentage of Nigerian Population in Michigan?
Stony Point has the Highest Percentage of Nigerian Population in Michigan with 12.00%.
What is the Percentage of Nigerian Population in the State of Michigan?
Percentage of Nigerian Population in Michigan is 0.10%.
What is the Percentage of Nigerian Population in the United States?
Percentage of Nigerian Population in the United States is 0.18%.