Cities with the Highest Percentage of Nigerian Population in Maryland
RELATED REPORTS & OPTIONS
Nigerian
Maryland
Compare Cities
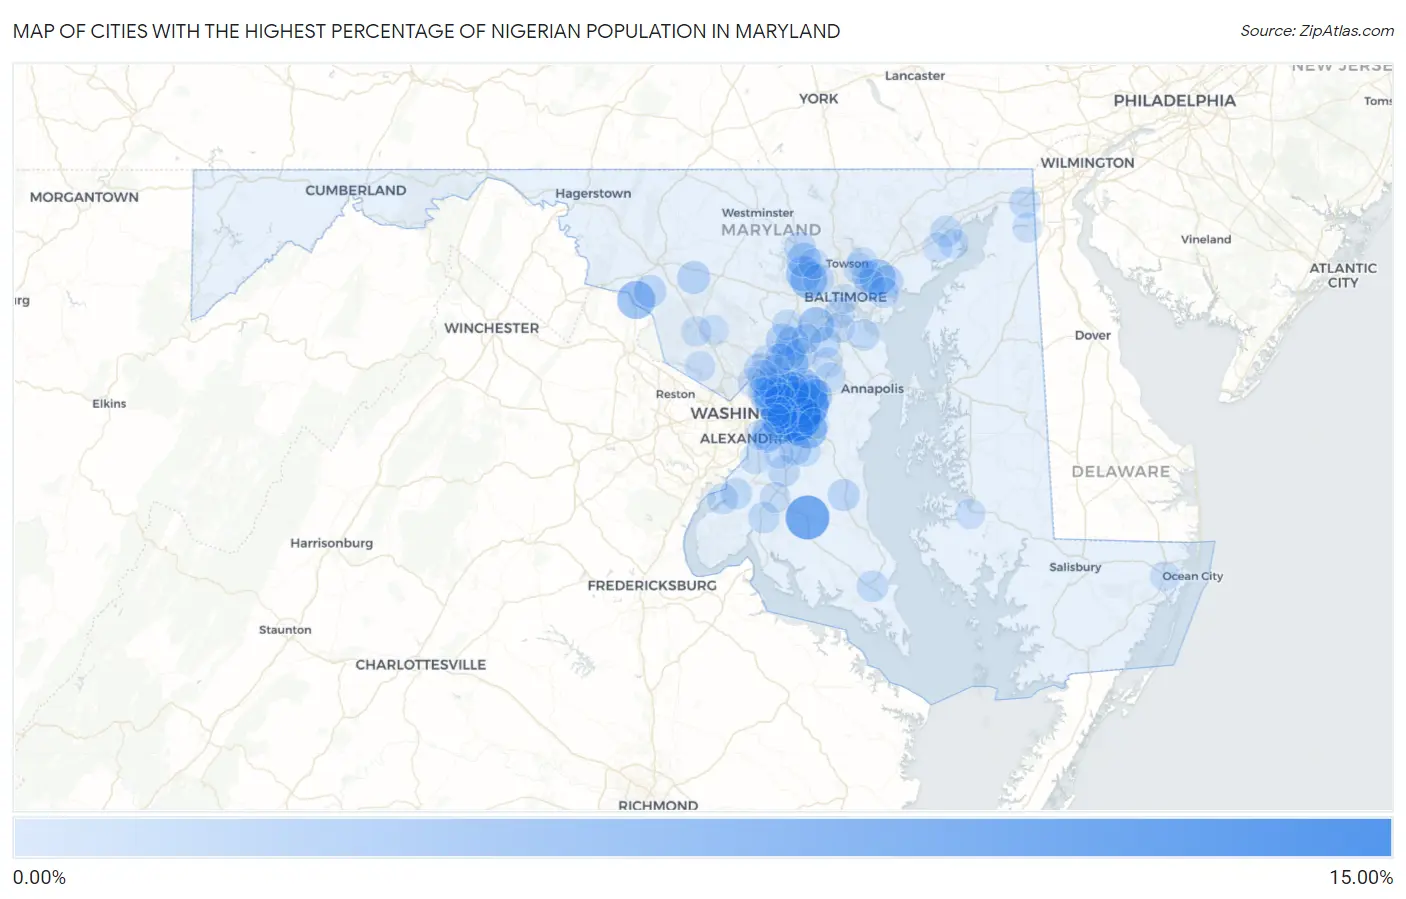
Map of Cities with the Highest Percentage of Nigerian Population in Maryland
0.00%
15.00%
Cities with the Highest Percentage of Nigerian Population in Maryland
| City | Nigerian | vs State | vs National | |
| 1. | Largo | 13.85% | 0.91%(+12.9)#1 | 0.18%(+13.7)#7 |
| 2. | Woodmore | 10.58% | 0.91%(+9.67)#2 | 0.18%(+10.4)#12 |
| 3. | Hughesville | 9.83% | 0.91%(+8.92)#3 | 0.18%(+9.65)#13 |
| 4. | Glenarden | 7.61% | 0.91%(+6.69)#4 | 0.18%(+7.43)#16 |
| 5. | Summerfield | 6.61% | 0.91%(+5.70)#5 | 0.18%(+6.44)#22 |
| 6. | District Heights | 6.37% | 0.91%(+5.45)#6 | 0.18%(+6.19)#24 |
| 7. | Bladensburg | 6.04% | 0.91%(+5.12)#7 | 0.18%(+5.86)#25 |
| 8. | Point Of Rocks | 5.93% | 0.91%(+5.02)#8 | 0.18%(+5.76)#27 |
| 9. | Mitchellville | 5.70% | 0.91%(+4.79)#9 | 0.18%(+5.53)#30 |
| 10. | Fairwood | 5.67% | 0.91%(+4.76)#10 | 0.18%(+5.50)#31 |
| 11. | New Carrollton | 5.46% | 0.91%(+4.54)#11 | 0.18%(+5.28)#35 |
| 12. | Milford Mill | 5.39% | 0.91%(+4.47)#12 | 0.18%(+5.21)#37 |
| 13. | Marlboro Village | 5.34% | 0.91%(+4.42)#13 | 0.18%(+5.16)#38 |
| 14. | Glenn Dale | 4.94% | 0.91%(+4.02)#14 | 0.18%(+4.76)#42 |
| 15. | Landover | 4.94% | 0.91%(+4.02)#15 | 0.18%(+4.76)#43 |
| 16. | Rossville | 4.82% | 0.91%(+3.90)#16 | 0.18%(+4.64)#46 |
| 17. | Elkridge | 4.48% | 0.91%(+3.56)#17 | 0.18%(+4.30)#49 |
| 18. | Randallstown | 4.36% | 0.91%(+3.45)#18 | 0.18%(+4.19)#52 |
| 19. | Woodlawn Cdp Prince George S County | 4.30% | 0.91%(+3.38)#19 | 0.18%(+4.12)#54 |
| 20. | Bowie | 3.73% | 0.91%(+2.81)#20 | 0.18%(+3.55)#64 |
| 21. | Lake Arbor | 3.66% | 0.91%(+2.75)#21 | 0.18%(+3.49)#67 |
| 22. | South Laurel | 3.64% | 0.91%(+2.72)#22 | 0.18%(+3.46)#69 |
| 23. | Kettering | 3.63% | 0.91%(+2.72)#23 | 0.18%(+3.46)#70 |
| 24. | Cheverly | 3.62% | 0.91%(+2.71)#24 | 0.18%(+3.44)#71 |
| 25. | Seabrook | 3.53% | 0.91%(+2.61)#25 | 0.18%(+3.35)#73 |
| 26. | Seat Pleasant | 3.52% | 0.91%(+2.61)#26 | 0.18%(+3.35)#74 |
| 27. | Owings Mills | 3.49% | 0.91%(+2.57)#27 | 0.18%(+3.31)#75 |
| 28. | Westphalia | 3.43% | 0.91%(+2.51)#28 | 0.18%(+3.25)#79 |
| 29. | Cottage City | 3.14% | 0.91%(+2.22)#29 | 0.18%(+2.96)#85 |
| 30. | North Laurel | 3.13% | 0.91%(+2.21)#30 | 0.18%(+2.95)#86 |
| 31. | Marlow Heights | 3.10% | 0.91%(+2.19)#31 | 0.18%(+2.93)#89 |
| 32. | Lanham | 2.98% | 0.91%(+2.06)#32 | 0.18%(+2.80)#92 |
| 33. | Greenbelt | 2.85% | 0.91%(+1.94)#33 | 0.18%(+2.68)#98 |
| 34. | Laurel | 2.78% | 0.91%(+1.87)#34 | 0.18%(+2.61)#103 |
| 35. | Scaggsville | 2.71% | 0.91%(+1.80)#35 | 0.18%(+2.54)#105 |
| 36. | Monrovia | 2.65% | 0.91%(+1.74)#36 | 0.18%(+2.48)#109 |
| 37. | Adamstown | 2.38% | 0.91%(+1.47)#37 | 0.18%(+2.21)#120 |
| 38. | Rosaryville | 2.22% | 0.91%(+1.31)#38 | 0.18%(+2.04)#132 |
| 39. | Huntingtown | 2.12% | 0.91%(+1.21)#39 | 0.18%(+1.95)#138 |
| 40. | Middle River | 2.08% | 0.91%(+1.17)#40 | 0.18%(+1.91)#142 |
| 41. | Maryland City | 2.00% | 0.91%(+1.09)#41 | 0.18%(+1.82)#148 |
| 42. | East Riverdale | 1.97% | 0.91%(+1.05)#42 | 0.18%(+1.79)#154 |
| 43. | Overlea | 1.96% | 0.91%(+1.05)#43 | 0.18%(+1.79)#155 |
| 44. | White Oak | 1.96% | 0.91%(+1.04)#44 | 0.18%(+1.78)#156 |
| 45. | Peppermill Village | 1.86% | 0.91%(+0.949)#45 | 0.18%(+1.69)#162 |
| 46. | Brandywine | 1.84% | 0.91%(+0.929)#46 | 0.18%(+1.67)#165 |
| 47. | Reisterstown | 1.80% | 0.91%(+0.888)#47 | 0.18%(+1.63)#172 |
| 48. | Rosedale | 1.78% | 0.91%(+0.865)#48 | 0.18%(+1.60)#176 |
| 49. | Riviera Beach | 1.75% | 0.91%(+0.834)#49 | 0.18%(+1.57)#180 |
| 50. | California | 1.74% | 0.91%(+0.823)#50 | 0.18%(+1.56)#182 |
| 51. | Abingdon | 1.72% | 0.91%(+0.807)#51 | 0.18%(+1.55)#183 |
| 52. | Lochearn | 1.69% | 0.91%(+0.777)#52 | 0.18%(+1.52)#185 |
| 53. | Severn | 1.68% | 0.91%(+0.768)#53 | 0.18%(+1.51)#187 |
| 54. | Aberdeen | 1.67% | 0.91%(+0.754)#54 | 0.18%(+1.49)#192 |
| 55. | Elkton | 1.66% | 0.91%(+0.747)#55 | 0.18%(+1.49)#193 |
| 56. | La Plata | 1.64% | 0.91%(+0.729)#56 | 0.18%(+1.47)#195 |
| 57. | Bryans Road | 1.58% | 0.91%(+0.668)#57 | 0.18%(+1.41)#205 |
| 58. | Brown Station | 1.56% | 0.91%(+0.648)#58 | 0.18%(+1.39)#209 |
| 59. | Indian Head | 1.42% | 0.91%(+0.510)#59 | 0.18%(+1.25)#232 |
| 60. | Essex | 1.41% | 0.91%(+0.498)#60 | 0.18%(+1.24)#235 |
| 61. | Hyattsville | 1.41% | 0.91%(+0.490)#61 | 0.18%(+1.23)#238 |
| 62. | Brock Hall | 1.40% | 0.91%(+0.482)#62 | 0.18%(+1.22)#243 |
| 63. | Columbia | 1.36% | 0.91%(+0.449)#63 | 0.18%(+1.19)#250 |
| 64. | College Park | 1.34% | 0.91%(+0.422)#64 | 0.18%(+1.16)#256 |
| 65. | Marlton | 1.32% | 0.91%(+0.403)#65 | 0.18%(+1.14)#263 |
| 66. | Waldorf | 1.31% | 0.91%(+0.393)#66 | 0.18%(+1.13)#266 |
| 67. | Riverdale Park | 1.30% | 0.91%(+0.389)#67 | 0.18%(+1.13)#268 |
| 68. | Adelphi | 1.29% | 0.91%(+0.372)#68 | 0.18%(+1.11)#274 |
| 69. | Fairland | 1.27% | 0.91%(+0.351)#69 | 0.18%(+1.09)#281 |
| 70. | Parkville | 1.26% | 0.91%(+0.343)#70 | 0.18%(+1.08)#282 |
| 71. | Baltimore Highlands | 1.20% | 0.91%(+0.280)#71 | 0.18%(+1.02)#300 |
| 72. | Carney | 1.19% | 0.91%(+0.278)#72 | 0.18%(+1.02)#303 |
| 73. | Beltsville | 1.16% | 0.91%(+0.247)#73 | 0.18%(+0.986)#312 |
| 74. | Fort Washington | 1.16% | 0.91%(+0.247)#74 | 0.18%(+0.986)#313 |
| 75. | Konterra | 1.13% | 0.91%(+0.213)#75 | 0.18%(+0.952)#326 |
| 76. | Ferndale | 1.10% | 0.91%(+0.189)#76 | 0.18%(+0.928)#333 |
| 77. | Hillandale | 1.10% | 0.91%(+0.185)#77 | 0.18%(+0.924)#334 |
| 78. | Garrison | 1.10% | 0.91%(+0.181)#78 | 0.18%(+0.920)#336 |
| 79. | Temple Hills | 1.08% | 0.91%(+0.168)#79 | 0.18%(+0.907)#339 |
| 80. | Germantown | 1.02% | 0.91%(+0.103)#80 | 0.18%(+0.842)#365 |
| 81. | Travilah | 0.99% | 0.91%(+0.072)#81 | 0.18%(+0.811)#378 |
| 82. | Walker Mill | 0.98% | 0.91%(+0.068)#82 | 0.18%(+0.807)#385 |
| 83. | Silver Spring | 0.98% | 0.91%(+0.063)#83 | 0.18%(+0.802)#389 |
| 84. | Odenton | 0.97% | 0.91%(+0.056)#84 | 0.18%(+0.795)#393 |
| 85. | Crofton | 0.95% | 0.91%(+0.035)#85 | 0.18%(+0.775)#403 |
| 86. | Landover Hills | 0.94% | 0.91%(+0.029)#86 | 0.18%(+0.769)#406 |
| 87. | Fairmount Heights | 0.94% | 0.91%(+0.025)#87 | 0.18%(+0.764)#409 |
| 88. | Coral Hills | 0.91% | 0.91%(-0.001)#88 | 0.18%(+0.738)#417 |
| 89. | Chillum | 0.91% | 0.91%(-0.004)#89 | 0.18%(+0.735)#418 |
| 90. | Cambridge | 0.90% | 0.91%(-0.011)#90 | 0.18%(+0.728)#424 |
| 91. | Aberdeen Proving Ground | 0.89% | 0.91%(-0.027)#91 | 0.18%(+0.712)#434 |
| 92. | Chesapeake City | 0.87% | 0.91%(-0.041)#92 | 0.18%(+0.698)#438 |
| 93. | Montgomery Village | 0.86% | 0.91%(-0.054)#93 | 0.18%(+0.685)#443 |
| 94. | Honeygo | 0.86% | 0.91%(-0.060)#94 | 0.18%(+0.679)#447 |
| 95. | Glassmanor | 0.85% | 0.91%(-0.068)#95 | 0.18%(+0.671)#456 |
| 96. | Perryman | 0.83% | 0.91%(-0.083)#96 | 0.18%(+0.657)#464 |
| 97. | Berlin | 0.83% | 0.91%(-0.084)#97 | 0.18%(+0.655)#465 |
| 98. | Clinton | 0.79% | 0.91%(-0.129)#98 | 0.18%(+0.610)#489 |
| 99. | Jessup | 0.78% | 0.91%(-0.134)#99 | 0.18%(+0.605)#493 |
| 100. | Baltimore | 0.77% | 0.91%(-0.143)#100 | 0.18%(+0.596)#499 |
Common Questions
What are the Top 10 Cities with the Highest Percentage of Nigerian Population in Maryland?
Top 10 Cities with the Highest Percentage of Nigerian Population in Maryland are:
#1
13.85%
#2
10.58%
#3
9.83%
#4
7.61%
#5
6.61%
#6
6.37%
#7
6.04%
#8
5.93%
#9
5.70%
#10
5.67%
What city has the Highest Percentage of Nigerian Population in Maryland?
Largo has the Highest Percentage of Nigerian Population in Maryland with 13.85%.
What is the Percentage of Nigerian Population in the State of Maryland?
Percentage of Nigerian Population in Maryland is 0.91%.
What is the Percentage of Nigerian Population in the United States?
Percentage of Nigerian Population in the United States is 0.18%.