Cities with the Highest Percentage of Nigerian Population in New York
RELATED REPORTS & OPTIONS
Nigerian
New York
Compare Cities
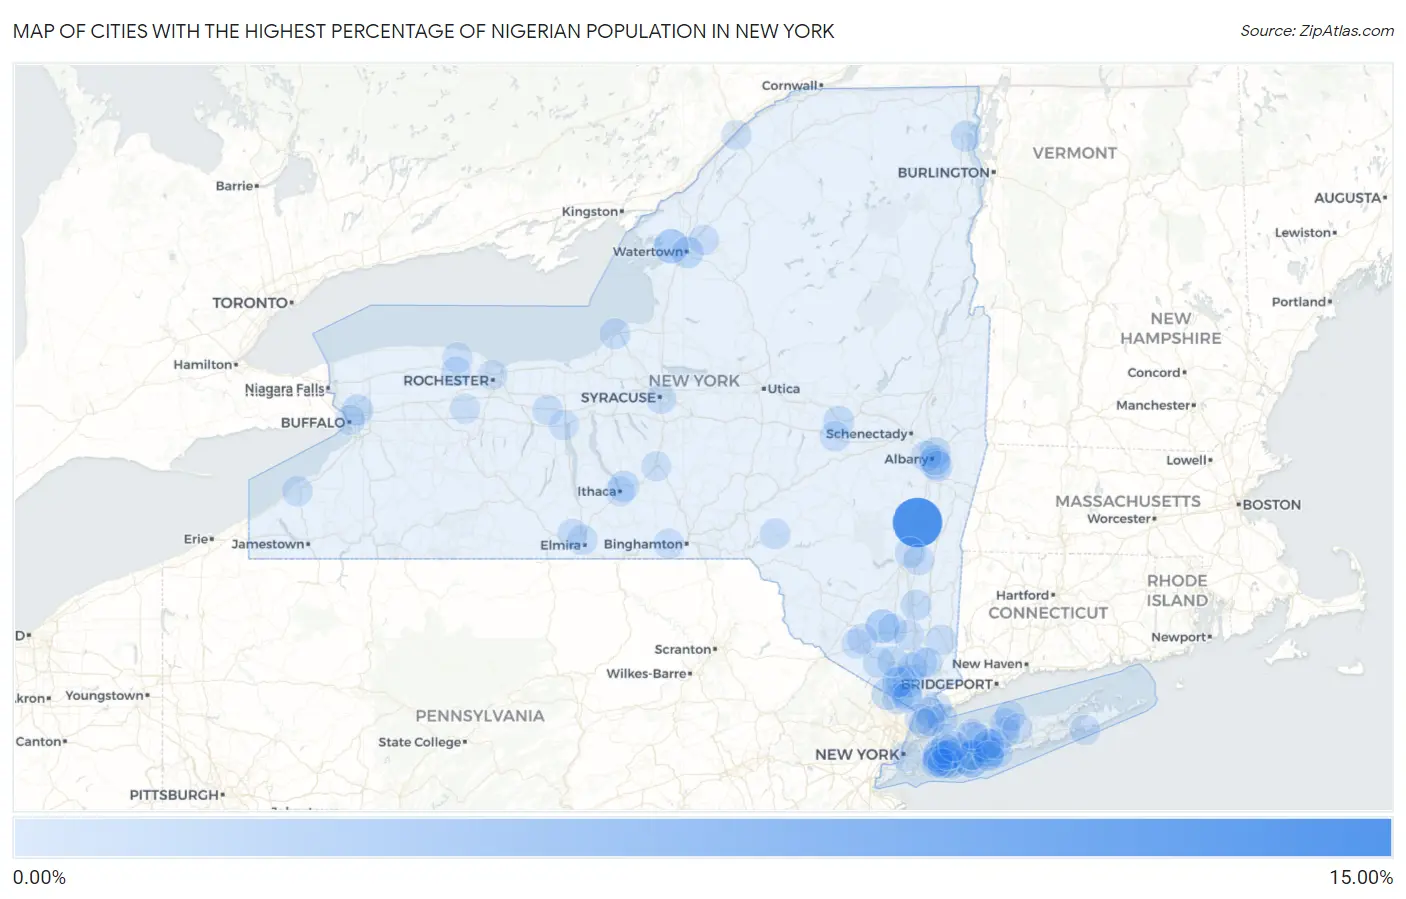
Map of Cities with the Highest Percentage of Nigerian Population in New York
0.00%
15.00%
Cities with the Highest Percentage of Nigerian Population in New York
| City | Nigerian | vs State | vs National | |
| 1. | Jefferson Heights | 13.87% | 0.23%(+13.6)#1 | 0.18%(+13.7)#6 |
| 2. | Amityville | 3.65% | 0.23%(+3.42)#2 | 0.18%(+3.47)#68 |
| 3. | Dexter | 3.01% | 0.23%(+2.79)#3 | 0.18%(+2.84)#91 |
| 4. | Walden | 2.64% | 0.23%(+2.41)#4 | 0.18%(+2.46)#110 |
| 5. | Lakeview | 2.04% | 0.23%(+1.81)#5 | 0.18%(+1.86)#144 |
| 6. | Suffern | 1.57% | 0.23%(+1.34)#6 | 0.18%(+1.40)#207 |
| 7. | Haverstraw | 1.35% | 0.23%(+1.12)#7 | 0.18%(+1.18)#253 |
| 8. | Watertown | 1.29% | 0.23%(+1.06)#8 | 0.18%(+1.11)#273 |
| 9. | East Massapequa | 1.27% | 0.23%(+1.04)#9 | 0.18%(+1.10)#280 |
| 10. | Elmont | 1.05% | 0.23%(+0.825)#10 | 0.18%(+0.878)#349 |
| 11. | Mount Ivy | 1.03% | 0.23%(+0.806)#11 | 0.18%(+0.859)#356 |
| 12. | Eggertsville | 1.00% | 0.23%(+0.773)#12 | 0.18%(+0.826)#369 |
| 13. | Walton Park | 0.99% | 0.23%(+0.762)#13 | 0.18%(+0.815)#375 |
| 14. | Brightwaters | 0.97% | 0.23%(+0.746)#14 | 0.18%(+0.799)#392 |
| 15. | Lake Mohegan | 0.94% | 0.23%(+0.715)#15 | 0.18%(+0.767)#407 |
| 16. | Bardonia | 0.94% | 0.23%(+0.713)#16 | 0.18%(+0.766)#408 |
| 17. | Dix Hills | 0.91% | 0.23%(+0.680)#17 | 0.18%(+0.733)#422 |
| 18. | East Meadow | 0.90% | 0.23%(+0.675)#18 | 0.18%(+0.728)#425 |
| 19. | Plattsburgh | 0.89% | 0.23%(+0.661)#19 | 0.18%(+0.713)#433 |
| 20. | Northeast Ithaca | 0.88% | 0.23%(+0.647)#20 | 0.18%(+0.700)#437 |
| 21. | Freeport | 0.83% | 0.23%(+0.602)#21 | 0.18%(+0.654)#466 |
| 22. | Stony Brook University | 0.81% | 0.23%(+0.582)#22 | 0.18%(+0.635)#474 |
| 23. | Baldwin | 0.81% | 0.23%(+0.580)#23 | 0.18%(+0.633)#479 |
| 24. | Harrison | 0.81% | 0.23%(+0.579)#24 | 0.18%(+0.632)#480 |
| 25. | Hampton Manor | 0.80% | 0.23%(+0.576)#25 | 0.18%(+0.629)#482 |
| 26. | St. John Fisher College | 0.78% | 0.23%(+0.555)#26 | 0.18%(+0.608)#490 |
| 27. | South Valley Stream | 0.78% | 0.23%(+0.553)#27 | 0.18%(+0.605)#492 |
| 28. | Mountain Dale | 0.77% | 0.23%(+0.541)#28 | 0.18%(+0.593)#503 |
| 29. | Bay Shore | 0.75% | 0.23%(+0.524)#29 | 0.18%(+0.577)#513 |
| 30. | Arlington | 0.75% | 0.23%(+0.520)#30 | 0.18%(+0.573)#515 |
| 31. | Menands | 0.73% | 0.23%(+0.503)#31 | 0.18%(+0.556)#523 |
| 32. | Canajoharie | 0.73% | 0.23%(+0.502)#32 | 0.18%(+0.555)#524 |
| 33. | Glasco | 0.70% | 0.23%(+0.474)#33 | 0.18%(+0.527)#547 |
| 34. | Chestnut Ridge | 0.68% | 0.23%(+0.448)#34 | 0.18%(+0.501)#565 |
| 35. | Nazareth College | 0.65% | 0.23%(+0.422)#35 | 0.18%(+0.475)#587 |
| 36. | Uniondale | 0.64% | 0.23%(+0.416)#36 | 0.18%(+0.469)#593 |
| 37. | Sharon Springs | 0.63% | 0.23%(+0.404)#37 | 0.18%(+0.457)#614 |
| 38. | Red Hook | 0.61% | 0.23%(+0.377)#38 | 0.18%(+0.430)#650 |
| 39. | Suny Oswego | 0.60% | 0.23%(+0.371)#39 | 0.18%(+0.423)#662 |
| 40. | Scarsdale | 0.59% | 0.23%(+0.364)#40 | 0.18%(+0.417)#669 |
| 41. | North Lindenhurst | 0.59% | 0.23%(+0.363)#41 | 0.18%(+0.416)#675 |
| 42. | Albany | 0.58% | 0.23%(+0.349)#42 | 0.18%(+0.402)#692 |
| 43. | Pomona | 0.57% | 0.23%(+0.345)#43 | 0.18%(+0.398)#698 |
| 44. | Baywood | 0.57% | 0.23%(+0.342)#44 | 0.18%(+0.395)#705 |
| 45. | Woodbury | 0.56% | 0.23%(+0.334)#45 | 0.18%(+0.387)#715 |
| 46. | Walton | 0.53% | 0.23%(+0.305)#46 | 0.18%(+0.358)#748 |
| 47. | Lake Carmel | 0.52% | 0.23%(+0.291)#47 | 0.18%(+0.343)#760 |
| 48. | East Greenbush | 0.52% | 0.23%(+0.289)#48 | 0.18%(+0.342)#762 |
| 49. | South Huntington | 0.51% | 0.23%(+0.286)#49 | 0.18%(+0.338)#768 |
| 50. | Rensselaer | 0.51% | 0.23%(+0.279)#50 | 0.18%(+0.332)#778 |
| 51. | Rye | 0.50% | 0.23%(+0.270)#51 | 0.18%(+0.323)#794 |
| 52. | East Islip | 0.46% | 0.23%(+0.236)#52 | 0.18%(+0.288)#835 |
| 53. | Endicott | 0.46% | 0.23%(+0.229)#53 | 0.18%(+0.282)#850 |
| 54. | Fort Drum | 0.45% | 0.23%(+0.219)#54 | 0.18%(+0.272)#867 |
| 55. | North Amityville | 0.44% | 0.23%(+0.209)#55 | 0.18%(+0.262)#889 |
| 56. | Central Islip | 0.44% | 0.23%(+0.207)#56 | 0.18%(+0.260)#894 |
| 57. | Scotchtown | 0.43% | 0.23%(+0.206)#57 | 0.18%(+0.259)#897 |
| 58. | Latham | 0.42% | 0.23%(+0.196)#58 | 0.18%(+0.249)#912 |
| 59. | South Floral Park | 0.41% | 0.23%(+0.186)#59 | 0.18%(+0.239)#931 |
| 60. | North Valley Stream | 0.41% | 0.23%(+0.182)#60 | 0.18%(+0.234)#939 |
| 61. | Roslyn Harbor | 0.41% | 0.23%(+0.178)#61 | 0.18%(+0.231)#952 |
| 62. | Lake Grove | 0.39% | 0.23%(+0.160)#62 | 0.18%(+0.213)#976 |
| 63. | Huntington Station | 0.38% | 0.23%(+0.150)#63 | 0.18%(+0.203)#999 |
| 64. | New York | 0.38% | 0.23%(+0.146)#64 | 0.18%(+0.199)#1,004 |
| 65. | Valley Stream | 0.37% | 0.23%(+0.144)#65 | 0.18%(+0.197)#1,013 |
| 66. | West Nyack | 0.37% | 0.23%(+0.143)#66 | 0.18%(+0.196)#1,014 |
| 67. | Belle Terre | 0.37% | 0.23%(+0.141)#67 | 0.18%(+0.194)#1,018 |
| 68. | Brentwood | 0.36% | 0.23%(+0.133)#68 | 0.18%(+0.186)#1,044 |
| 69. | Yonkers | 0.35% | 0.23%(+0.120)#69 | 0.18%(+0.173)#1,072 |
| 70. | Mineola | 0.33% | 0.23%(+0.106)#70 | 0.18%(+0.159)#1,109 |
| 71. | Coram | 0.33% | 0.23%(+0.101)#71 | 0.18%(+0.154)#1,122 |
| 72. | Fredonia | 0.31% | 0.23%(+0.080)#72 | 0.18%(+0.133)#1,183 |
| 73. | Elmira Heights | 0.31% | 0.23%(+0.078)#73 | 0.18%(+0.131)#1,186 |
| 74. | Beacon | 0.30% | 0.23%(+0.067)#74 | 0.18%(+0.120)#1,210 |
| 75. | Mount Vernon | 0.30% | 0.23%(+0.067)#75 | 0.18%(+0.120)#1,212 |
| 76. | Clifton Springs | 0.29% | 0.23%(+0.065)#76 | 0.18%(+0.118)#1,219 |
| 77. | Southampton | 0.29% | 0.23%(+0.062)#77 | 0.18%(+0.114)#1,231 |
| 78. | Big Flats | 0.27% | 0.23%(+0.045)#78 | 0.18%(+0.098)#1,286 |
| 79. | Syracuse | 0.27% | 0.23%(+0.044)#79 | 0.18%(+0.097)#1,292 |
| 80. | Hamlin | 0.27% | 0.23%(+0.041)#80 | 0.18%(+0.094)#1,298 |
| 81. | Roessleville | 0.27% | 0.23%(+0.039)#81 | 0.18%(+0.092)#1,306 |
| 82. | Siena College | 0.26% | 0.23%(+0.033)#82 | 0.18%(+0.086)#1,323 |
| 83. | Caledonia | 0.25% | 0.23%(+0.023)#83 | 0.18%(+0.076)#1,347 |
| 84. | Ithaca | 0.25% | 0.23%(+0.020)#84 | 0.18%(+0.073)#1,360 |
| 85. | Peekskill | 0.25% | 0.23%(+0.019)#85 | 0.18%(+0.072)#1,364 |
| 86. | West Bay Shore | 0.25% | 0.23%(+0.017)#86 | 0.18%(+0.070)#1,370 |
| 87. | East Rockaway | 0.23% | 0.23%(-0.000)#87 | 0.18%(+0.053)#1,443 |
| 88. | Rochester Institute Of Technology | 0.22% | 0.23%(-0.008)#88 | 0.18%(+0.045)#1,458 |
| 89. | Jefferson Valley Yorktown | 0.22% | 0.23%(-0.008)#89 | 0.18%(+0.045)#1,459 |
| 90. | New Rochelle | 0.20% | 0.23%(-0.033)#90 | 0.18%(+0.020)#1,558 |
| 91. | Rochester | 0.18% | 0.23%(-0.047)#91 | 0.18%(+0.006)#1,611 |
| 92. | Ogdensburg | 0.18% | 0.23%(-0.047)#92 | 0.18%(+0.006)#1,613 |
| 93. | Hempstead | 0.18% | 0.23%(-0.049)#93 | 0.18%(+0.004)#1,631 |
| 94. | Cortland | 0.17% | 0.23%(-0.058)#94 | 0.18%(-0.005)#1,682 |
| 95. | Orange Lake | 0.17% | 0.23%(-0.060)#95 | 0.18%(-0.007)#1,697 |
| 96. | Brockport | 0.17% | 0.23%(-0.062)#96 | 0.18%(-0.009)#1,709 |
| 97. | New Cassel | 0.17% | 0.23%(-0.063)#97 | 0.18%(-0.010)#1,719 |
| 98. | Buffalo | 0.16% | 0.23%(-0.071)#98 | 0.18%(-0.018)#1,751 |
| 99. | Geneva | 0.16% | 0.23%(-0.071)#99 | 0.18%(-0.018)#1,752 |
| 100. | Middletown | 0.16% | 0.23%(-0.073)#100 | 0.18%(-0.020)#1,767 |
Common Questions
What are the Top 10 Cities with the Highest Percentage of Nigerian Population in New York?
Top 10 Cities with the Highest Percentage of Nigerian Population in New York are:
#1
13.87%
#2
3.65%
#3
3.01%
#4
2.64%
#5
2.04%
#6
1.57%
#7
1.35%
#8
1.29%
#9
1.27%
#10
1.05%
What city has the Highest Percentage of Nigerian Population in New York?
Jefferson Heights has the Highest Percentage of Nigerian Population in New York with 13.87%.
What is the Percentage of Nigerian Population in the State of New York?
Percentage of Nigerian Population in New York is 0.23%.
What is the Percentage of Nigerian Population in the United States?
Percentage of Nigerian Population in the United States is 0.18%.