Cities with the Highest Percentage of Nigerian Population in Illinois
RELATED REPORTS & OPTIONS
Nigerian
Illinois
Compare Cities
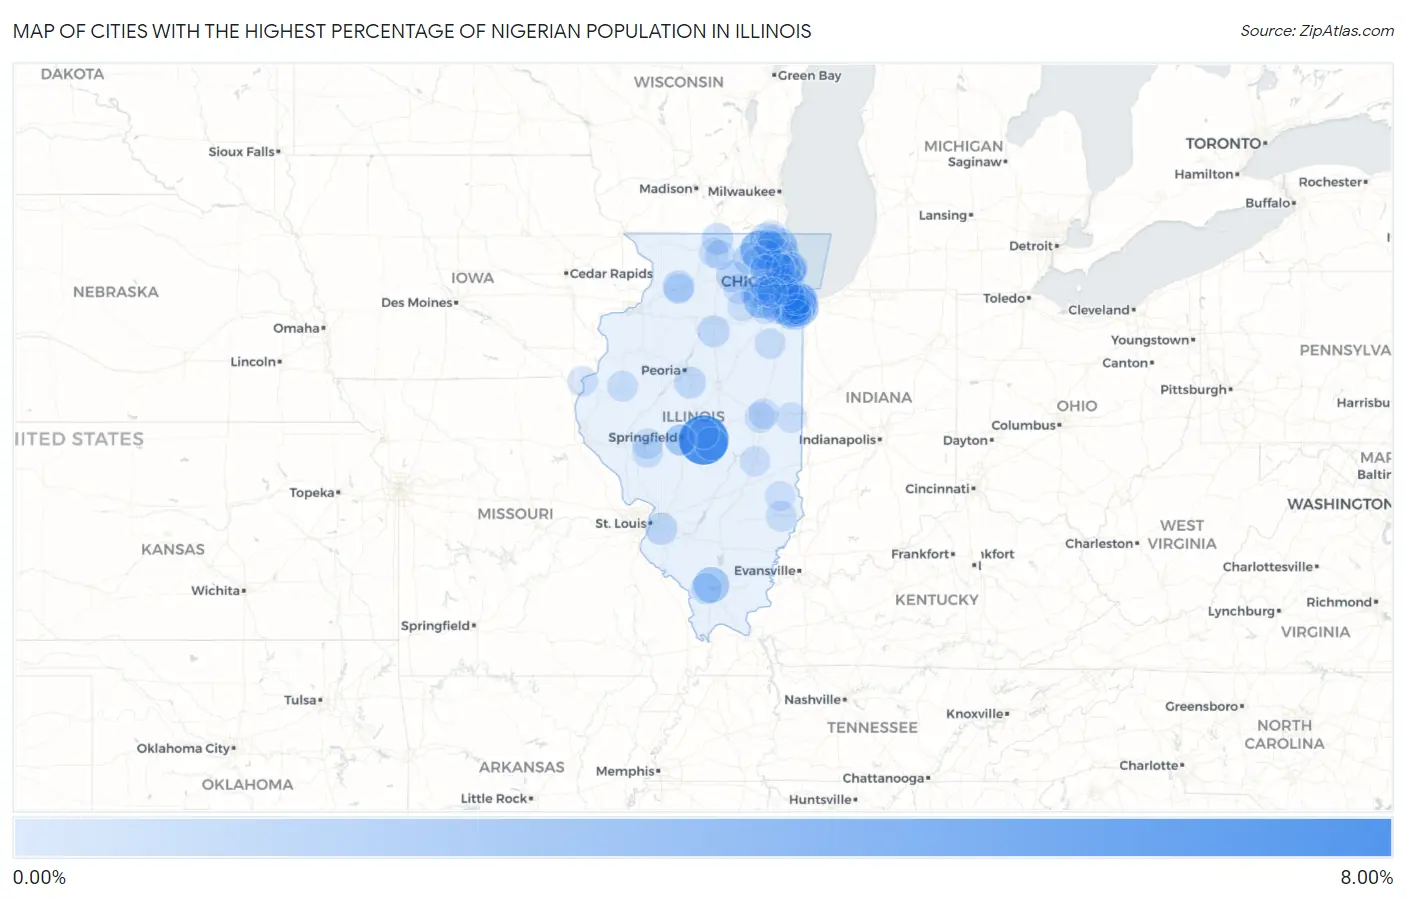
Map of Cities with the Highest Percentage of Nigerian Population in Illinois
0.00%
8.00%
Cities with the Highest Percentage of Nigerian Population in Illinois
| City | Nigerian | vs State | vs National | |
| 1. | Mount Auburn | 7.95% | 0.22%(+7.73)#1 | 0.18%(+7.78)#15 |
| 2. | Prairie Grove | 3.81% | 0.22%(+3.59)#2 | 0.18%(+3.64)#61 |
| 3. | Lynwood | 2.93% | 0.22%(+2.70)#3 | 0.18%(+2.75)#95 |
| 4. | Plainfield | 2.48% | 0.22%(+2.26)#4 | 0.18%(+2.31)#114 |
| 5. | Calumet City | 2.37% | 0.22%(+2.14)#5 | 0.18%(+2.19)#121 |
| 6. | Cambria | 2.36% | 0.22%(+2.13)#6 | 0.18%(+2.18)#122 |
| 7. | South Holland | 2.32% | 0.22%(+2.09)#7 | 0.18%(+2.14)#123 |
| 8. | Bannockburn | 1.60% | 0.22%(+1.37)#8 | 0.18%(+1.42)#201 |
| 9. | Matteson | 1.59% | 0.22%(+1.36)#9 | 0.18%(+1.41)#202 |
| 10. | Lansing | 1.57% | 0.22%(+1.35)#10 | 0.18%(+1.40)#206 |
| 11. | Hazel Crest | 1.41% | 0.22%(+1.19)#11 | 0.18%(+1.24)#236 |
| 12. | Skokie | 1.29% | 0.22%(+1.07)#12 | 0.18%(+1.12)#271 |
| 13. | Posen | 1.29% | 0.22%(+1.06)#13 | 0.18%(+1.11)#275 |
| 14. | Blue Mound | 1.28% | 0.22%(+1.06)#14 | 0.18%(+1.11)#276 |
| 15. | Huntley | 1.24% | 0.22%(+1.01)#15 | 0.18%(+1.06)#290 |
| 16. | Richton Park | 1.19% | 0.22%(+0.972)#16 | 0.18%(+1.02)#301 |
| 17. | Lincolnwood | 1.16% | 0.22%(+0.938)#17 | 0.18%(+0.985)#314 |
| 18. | Flossmoor | 1.00% | 0.22%(+0.777)#18 | 0.18%(+0.824)#371 |
| 19. | Broadview | 0.99% | 0.22%(+0.770)#19 | 0.18%(+0.817)#373 |
| 20. | Swansea | 0.99% | 0.22%(+0.765)#20 | 0.18%(+0.812)#377 |
| 21. | Berkeley | 0.98% | 0.22%(+0.762)#21 | 0.18%(+0.809)#381 |
| 22. | Dekalb | 0.97% | 0.22%(+0.746)#22 | 0.18%(+0.792)#395 |
| 23. | Olympia Fields | 0.95% | 0.22%(+0.732)#23 | 0.18%(+0.779)#401 |
| 24. | University Park | 0.86% | 0.22%(+0.637)#24 | 0.18%(+0.684)#444 |
| 25. | Tonica | 0.86% | 0.22%(+0.637)#25 | 0.18%(+0.684)#445 |
| 26. | Sterling | 0.77% | 0.22%(+0.545)#26 | 0.18%(+0.592)#505 |
| 27. | Tremont | 0.76% | 0.22%(+0.537)#27 | 0.18%(+0.584)#512 |
| 28. | Park Forest | 0.72% | 0.22%(+0.500)#28 | 0.18%(+0.547)#529 |
| 29. | Roscoe | 0.70% | 0.22%(+0.478)#29 | 0.18%(+0.525)#548 |
| 30. | Southern View | 0.67% | 0.22%(+0.450)#30 | 0.18%(+0.497)#567 |
| 31. | Carbondale | 0.67% | 0.22%(+0.449)#31 | 0.18%(+0.496)#569 |
| 32. | Riverdale | 0.64% | 0.22%(+0.414)#32 | 0.18%(+0.461)#606 |
| 33. | Country Club Hills | 0.63% | 0.22%(+0.411)#33 | 0.18%(+0.458)#610 |
| 34. | Glenwood | 0.61% | 0.22%(+0.386)#34 | 0.18%(+0.433)#643 |
| 35. | Thornton | 0.60% | 0.22%(+0.377)#35 | 0.18%(+0.424)#661 |
| 36. | East Hazel Crest | 0.60% | 0.22%(+0.374)#36 | 0.18%(+0.421)#665 |
| 37. | North Chicago | 0.57% | 0.22%(+0.350)#37 | 0.18%(+0.397)#700 |
| 38. | Fox Lake | 0.56% | 0.22%(+0.342)#38 | 0.18%(+0.389)#713 |
| 39. | Hoffman Estates | 0.56% | 0.22%(+0.334)#39 | 0.18%(+0.381)#719 |
| 40. | Homewood | 0.55% | 0.22%(+0.331)#40 | 0.18%(+0.378)#725 |
| 41. | Westchester | 0.55% | 0.22%(+0.329)#41 | 0.18%(+0.375)#728 |
| 42. | Rolling Meadows | 0.55% | 0.22%(+0.326)#42 | 0.18%(+0.373)#731 |
| 43. | Merrionette Park | 0.50% | 0.22%(+0.274)#43 | 0.18%(+0.321)#797 |
| 44. | Park City | 0.49% | 0.22%(+0.271)#44 | 0.18%(+0.318)#803 |
| 45. | Chicago | 0.48% | 0.22%(+0.255)#45 | 0.18%(+0.302)#823 |
| 46. | Hinsdale | 0.47% | 0.22%(+0.243)#46 | 0.18%(+0.290)#833 |
| 47. | Murrayville | 0.45% | 0.22%(+0.229)#47 | 0.18%(+0.276)#859 |
| 48. | Evanston | 0.42% | 0.22%(+0.202)#48 | 0.18%(+0.249)#911 |
| 49. | Vernon Hills | 0.41% | 0.22%(+0.192)#49 | 0.18%(+0.239)#930 |
| 50. | Frankfort | 0.41% | 0.22%(+0.187)#50 | 0.18%(+0.234)#944 |
| 51. | Sauk Village | 0.41% | 0.22%(+0.183)#51 | 0.18%(+0.230)#953 |
| 52. | South Chicago Heights | 0.40% | 0.22%(+0.179)#52 | 0.18%(+0.226)#958 |
| 53. | Herscher | 0.40% | 0.22%(+0.177)#53 | 0.18%(+0.223)#964 |
| 54. | South Jacksonville | 0.40% | 0.22%(+0.173)#54 | 0.18%(+0.220)#968 |
| 55. | Aurora | 0.38% | 0.22%(+0.161)#55 | 0.18%(+0.208)#985 |
| 56. | Macomb | 0.38% | 0.22%(+0.159)#56 | 0.18%(+0.206)#993 |
| 57. | Springfield | 0.38% | 0.22%(+0.154)#57 | 0.18%(+0.201)#1,003 |
| 58. | Sumner | 0.37% | 0.22%(+0.151)#58 | 0.18%(+0.198)#1,008 |
| 59. | Hinckley | 0.37% | 0.22%(+0.149)#59 | 0.18%(+0.196)#1,015 |
| 60. | Lindenhurst | 0.37% | 0.22%(+0.145)#60 | 0.18%(+0.192)#1,025 |
| 61. | Savoy | 0.36% | 0.22%(+0.135)#61 | 0.18%(+0.181)#1,053 |
| 62. | Bolingbrook | 0.35% | 0.22%(+0.126)#62 | 0.18%(+0.173)#1,073 |
| 63. | Nauvoo | 0.35% | 0.22%(+0.126)#63 | 0.18%(+0.173)#1,074 |
| 64. | Crestwood | 0.34% | 0.22%(+0.122)#64 | 0.18%(+0.169)#1,083 |
| 65. | Round Lake | 0.34% | 0.22%(+0.120)#65 | 0.18%(+0.167)#1,091 |
| 66. | Crest Hill | 0.33% | 0.22%(+0.109)#66 | 0.18%(+0.156)#1,115 |
| 67. | Mount Prospect | 0.33% | 0.22%(+0.103)#67 | 0.18%(+0.150)#1,133 |
| 68. | Arlington Heights | 0.31% | 0.22%(+0.090)#68 | 0.18%(+0.137)#1,170 |
| 69. | Warrenville | 0.29% | 0.22%(+0.071)#69 | 0.18%(+0.118)#1,218 |
| 70. | Oak Lawn | 0.29% | 0.22%(+0.069)#70 | 0.18%(+0.116)#1,226 |
| 71. | Mattoon | 0.29% | 0.22%(+0.069)#71 | 0.18%(+0.115)#1,228 |
| 72. | Catlin | 0.29% | 0.22%(+0.064)#72 | 0.18%(+0.111)#1,239 |
| 73. | Rock Falls | 0.28% | 0.22%(+0.058)#73 | 0.18%(+0.105)#1,260 |
| 74. | Schaumburg | 0.28% | 0.22%(+0.057)#74 | 0.18%(+0.104)#1,264 |
| 75. | New Lenox | 0.28% | 0.22%(+0.056)#75 | 0.18%(+0.103)#1,266 |
| 76. | Lisle | 0.28% | 0.22%(+0.054)#76 | 0.18%(+0.101)#1,278 |
| 77. | Burnham | 0.27% | 0.22%(+0.051)#77 | 0.18%(+0.097)#1,290 |
| 78. | Urbana | 0.27% | 0.22%(+0.048)#78 | 0.18%(+0.095)#1,295 |
| 79. | Alsip | 0.25% | 0.22%(+0.032)#79 | 0.18%(+0.079)#1,340 |
| 80. | Illiopolis | 0.24% | 0.22%(+0.021)#80 | 0.18%(+0.068)#1,377 |
| 81. | Oak Park | 0.24% | 0.22%(+0.015)#81 | 0.18%(+0.062)#1,405 |
| 82. | Cherry Valley | 0.24% | 0.22%(+0.015)#82 | 0.18%(+0.061)#1,409 |
| 83. | Joliet | 0.24% | 0.22%(+0.013)#83 | 0.18%(+0.060)#1,420 |
| 84. | Chicago Heights | 0.23% | 0.22%(+0.011)#84 | 0.18%(+0.058)#1,425 |
| 85. | Dolton | 0.23% | 0.22%(+0.008)#85 | 0.18%(+0.054)#1,438 |
| 86. | Round Lake Park | 0.22% | 0.22%(-0.004)#86 | 0.18%(+0.043)#1,468 |
| 87. | Justice | 0.21% | 0.22%(-0.015)#87 | 0.18%(+0.032)#1,512 |
| 88. | Rockford | 0.21% | 0.22%(-0.015)#88 | 0.18%(+0.031)#1,514 |
| 89. | Oblong | 0.21% | 0.22%(-0.017)#89 | 0.18%(+0.030)#1,521 |
| 90. | Lake Barrington | 0.20% | 0.22%(-0.018)#90 | 0.18%(+0.029)#1,524 |
| 91. | Morton Grove | 0.20% | 0.22%(-0.022)#91 | 0.18%(+0.025)#1,540 |
| 92. | Montgomery | 0.19% | 0.22%(-0.029)#92 | 0.18%(+0.018)#1,562 |
| 93. | Carpentersville | 0.19% | 0.22%(-0.035)#93 | 0.18%(+0.012)#1,587 |
| 94. | Naperville | 0.18% | 0.22%(-0.041)#94 | 0.18%(+0.005)#1,618 |
| 95. | Des Plaines | 0.18% | 0.22%(-0.046)#95 | 0.18%(+0.001)#1,654 |
| 96. | Newark | 0.17% | 0.22%(-0.050)#96 | 0.18%(-0.003)#1,667 |
| 97. | Antioch | 0.17% | 0.22%(-0.053)#97 | 0.18%(-0.006)#1,689 |
| 98. | Crete | 0.17% | 0.22%(-0.056)#98 | 0.18%(-0.010)#1,711 |
| 99. | Streamwood | 0.16% | 0.22%(-0.058)#99 | 0.18%(-0.011)#1,722 |
| 100. | Woodridge | 0.16% | 0.22%(-0.064)#100 | 0.18%(-0.017)#1,745 |
Common Questions
What are the Top 10 Cities with the Highest Percentage of Nigerian Population in Illinois?
Top 10 Cities with the Highest Percentage of Nigerian Population in Illinois are:
#1
7.95%
#2
3.81%
#3
2.93%
#4
2.48%
#5
2.37%
#6
2.36%
#7
2.32%
#8
1.60%
#9
1.59%
#10
1.57%
What city has the Highest Percentage of Nigerian Population in Illinois?
Mount Auburn has the Highest Percentage of Nigerian Population in Illinois with 7.95%.
What is the Percentage of Nigerian Population in the State of Illinois?
Percentage of Nigerian Population in Illinois is 0.22%.
What is the Percentage of Nigerian Population in the United States?
Percentage of Nigerian Population in the United States is 0.18%.