Cities with the Highest Percentage of Nigerian Population in Missouri
RELATED REPORTS & OPTIONS
Nigerian
Missouri
Compare Cities
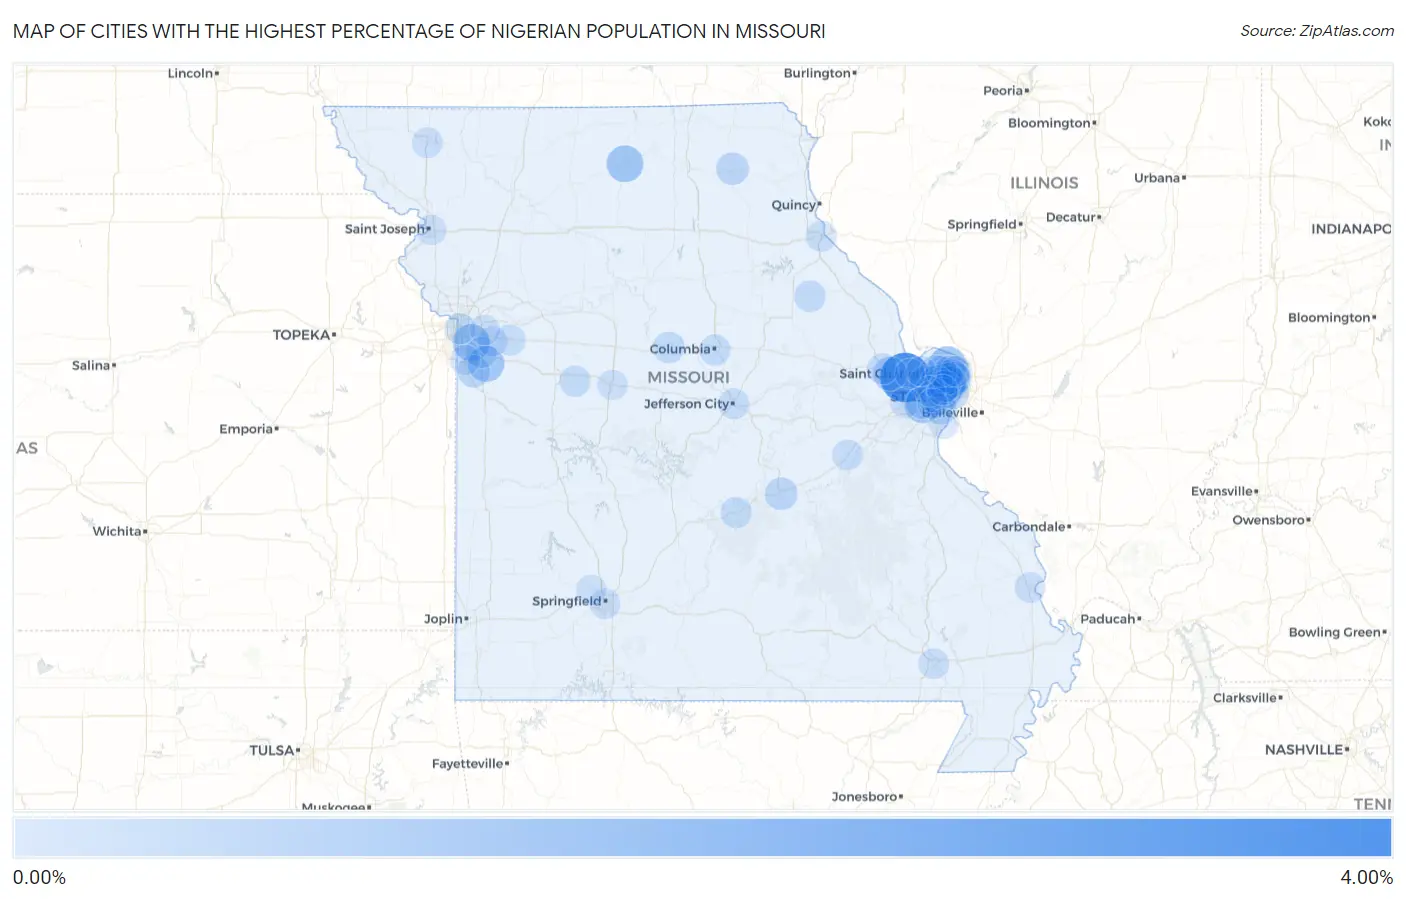
Map of Cities with the Highest Percentage of Nigerian Population in Missouri
0.00%
4.00%
Cities with the Highest Percentage of Nigerian Population in Missouri
| City | Nigerian | vs State | vs National | |
| 1. | Cottleville | 3.72% | 0.11%(+3.62)#1 | 0.18%(+3.55)#65 |
| 2. | Pasadena Hills | 1.81% | 0.11%(+1.70)#2 | 0.18%(+1.63)#170 |
| 3. | Old Jamestown | 1.33% | 0.11%(+1.23)#3 | 0.18%(+1.16)#257 |
| 4. | Raytown | 1.26% | 0.11%(+1.15)#4 | 0.18%(+1.08)#283 |
| 5. | Milan | 1.21% | 0.11%(+1.10)#5 | 0.18%(+1.03)#297 |
| 6. | Twin Oaks | 1.13% | 0.11%(+1.03)#6 | 0.18%(+0.955)#325 |
| 7. | Greenwood | 1.13% | 0.11%(+1.02)#7 | 0.18%(+0.950)#327 |
| 8. | Castle Point | 1.12% | 0.11%(+1.02)#8 | 0.18%(+0.947)#328 |
| 9. | Flordell Hills | 0.83% | 0.11%(+0.723)#9 | 0.18%(+0.653)#468 |
| 10. | Bellefontaine Neighbors | 0.76% | 0.11%(+0.656)#10 | 0.18%(+0.586)#511 |
| 11. | Lake St Louis | 0.74% | 0.11%(+0.638)#11 | 0.18%(+0.567)#517 |
| 12. | Maryland Heights | 0.73% | 0.11%(+0.624)#12 | 0.18%(+0.554)#526 |
| 13. | Norwood Court | 0.60% | 0.11%(+0.497)#13 | 0.18%(+0.427)#652 |
| 14. | Rock Hill | 0.59% | 0.11%(+0.487)#14 | 0.18%(+0.416)#672 |
| 15. | St Louis | 0.59% | 0.11%(+0.486)#15 | 0.18%(+0.416)#676 |
| 16. | Hanley Hills | 0.50% | 0.11%(+0.391)#16 | 0.18%(+0.321)#798 |
| 17. | Calverton Park | 0.46% | 0.11%(+0.358)#17 | 0.18%(+0.288)#836 |
| 18. | Manchester | 0.46% | 0.11%(+0.355)#18 | 0.18%(+0.285)#841 |
| 19. | Rolla | 0.44% | 0.11%(+0.339)#19 | 0.18%(+0.269)#877 |
| 20. | Edina | 0.44% | 0.11%(+0.330)#20 | 0.18%(+0.259)#895 |
| 21. | Raymore | 0.43% | 0.11%(+0.321)#21 | 0.18%(+0.250)#909 |
| 22. | Hazelwood | 0.42% | 0.11%(+0.317)#22 | 0.18%(+0.246)#917 |
| 23. | Jennings | 0.42% | 0.11%(+0.310)#23 | 0.18%(+0.240)#929 |
| 24. | Frontenac | 0.33% | 0.11%(+0.225)#24 | 0.18%(+0.154)#1,120 |
| 25. | St John | 0.32% | 0.11%(+0.214)#25 | 0.18%(+0.143)#1,153 |
| 26. | St Ann | 0.31% | 0.11%(+0.204)#26 | 0.18%(+0.134)#1,181 |
| 27. | Clayton | 0.30% | 0.11%(+0.197)#27 | 0.18%(+0.126)#1,200 |
| 28. | Lakeshire | 0.28% | 0.11%(+0.176)#28 | 0.18%(+0.106)#1,258 |
| 29. | Ferguson | 0.27% | 0.11%(+0.170)#29 | 0.18%(+0.099)#1,284 |
| 30. | Lee S Summit | 0.25% | 0.11%(+0.148)#30 | 0.18%(+0.078)#1,343 |
| 31. | Greendale | 0.24% | 0.11%(+0.135)#31 | 0.18%(+0.064)#1,392 |
| 32. | Vandalia | 0.24% | 0.11%(+0.131)#32 | 0.18%(+0.061)#1,413 |
| 33. | Florissant | 0.23% | 0.11%(+0.129)#33 | 0.18%(+0.058)#1,426 |
| 34. | Boonville | 0.23% | 0.11%(+0.128)#34 | 0.18%(+0.057)#1,427 |
| 35. | St Robert | 0.21% | 0.11%(+0.105)#35 | 0.18%(+0.034)#1,502 |
| 36. | Kansas City | 0.18% | 0.11%(+0.077)#36 | 0.18%(+0.006)#1,610 |
| 37. | Columbia | 0.18% | 0.11%(+0.071)#37 | 0.18%(+0.001)#1,650 |
| 38. | Whiteman Afb | 0.17% | 0.11%(+0.065)#38 | 0.18%(-0.006)#1,688 |
| 39. | Black Jack | 0.15% | 0.11%(+0.046)#39 | 0.18%(-0.025)#1,803 |
| 40. | Wentzville | 0.14% | 0.11%(+0.038)#40 | 0.18%(-0.032)#1,853 |
| 41. | Spanish Lake | 0.14% | 0.11%(+0.033)#41 | 0.18%(-0.037)#1,875 |
| 42. | Jefferson City | 0.14% | 0.11%(+0.031)#42 | 0.18%(-0.040)#1,894 |
| 43. | Oak Grove | 0.13% | 0.11%(+0.027)#43 | 0.18%(-0.043)#1,914 |
| 44. | Hannibal | 0.11% | 0.11%(+0.006)#44 | 0.18%(-0.064)#2,043 |
| 45. | Sullivan | 0.11% | 0.11%(+0.003)#45 | 0.18%(-0.067)#2,073 |
| 46. | Creve Coeur | 0.10% | 0.11%(-0.004)#46 | 0.18%(-0.074)#2,116 |
| 47. | Maryville | 0.094% | 0.11%(-0.012)#47 | 0.18%(-0.082)#2,175 |
| 48. | Springfield | 0.089% | 0.11%(-0.016)#48 | 0.18%(-0.086)#2,207 |
| 49. | Cape Girardeau | 0.083% | 0.11%(-0.022)#49 | 0.18%(-0.093)#2,263 |
| 50. | Poplar Bluff | 0.074% | 0.11%(-0.032)#50 | 0.18%(-0.102)#2,324 |
| 51. | Blue Springs | 0.053% | 0.11%(-0.052)#51 | 0.18%(-0.123)#2,513 |
| 52. | Grandview | 0.050% | 0.11%(-0.055)#52 | 0.18%(-0.126)#2,529 |
| 53. | University City | 0.046% | 0.11%(-0.059)#53 | 0.18%(-0.130)#2,575 |
| 54. | Wildwood | 0.040% | 0.11%(-0.066)#54 | 0.18%(-0.136)#2,636 |
| 55. | Sedalia | 0.032% | 0.11%(-0.073)#55 | 0.18%(-0.144)#2,719 |
| 56. | Willard | 0.032% | 0.11%(-0.074)#56 | 0.18%(-0.144)#2,727 |
| 57. | St Peters | 0.031% | 0.11%(-0.074)#57 | 0.18%(-0.145)#2,734 |
| 58. | Kirkwood | 0.031% | 0.11%(-0.075)#58 | 0.18%(-0.145)#2,737 |
| 59. | Independence | 0.023% | 0.11%(-0.082)#59 | 0.18%(-0.153)#2,808 |
| 60. | St Charles | 0.013% | 0.11%(-0.093)#60 | 0.18%(-0.163)#2,916 |
| 61. | Oakville | 0.011% | 0.11%(-0.094)#61 | 0.18%(-0.164)#2,935 |
| 62. | St Joseph | 0.0069% | 0.11%(-0.098)#62 | 0.18%(-0.169)#2,964 |
Common Questions
What are the Top 10 Cities with the Highest Percentage of Nigerian Population in Missouri?
Top 10 Cities with the Highest Percentage of Nigerian Population in Missouri are:
#1
3.72%
#2
1.81%
#3
1.33%
#4
1.26%
#5
1.21%
#6
1.13%
#7
1.13%
#8
1.12%
#9
0.83%
#10
0.76%
What city has the Highest Percentage of Nigerian Population in Missouri?
Cottleville has the Highest Percentage of Nigerian Population in Missouri with 3.72%.
What is the Percentage of Nigerian Population in the State of Missouri?
Percentage of Nigerian Population in Missouri is 0.11%.
What is the Percentage of Nigerian Population in the United States?
Percentage of Nigerian Population in the United States is 0.18%.