Cities with the Highest Percentage of Immigrants from Philippines in Kansas
RELATED REPORTS & OPTIONS
Philippines
Kansas
Compare Cities
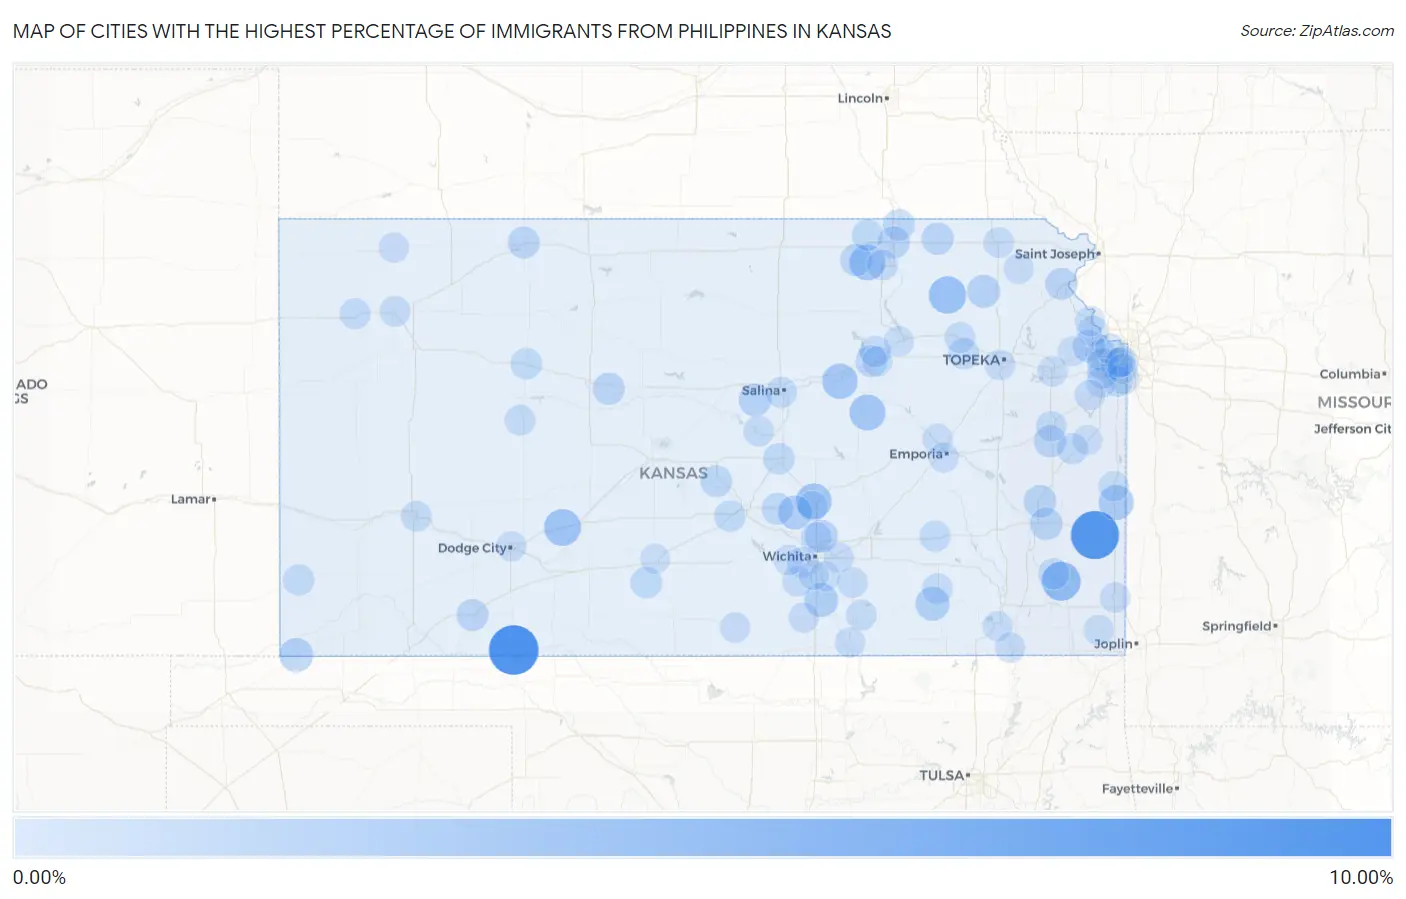
Map of Cities with the Highest Percentage of Immigrants from Philippines in Kansas
0.00%
10.00%
Cities with the Highest Percentage of Immigrants from Philippines in Kansas
| City | Philippines | vs State | vs National | |
| 1. | Englewood | 9.41% | 0.19%(+9.22)#-1 | 0.60%(+8.81)#0 |
| 2. | Monument | 8.97% | 0.19%(+8.79)#0 | 0.60%(+8.37)#1 |
| 3. | Redfield | 8.70% | 0.19%(+8.51)#1 | 0.60%(+8.10)#2 |
| 4. | St Paul | 4.14% | 0.19%(+3.95)#2 | 0.60%(+3.54)#3 |
| 5. | Onaga | 3.40% | 0.19%(+3.21)#3 | 0.60%(+2.80)#4 |
| 6. | Offerle | 3.14% | 0.19%(+2.95)#4 | 0.60%(+2.54)#5 |
| 7. | Herington | 2.70% | 0.19%(+2.51)#5 | 0.60%(+2.10)#6 |
| 8. | Barnes | 2.67% | 0.19%(+2.48)#6 | 0.60%(+2.07)#7 |
| 9. | North Newton | 2.61% | 0.19%(+2.43)#7 | 0.60%(+2.01)#8 |
| 10. | Enterprise | 2.44% | 0.19%(+2.25)#8 | 0.60%(+1.84)#9 |
| 11. | Prescott | 2.24% | 0.19%(+2.06)#9 | 0.60%(+1.64)#10 |
| 12. | Halstead | 1.83% | 0.19%(+1.64)#10 | 0.60%(+1.23)#11 |
| 13. | Moline | 1.80% | 0.19%(+1.61)#11 | 0.60%(+1.20)#12 |
| 14. | Elkhart | 1.69% | 0.19%(+1.50)#12 | 0.60%(+1.09)#13 |
| 15. | Belle Plaine | 1.66% | 0.19%(+1.47)#13 | 0.60%(+1.06)#14 |
| 16. | Circleville | 1.37% | 0.19%(+1.18)#14 | 0.60%(+0.770)#15 |
| 17. | Kechi | 1.29% | 0.19%(+1.10)#15 | 0.60%(+0.689)#16 |
| 18. | Brookville | 1.22% | 0.19%(+1.04)#16 | 0.60%(+0.625)#17 |
| 19. | Colony | 1.12% | 0.19%(+0.930)#17 | 0.60%(+0.518)#18 |
| 20. | La Harpe | 1.08% | 0.19%(+0.894)#18 | 0.60%(+0.481)#19 |
| 21. | Axtell | 1.02% | 0.19%(+0.829)#19 | 0.60%(+0.417)#20 |
| 22. | Basehor | 0.99% | 0.19%(+0.798)#20 | 0.60%(+0.385)#21 |
| 23. | Victoria | 0.97% | 0.19%(+0.787)#21 | 0.60%(+0.374)#22 |
| 24. | Princeton | 0.96% | 0.19%(+0.774)#22 | 0.60%(+0.362)#23 |
| 25. | Greenleaf | 0.96% | 0.19%(+0.771)#23 | 0.60%(+0.359)#24 |
| 26. | Norton | 0.92% | 0.19%(+0.729)#24 | 0.60%(+0.316)#25 |
| 27. | Atchison | 0.90% | 0.19%(+0.708)#25 | 0.60%(+0.296)#26 |
| 28. | Meade | 0.89% | 0.19%(+0.703)#26 | 0.60%(+0.290)#27 |
| 29. | Marysville | 0.88% | 0.19%(+0.692)#27 | 0.60%(+0.279)#28 |
| 30. | Oketo | 0.84% | 0.19%(+0.653)#28 | 0.60%(+0.241)#29 |
| 31. | Edwardsville | 0.80% | 0.19%(+0.614)#29 | 0.60%(+0.201)#30 |
| 32. | Sterling | 0.80% | 0.19%(+0.611)#30 | 0.60%(+0.198)#31 |
| 33. | Junction City | 0.73% | 0.19%(+0.543)#31 | 0.60%(+0.130)#32 |
| 34. | Burrton | 0.71% | 0.19%(+0.522)#32 | 0.60%(+0.109)#33 |
| 35. | Mcpherson | 0.67% | 0.19%(+0.487)#33 | 0.60%(+0.074)#34 |
| 36. | Coats | 0.66% | 0.19%(+0.471)#34 | 0.60%(+0.058)#35 |
| 37. | Wakeeney | 0.61% | 0.19%(+0.424)#35 | 0.60%(+0.011)#36 |
| 38. | Hanover | 0.58% | 0.19%(+0.391)#36 | 0.60%(-0.022)#37 |
| 39. | Partridge | 0.57% | 0.19%(+0.381)#37 | 0.60%(-0.032)#38 |
| 40. | Manter | 0.53% | 0.19%(+0.339)#38 | 0.60%(-0.073)#39 |
| 41. | Maple Hill | 0.52% | 0.19%(+0.337)#39 | 0.60%(-0.075)#40 |
| 42. | Fort Riley | 0.52% | 0.19%(+0.335)#40 | 0.60%(-0.078)#41 |
| 43. | Eureka | 0.49% | 0.19%(+0.304)#41 | 0.60%(-0.108)#42 |
| 44. | Brewster | 0.48% | 0.19%(+0.297)#42 | 0.60%(-0.115)#43 |
| 45. | Salina | 0.47% | 0.19%(+0.279)#43 | 0.60%(-0.133)#44 |
| 46. | St Marys | 0.45% | 0.19%(+0.264)#44 | 0.60%(-0.149)#45 |
| 47. | Lane | 0.44% | 0.19%(+0.253)#45 | 0.60%(-0.159)#46 |
| 48. | Erie | 0.43% | 0.19%(+0.243)#46 | 0.60%(-0.170)#47 |
| 49. | Park City | 0.39% | 0.19%(+0.202)#47 | 0.60%(-0.210)#48 |
| 50. | Colby | 0.39% | 0.19%(+0.202)#48 | 0.60%(-0.211)#49 |
| 51. | Leawood | 0.39% | 0.19%(+0.201)#49 | 0.60%(-0.212)#392 |
| 52. | Ransom | 0.38% | 0.19%(+0.190)#50 | 0.60%(-0.222)#393 |
| 53. | Howard | 0.37% | 0.19%(+0.179)#51 | 0.60%(-0.233)#394 |
| 54. | Garden City | 0.36% | 0.19%(+0.171)#52 | 0.60%(-0.242)#395 |
| 55. | Lansing | 0.34% | 0.19%(+0.151)#53 | 0.60%(-0.262)#396 |
| 56. | Merriam | 0.33% | 0.19%(+0.147)#54 | 0.60%(-0.265)#397 |
| 57. | Wichita | 0.33% | 0.19%(+0.146)#55 | 0.60%(-0.267)#804 |
| 58. | Fairview | 0.30% | 0.19%(+0.112)#56 | 0.60%(-0.300)#805 |
| 59. | Shawnee | 0.29% | 0.19%(+0.107)#57 | 0.60%(-0.306)#1,195 |
| 60. | Marquette | 0.28% | 0.19%(+0.097)#58 | 0.60%(-0.315)#1,196 |
| 61. | Overland Park | 0.28% | 0.19%(+0.088)#59 | 0.60%(-0.325)#1,197 |
| 62. | Waterville | 0.27% | 0.19%(+0.085)#60 | 0.60%(-0.328)#1,198 |
| 63. | Winfield | 0.27% | 0.19%(+0.084)#61 | 0.60%(-0.329)#1,199 |
| 64. | Ottawa | 0.25% | 0.19%(+0.067)#62 | 0.60%(-0.346)#1,200 |
| 65. | Douglass | 0.25% | 0.19%(+0.065)#63 | 0.60%(-0.348)#1,201 |
| 66. | Clearwater | 0.24% | 0.19%(+0.049)#64 | 0.60%(-0.364)#1,202 |
| 67. | Roeland Park | 0.22% | 0.19%(+0.032)#65 | 0.60%(-0.381)#1,203 |
| 68. | Anthony | 0.22% | 0.19%(+0.031)#66 | 0.60%(-0.381)#1,204 |
| 69. | Goddard | 0.21% | 0.19%(+0.028)#67 | 0.60%(-0.385)#1,205 |
| 70. | Lawrence | 0.21% | 0.19%(+0.021)#68 | 0.60%(-0.392)#1,206 |
| 71. | Topeka | 0.21% | 0.19%(+0.021)#69 | 0.60%(-0.392)#1,207 |
| 72. | Wellington | 0.21% | 0.19%(+0.020)#70 | 0.60%(-0.392)#1,208 |
| 73. | Americus | 0.19% | 0.19%(+0.007)#71 | 0.60%(-0.405)#1,209 |
| 74. | Pittsburg | 0.18% | 0.19%(-0.008)#72 | 0.60%(-0.420)#1,210 |
| 75. | Horton | 0.18% | 0.19%(-0.011)#73 | 0.60%(-0.424)#1,211 |
| 76. | Andover | 0.17% | 0.19%(-0.012)#74 | 0.60%(-0.425)#1,212 |
| 77. | Grandview Plaza | 0.17% | 0.19%(-0.020)#75 | 0.60%(-0.432)#1,213 |
| 78. | Atwood | 0.16% | 0.19%(-0.026)#76 | 0.60%(-0.438)#1,214 |
| 79. | Newton | 0.15% | 0.19%(-0.036)#77 | 0.60%(-0.449)#1,215 |
| 80. | Olathe | 0.15% | 0.19%(-0.039)#78 | 0.60%(-0.451)#1,220 |
| 81. | Dodge City | 0.13% | 0.19%(-0.054)#79 | 0.60%(-0.466)#1,221 |
| 82. | Lenexa | 0.12% | 0.19%(-0.067)#80 | 0.60%(-0.480)#1,222 |
| 83. | Arkansas City | 0.12% | 0.19%(-0.070)#81 | 0.60%(-0.483)#1,223 |
| 84. | Pleasanton | 0.12% | 0.19%(-0.071)#82 | 0.60%(-0.484)#1,224 |
| 85. | Manhattan | 0.11% | 0.19%(-0.077)#83 | 0.60%(-0.489)#1,225 |
| 86. | Columbus | 0.10% | 0.19%(-0.084)#84 | 0.60%(-0.497)#1,226 |
| 87. | Gardner | 0.098% | 0.19%(-0.089)#85 | 0.60%(-0.502)#1,227 |
| 88. | Emporia | 0.091% | 0.19%(-0.096)#86 | 0.60%(-0.509)#1,228 |
| 89. | Independence | 0.082% | 0.19%(-0.105)#87 | 0.60%(-0.518)#1,229 |
| 90. | Coffeyville | 0.079% | 0.19%(-0.108)#88 | 0.60%(-0.521)#1,230 |
| 91. | Derby | 0.078% | 0.19%(-0.109)#89 | 0.60%(-0.521)#1,231 |
| 92. | Kansas City | 0.077% | 0.19%(-0.110)#90 | 0.60%(-0.523)#1,232 |
| 93. | Osawatomie | 0.070% | 0.19%(-0.117)#91 | 0.60%(-0.529)#1,233 |
| 94. | Haysville | 0.037% | 0.19%(-0.150)#92 | 0.60%(-0.563)#1,234 |
| 95. | Tonganoxie | 0.036% | 0.19%(-0.151)#93 | 0.60%(-0.563)#1,235 |
| 96. | Prairie Village | 0.035% | 0.19%(-0.152)#94 | 0.60%(-0.565)#1,236 |
| 97. | Pratt | 0.030% | 0.19%(-0.157)#95 | 0.60%(-0.569)#1,237 |
| 98. | Leavenworth | 0.027% | 0.19%(-0.160)#96 | 0.60%(-0.573)#1,238 |
| 99. | Mission | 0.010% | 0.19%(-0.177)#97 | 0.60%(-0.590)#1,239 |
Common Questions
What are the Top 10 Cities with the Highest Percentage of Immigrants from Philippines in Kansas?
Top 10 Cities with the Highest Percentage of Immigrants from Philippines in Kansas are:
#1
9.41%
#2
8.70%
#3
4.14%
#4
3.40%
#5
3.14%
#6
2.70%
#7
2.67%
#8
2.61%
#9
2.44%
#10
2.24%
What city has the Highest Percentage of Immigrants from Philippines in Kansas?
Englewood has the Highest Percentage of Immigrants from Philippines in Kansas with 9.41%.
What is the Percentage of Immigrants from Philippines in the State of Kansas?
Percentage of Immigrants from Philippines in Kansas is 0.19%.
What is the Percentage of Immigrants from Philippines in the United States?
Percentage of Immigrants from Philippines in the United States is 0.60%.