Cities with the Highest Percentage of Immigrants from Philippines in Pennsylvania
RELATED REPORTS & OPTIONS
Philippines
Pennsylvania
Compare Cities
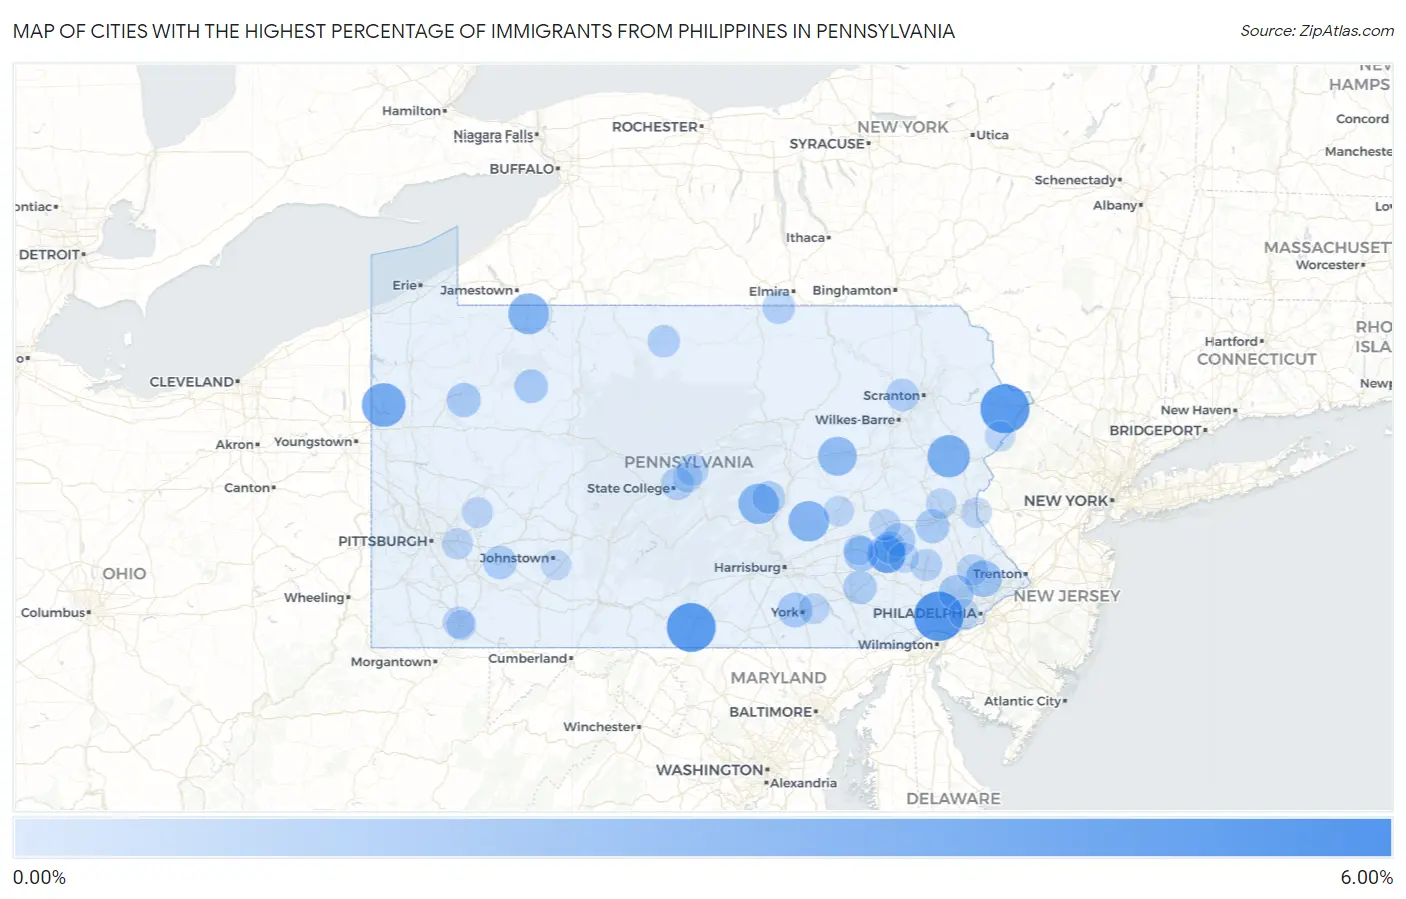
Map of Cities with the Highest Percentage of Immigrants from Philippines in Pennsylvania
0.00%
6.00%
Cities with the Highest Percentage of Immigrants from Philippines in Pennsylvania
| City | Philippines | vs State | vs National | |
| 1. | Salona | 5.05% | 0.16%(+4.89)#-1 | 0.60%(+4.45)#0 |
| 2. | Cheyney University | 4.61% | 0.16%(+4.44)#0 | 0.60%(+4.01)#1 |
| 3. | Gold Key Lake | 4.49% | 0.16%(+4.33)#1 | 0.60%(+3.89)#2 |
| 4. | Marion | 4.44% | 0.16%(+4.28)#2 | 0.60%(+3.84)#3 |
| 5. | Boswell Borough | 4.18% | 0.16%(+4.02)#3 | 0.60%(+3.58)#4 |
| 6. | Reynolds Heights | 3.34% | 0.16%(+3.18)#4 | 0.60%(+2.74)#5 |
| 7. | South Williamsport Borough | 3.07% | 0.16%(+2.91)#5 | 0.60%(+2.47)#6 |
| 8. | Sierra View | 3.07% | 0.16%(+2.91)#6 | 0.60%(+2.47)#7 |
| 9. | Southmont Borough | 2.91% | 0.16%(+2.75)#7 | 0.60%(+2.31)#8 |
| 10. | Russell | 2.76% | 0.16%(+2.60)#8 | 0.60%(+2.16)#9 |
| 11. | Stoystown Borough | 2.68% | 0.16%(+2.52)#9 | 0.60%(+2.08)#10 |
| 12. | Wiconsico | 2.68% | 0.16%(+2.52)#10 | 0.60%(+2.08)#11 |
| 13. | Richfield | 2.65% | 0.16%(+2.49)#11 | 0.60%(+2.05)#12 |
| 14. | Espy | 2.30% | 0.16%(+2.13)#12 | 0.60%(+1.70)#13 |
| 15. | Dover Borough | 2.19% | 0.16%(+2.03)#13 | 0.60%(+1.59)#195 |
| 16. | Spring Ridge | 2.12% | 0.16%(+1.95)#14 | 0.60%(+1.52)#196 |
| 17. | Prospect Park Borough | 2.03% | 0.16%(+1.87)#15 | 0.60%(+1.43)#197 |
| 18. | New Bethlehem Borough | 2.01% | 0.16%(+1.85)#16 | 0.60%(+1.41)#198 |
| 19. | Clarks Green Borough | 1.88% | 0.16%(+1.72)#17 | 0.60%(+1.28)#199 |
| 20. | Horsham | 1.82% | 0.16%(+1.66)#18 | 0.60%(+1.22)#200 |
| 21. | Colony Park | 1.82% | 0.16%(+1.66)#19 | 0.60%(+1.22)#201 |
| 22. | Hyde Park Borough | 1.60% | 0.16%(+1.43)#20 | 0.60%(+0.997)#202 |
| 23. | Lititz Borough | 1.59% | 0.16%(+1.43)#21 | 0.60%(+0.990)#203 |
| 24. | King Of Prussia | 1.54% | 0.16%(+1.38)#22 | 0.60%(+0.944)#204 |
| 25. | Newmanstown | 1.50% | 0.16%(+1.34)#23 | 0.60%(+0.902)#205 |
| 26. | Shiloh | 1.46% | 0.16%(+1.30)#24 | 0.60%(+0.862)#206 |
| 27. | Fallston Borough | 1.42% | 0.16%(+1.26)#25 | 0.60%(+0.822)#207 |
| 28. | Mount Pocono Borough | 1.32% | 0.16%(+1.16)#26 | 0.60%(+0.724)#208 |
| 29. | Seneca | 1.32% | 0.16%(+1.16)#27 | 0.60%(+0.717)#209 |
| 30. | Parkesburg Borough | 1.31% | 0.16%(+1.15)#28 | 0.60%(+0.712)#210 |
| 31. | Ancient Oaks | 1.28% | 0.16%(+1.11)#29 | 0.60%(+0.677)#231 |
| 32. | Ambler Borough | 1.24% | 0.16%(+1.08)#30 | 0.60%(+0.640)#232 |
| 33. | Marienville | 1.22% | 0.16%(+1.06)#31 | 0.60%(+0.622)#233 |
| 34. | Lawson Heights | 1.21% | 0.16%(+1.05)#32 | 0.60%(+0.611)#234 |
| 35. | Brownstown | 1.20% | 0.16%(+1.04)#33 | 0.60%(+0.601)#235 |
| 36. | Blandon | 1.19% | 0.16%(+1.03)#34 | 0.60%(+0.589)#236 |
| 37. | Aldan Borough | 1.18% | 0.16%(+1.02)#35 | 0.60%(+0.583)#237 |
| 38. | Port Clinton Borough | 1.13% | 0.16%(+0.968)#36 | 0.60%(+0.530)#238 |
| 39. | Jessup Borough | 1.11% | 0.16%(+0.947)#37 | 0.60%(+0.509)#239 |
| 40. | Houserville | 1.05% | 0.16%(+0.888)#38 | 0.60%(+0.450)#240 |
| 41. | Mount Pleasant Mills | 1.05% | 0.16%(+0.887)#39 | 0.60%(+0.449)#241 |
| 42. | Millerton | 1.04% | 0.16%(+0.874)#40 | 0.60%(+0.437)#242 |
| 43. | Upper Exeter | 1.03% | 0.16%(+0.868)#41 | 0.60%(+0.430)#243 |
| 44. | Turtle Creek Borough | 0.98% | 0.16%(+0.821)#42 | 0.60%(+0.383)#244 |
| 45. | Sweden Valley | 0.98% | 0.16%(+0.818)#43 | 0.60%(+0.381)#245 |
| 46. | Alburtis Borough | 0.97% | 0.16%(+0.811)#44 | 0.60%(+0.373)#246 |
| 47. | Knox Borough | 0.94% | 0.16%(+0.779)#45 | 0.60%(+0.341)#247 |
| 48. | East Brady Borough | 0.93% | 0.16%(+0.771)#46 | 0.60%(+0.333)#248 |
| 49. | Fox Chase | 0.92% | 0.16%(+0.759)#47 | 0.60%(+0.322)#249 |
| 50. | Dunmore Borough | 0.92% | 0.16%(+0.754)#48 | 0.60%(+0.316)#250 |
| 51. | Morea | 0.91% | 0.16%(+0.747)#49 | 0.60%(+0.309)#251 |
| 52. | New Buffalo Borough | 0.89% | 0.16%(+0.731)#50 | 0.60%(+0.293)#252 |
| 53. | Halfway House | 0.87% | 0.16%(+0.712)#51 | 0.60%(+0.275)#253 |
| 54. | Geistown Borough | 0.87% | 0.16%(+0.710)#52 | 0.60%(+0.273)#254 |
| 55. | Blossburg Borough | 0.87% | 0.16%(+0.710)#53 | 0.60%(+0.272)#255 |
| 56. | Zion | 0.84% | 0.16%(+0.674)#54 | 0.60%(+0.236)#256 |
| 57. | Trafford Borough | 0.83% | 0.16%(+0.672)#55 | 0.60%(+0.234)#257 |
| 58. | South Uniontown | 0.82% | 0.16%(+0.660)#56 | 0.60%(+0.223)#258 |
| 59. | Hallstead Borough | 0.82% | 0.16%(+0.656)#57 | 0.60%(+0.218)#259 |
| 60. | South Fork Borough | 0.81% | 0.16%(+0.648)#58 | 0.60%(+0.210)#260 |
| 61. | Oakland Cdp Cambria County | 0.78% | 0.16%(+0.618)#59 | 0.60%(+0.181)#261 |
| 62. | Bala Cynwyd | 0.78% | 0.16%(+0.614)#60 | 0.60%(+0.176)#272 |
| 63. | Pitcairn Borough | 0.75% | 0.16%(+0.584)#61 | 0.60%(+0.146)#273 |
| 64. | Muncy Borough | 0.74% | 0.16%(+0.577)#62 | 0.60%(+0.140)#274 |
| 65. | Montgomeryville | 0.74% | 0.16%(+0.576)#63 | 0.60%(+0.138)#275 |
| 66. | West Hamburg | 0.73% | 0.16%(+0.570)#64 | 0.60%(+0.132)#276 |
| 67. | Watsontown Borough | 0.73% | 0.16%(+0.563)#65 | 0.60%(+0.126)#277 |
| 68. | Bridgeport Borough | 0.72% | 0.16%(+0.558)#66 | 0.60%(+0.120)#278 |
| 69. | Wampum Borough | 0.71% | 0.16%(+0.550)#67 | 0.60%(+0.112)#279 |
| 70. | Monroeville | 0.70% | 0.16%(+0.539)#68 | 0.60%(+0.102)#280 |
| 71. | Rosemont | 0.70% | 0.16%(+0.537)#69 | 0.60%(+0.100)#281 |
| 72. | West Pittston Borough | 0.69% | 0.16%(+0.524)#70 | 0.60%(+0.086)#282 |
| 73. | East Bangor Borough | 0.64% | 0.16%(+0.481)#71 | 0.60%(+0.044)#283 |
| 74. | Hyde Park | 0.64% | 0.16%(+0.481)#72 | 0.60%(+0.043)#284 |
| 75. | Stonybrook | 0.64% | 0.16%(+0.481)#73 | 0.60%(+0.043)#285 |
| 76. | Mckees Rocks Borough | 0.63% | 0.16%(+0.466)#74 | 0.60%(+0.028)#286 |
| 77. | Lehighton Borough | 0.63% | 0.16%(+0.463)#75 | 0.60%(+0.025)#287 |
| 78. | Jenkintown Borough | 0.62% | 0.16%(+0.455)#76 | 0.60%(+0.017)#288 |
| 79. | Jacksonwald | 0.61% | 0.16%(+0.453)#77 | 0.60%(+0.015)#289 |
| 80. | Beavertown Borough | 0.60% | 0.16%(+0.435)#78 | 0.60%(-0.002)#290 |
| 81. | Raubsville | 0.59% | 0.16%(+0.431)#79 | 0.60%(-0.007)#291 |
| 82. | Brackenridge Borough | 0.59% | 0.16%(+0.429)#80 | 0.60%(-0.009)#292 |
| 83. | Cementon | 0.59% | 0.16%(+0.424)#81 | 0.60%(-0.014)#293 |
| 84. | Wellsboro Borough | 0.58% | 0.16%(+0.416)#82 | 0.60%(-0.022)#294 |
| 85. | Stouchsburg | 0.57% | 0.16%(+0.409)#83 | 0.60%(-0.028)#295 |
| 86. | Donaldson | 0.57% | 0.16%(+0.406)#84 | 0.60%(-0.032)#296 |
| 87. | Pine Ridge | 0.57% | 0.16%(+0.406)#85 | 0.60%(-0.032)#297 |
| 88. | Bear Creek Village Borough | 0.55% | 0.16%(+0.386)#86 | 0.60%(-0.052)#298 |
| 89. | Downingtown Borough | 0.54% | 0.16%(+0.382)#87 | 0.60%(-0.056)#299 |
| 90. | Red Lion Borough | 0.54% | 0.16%(+0.377)#88 | 0.60%(-0.061)#300 |
| 91. | Pleasant Gap | 0.54% | 0.16%(+0.374)#89 | 0.60%(-0.063)#301 |
| 92. | Hulmeville Borough | 0.52% | 0.16%(+0.363)#90 | 0.60%(-0.075)#302 |
| 93. | Wormleysburg Borough | 0.52% | 0.16%(+0.361)#91 | 0.60%(-0.077)#303 |
| 94. | Leith Hatfield | 0.52% | 0.16%(+0.356)#92 | 0.60%(-0.081)#304 |
| 95. | Langhorne Manor Borough | 0.51% | 0.16%(+0.350)#93 | 0.60%(-0.088)#305 |
| 96. | Belmont | 0.51% | 0.16%(+0.348)#94 | 0.60%(-0.089)#306 |
| 97. | Drexel Hill | 0.51% | 0.16%(+0.344)#95 | 0.60%(-0.093)#307 |
| 98. | Millville Borough | 0.50% | 0.16%(+0.338)#96 | 0.60%(-0.100)#308 |
| 99. | Villanova | 0.49% | 0.16%(+0.333)#97 | 0.60%(-0.105)#309 |
| 100. | Sinking Spring Borough | 0.49% | 0.16%(+0.331)#98 | 0.60%(-0.107)#310 |
Common Questions
What are the Top 10 Cities with the Highest Percentage of Immigrants from Philippines in Pennsylvania?
Top 10 Cities with the Highest Percentage of Immigrants from Philippines in Pennsylvania are:
#1
4.61%
#2
4.49%
#3
4.44%
#4
3.34%
#5
3.07%
#6
2.76%
#7
2.68%
#8
2.65%
#9
2.30%
#10
2.12%
What city has the Highest Percentage of Immigrants from Philippines in Pennsylvania?
Cheyney University has the Highest Percentage of Immigrants from Philippines in Pennsylvania with 4.61%.
What is the Percentage of Immigrants from Philippines in the State of Pennsylvania?
Percentage of Immigrants from Philippines in Pennsylvania is 0.16%.
What is the Percentage of Immigrants from Philippines in the United States?
Percentage of Immigrants from Philippines in the United States is 0.60%.