Cities with the Highest Percentage of Immigrants from Hong Kong in Pennsylvania
RELATED REPORTS & OPTIONS
Hong Kong
Pennsylvania
Compare Cities
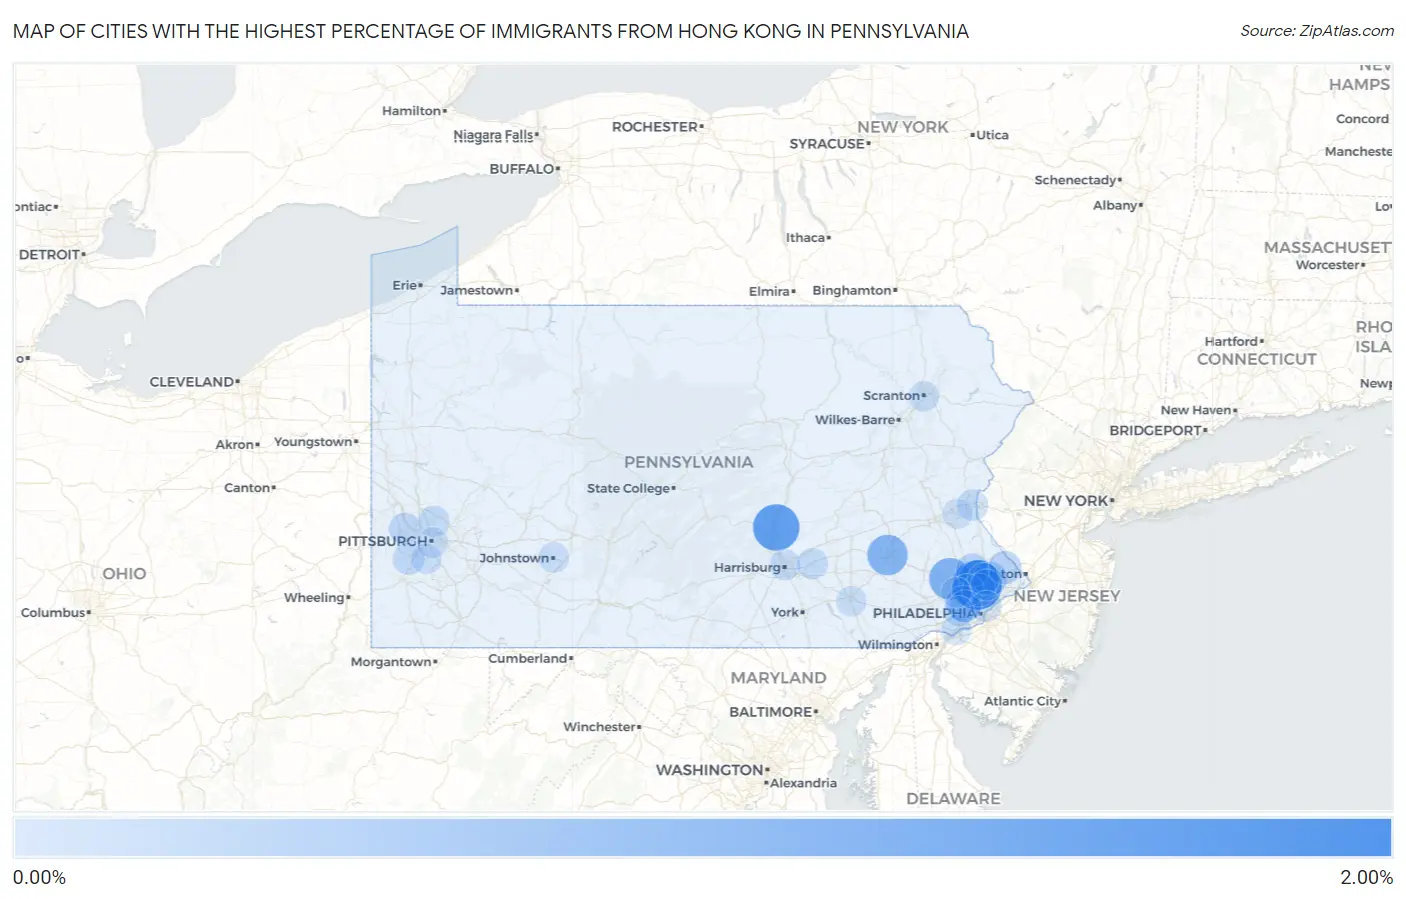
Map of Cities with the Highest Percentage of Immigrants from Hong Kong in Pennsylvania
0.00%
2.00%
Cities with the Highest Percentage of Immigrants from Hong Kong in Pennsylvania
| City | Hong Kong | vs State | vs National | |
| 1. | Fort Washington | 1.63% | 0.025%(+1.61)#1 | 0.072%(+1.56)#63 |
| 2. | Lenkerville | 1.35% | 0.025%(+1.33)#2 | 0.072%(+1.28)#83 |
| 3. | Evansburg | 0.95% | 0.025%(+0.927)#3 | 0.072%(+0.880)#147 |
| 4. | Clifton Heights Borough | 0.95% | 0.025%(+0.926)#4 | 0.072%(+0.879)#148 |
| 5. | Colony Park | 0.86% | 0.025%(+0.837)#5 | 0.072%(+0.790)#166 |
| 6. | Maple Glen | 0.83% | 0.025%(+0.804)#6 | 0.072%(+0.756)#170 |
| 7. | Telford Borough | 0.81% | 0.025%(+0.786)#7 | 0.072%(+0.739)#179 |
| 8. | Bryn Mawr | 0.49% | 0.025%(+0.465)#8 | 0.072%(+0.418)#290 |
| 9. | Bala Cynwyd | 0.41% | 0.025%(+0.385)#9 | 0.072%(+0.338)#376 |
| 10. | Villanova | 0.36% | 0.025%(+0.334)#10 | 0.072%(+0.287)#428 |
| 11. | Warminster Heights | 0.33% | 0.025%(+0.310)#11 | 0.072%(+0.262)#454 |
| 12. | Lansdowne Borough | 0.30% | 0.025%(+0.274)#12 | 0.072%(+0.226)#503 |
| 13. | Montgomeryville | 0.25% | 0.025%(+0.221)#13 | 0.072%(+0.174)#592 |
| 14. | Apollo Borough | 0.24% | 0.025%(+0.216)#14 | 0.072%(+0.168)#608 |
| 15. | Newtown Grant | 0.24% | 0.025%(+0.214)#15 | 0.072%(+0.167)#612 |
| 16. | Oreland | 0.21% | 0.025%(+0.187)#16 | 0.072%(+0.140)#685 |
| 17. | Plymouth Meeting | 0.16% | 0.025%(+0.138)#17 | 0.072%(+0.091)#826 |
| 18. | Carnot Moon | 0.15% | 0.025%(+0.125)#18 | 0.072%(+0.078)#881 |
| 19. | Ardmore | 0.15% | 0.025%(+0.124)#19 | 0.072%(+0.077)#886 |
| 20. | Cecil Bishop | 0.15% | 0.025%(+0.124)#20 | 0.072%(+0.077)#887 |
| 21. | Bellevue Borough | 0.12% | 0.025%(+0.096)#21 | 0.072%(+0.049)#1,005 |
| 22. | Horsham | 0.11% | 0.025%(+0.090)#22 | 0.072%(+0.042)#1,028 |
| 23. | Easton | 0.10% | 0.025%(+0.075)#23 | 0.072%(+0.028)#1,118 |
| 24. | Ivyland Borough | 0.091% | 0.025%(+0.066)#24 | 0.072%(+0.019)#1,162 |
| 25. | Dormont Borough | 0.085% | 0.025%(+0.060)#25 | 0.072%(+0.013)#1,202 |
| 26. | Allison Park | 0.084% | 0.025%(+0.059)#26 | 0.072%(+0.011)#1,207 |
| 27. | Hershey | 0.075% | 0.025%(+0.050)#27 | 0.072%(+0.003)#1,267 |
| 28. | Willow Grove | 0.073% | 0.025%(+0.048)#28 | 0.072%(+0.000)#1,284 |
| 29. | State College Borough | 0.071% | 0.025%(+0.046)#29 | 0.072%(-0.001)#1,294 |
| 30. | Philadelphia | 0.063% | 0.025%(+0.038)#30 | 0.072%(-0.009)#1,351 |
| 31. | Harrisburg | 0.062% | 0.025%(+0.037)#31 | 0.072%(-0.010)#1,366 |
| 32. | Johnstown | 0.038% | 0.025%(+0.013)#32 | 0.072%(-0.034)#1,580 |
| 33. | Pittsburgh | 0.038% | 0.025%(+0.013)#33 | 0.072%(-0.034)#1,584 |
| 34. | Scranton | 0.034% | 0.025%(+0.009)#34 | 0.072%(-0.038)#1,625 |
| 35. | Bethel Park | 0.027% | 0.025%(+0.002)#35 | 0.072%(-0.045)#1,719 |
| 36. | King Of Prussia | 0.025% | 0.025%(-0.000)#36 | 0.072%(-0.048)#1,757 |
| 37. | Chester | 0.021% | 0.025%(-0.004)#37 | 0.072%(-0.051)#1,797 |
| 38. | Lancaster | 0.021% | 0.025%(-0.004)#38 | 0.072%(-0.052)#1,801 |
| 39. | Broomall | 0.019% | 0.025%(-0.006)#39 | 0.072%(-0.054)#1,829 |
| 40. | Bethlehem | 0.0065% | 0.025%(-0.018)#40 | 0.072%(-0.066)#1,994 |
Common Questions
What are the Top 10 Cities with the Highest Percentage of Immigrants from Hong Kong in Pennsylvania?
Top 10 Cities with the Highest Percentage of Immigrants from Hong Kong in Pennsylvania are:
#1
1.63%
#2
1.35%
#3
0.95%
#4
0.86%
#5
0.83%
#6
0.49%
#7
0.33%
#8
0.25%
#9
0.24%
#10
0.21%
What city has the Highest Percentage of Immigrants from Hong Kong in Pennsylvania?
Fort Washington has the Highest Percentage of Immigrants from Hong Kong in Pennsylvania with 1.63%.
What is the Percentage of Immigrants from Hong Kong in the State of Pennsylvania?
Percentage of Immigrants from Hong Kong in Pennsylvania is 0.025%.
What is the Percentage of Immigrants from Hong Kong in the United States?
Percentage of Immigrants from Hong Kong in the United States is 0.072%.