Cities with the Highest Percentage of Immigrants from Africa in Ohio
RELATED REPORTS & OPTIONS
Africa
Ohio
Compare Cities
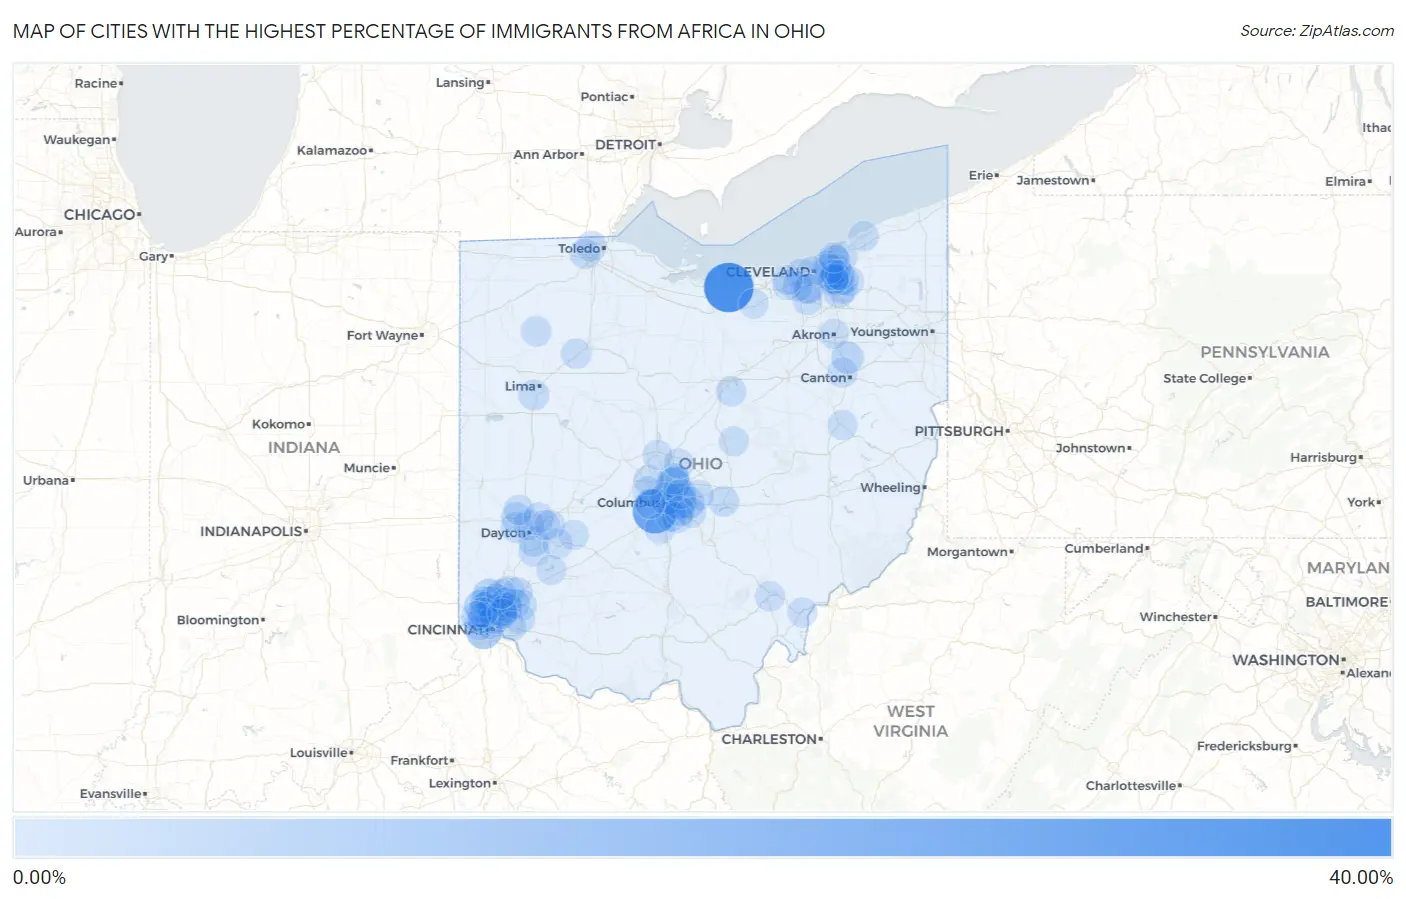
Map of Cities with the Highest Percentage of Immigrants from Africa in Ohio
0.00%
40.00%
Cities with the Highest Percentage of Immigrants from Africa in Ohio
| City | Africa | vs State | vs National | |
| 1. | Beulah Beach | 35.82% | 0.83%(+35.0)#-1 | 0.78%(+35.0)#0 |
| 2. | Urbancrest | 26.36% | 0.83%(+25.5)#0 | 0.78%(+25.6)#1 |
| 3. | Delshire | 10.52% | 0.83%(+9.69)#1 | 0.78%(+9.74)#2 |
| 4. | Whitehall | 9.96% | 0.83%(+9.14)#2 | 0.78%(+9.18)#3 |
| 5. | Springdale | 6.69% | 0.83%(+5.86)#3 | 0.78%(+5.91)#4 |
| 6. | Minerva Park | 6.60% | 0.83%(+5.77)#4 | 0.78%(+5.82)#5 |
| 7. | Columbus | 5.16% | 0.83%(+4.33)#16 | 0.78%(+4.38)#477 |
| 8. | Lockland | 5.09% | 0.83%(+4.26)#17 | 0.78%(+4.31)#478 |
| 9. | Fairfield | 4.53% | 0.83%(+3.70)#18 | 0.78%(+3.75)#479 |
| 10. | Greentown | 4.46% | 0.83%(+3.64)#19 | 0.78%(+3.68)#480 |
| 11. | Forest Park | 4.25% | 0.83%(+3.43)#20 | 0.78%(+3.47)#481 |
| 12. | Dry Ridge | 4.13% | 0.83%(+3.30)#21 | 0.78%(+3.35)#482 |
| 13. | Huber Ridge | 3.97% | 0.83%(+3.15)#22 | 0.78%(+3.20)#483 |
| 14. | Reynoldsburg | 3.68% | 0.83%(+2.86)#23 | 0.78%(+2.91)#484 |
| 15. | Richmond Heights | 3.37% | 0.83%(+2.54)#24 | 0.78%(+2.59)#485 |
| 16. | Orange | 2.91% | 0.83%(+2.09)#25 | 0.78%(+2.13)#486 |
| 17. | Bass Lake | 2.78% | 0.83%(+1.95)#26 | 0.78%(+2.00)#487 |
| 18. | Loveland | 2.63% | 0.83%(+1.81)#27 | 0.78%(+1.86)#488 |
| 19. | East Cleveland | 2.58% | 0.83%(+1.75)#28 | 0.78%(+1.80)#489 |
| 20. | Groveport | 2.43% | 0.83%(+1.60)#29 | 0.78%(+1.65)#490 |
| 21. | Glenwillow | 2.36% | 0.83%(+1.53)#30 | 0.78%(+1.58)#491 |
| 22. | Westerville | 2.31% | 0.83%(+1.48)#31 | 0.78%(+1.53)#492 |
| 23. | Northbrook | 2.27% | 0.83%(+1.44)#32 | 0.78%(+1.49)#493 |
| 24. | Wetherington | 2.26% | 0.83%(+1.44)#33 | 0.78%(+1.48)#494 |
| 25. | North Randall | 2.25% | 0.83%(+1.42)#34 | 0.78%(+1.47)#495 |
| 26. | Cincinnati | 2.18% | 0.83%(+1.35)#35 | 0.78%(+1.40)#496 |
| 27. | Pleasant Hills | 2.07% | 0.83%(+1.24)#36 | 0.78%(+1.29)#497 |
| 28. | Hebron | 1.93% | 0.83%(+1.10)#37 | 0.78%(+1.15)#498 |
| 29. | Trotwood | 1.92% | 0.83%(+1.09)#38 | 0.78%(+1.14)#499 |
| 30. | Covedale | 1.79% | 0.83%(+0.963)#39 | 0.78%(+1.01)#500 |
| 31. | Obetz | 1.63% | 0.83%(+0.804)#40 | 0.78%(+0.852)#501 |
| 32. | Fort Shawnee | 1.57% | 0.83%(+0.741)#41 | 0.78%(+0.788)#502 |
| 33. | Kettering | 1.51% | 0.83%(+0.683)#42 | 0.78%(+0.730)#503 |
| 34. | St Bernard | 1.49% | 0.83%(+0.664)#43 | 0.78%(+0.711)#504 |
| 35. | Dublin | 1.43% | 0.83%(+0.605)#44 | 0.78%(+0.652)#505 |
| 36. | Centerville | 1.43% | 0.83%(+0.601)#45 | 0.78%(+0.649)#506 |
| 37. | Miller City | 1.39% | 0.83%(+0.562)#46 | 0.78%(+0.610)#507 |
| 38. | Solon | 1.38% | 0.83%(+0.549)#47 | 0.78%(+0.597)#508 |
| 39. | Monfort Heights | 1.37% | 0.83%(+0.539)#48 | 0.78%(+0.586)#509 |
| 40. | Dayton | 1.32% | 0.83%(+0.498)#49 | 0.78%(+0.546)#510 |
| 41. | Sharonville | 1.31% | 0.83%(+0.485)#50 | 0.78%(+0.533)#511 |
| 42. | Chagrin Falls | 1.31% | 0.83%(+0.485)#51 | 0.78%(+0.533)#512 |
| 43. | Warrensville Heights | 1.28% | 0.83%(+0.455)#52 | 0.78%(+0.502)#513 |
| 44. | Pleasant Run | 1.27% | 0.83%(+0.448)#53 | 0.78%(+0.495)#514 |
| 45. | Lucas | 1.27% | 0.83%(+0.442)#54 | 0.78%(+0.489)#515 |
| 46. | Willoughby Hills | 1.25% | 0.83%(+0.427)#55 | 0.78%(+0.474)#516 |
| 47. | Commercial Point | 1.25% | 0.83%(+0.426)#56 | 0.78%(+0.474)#517 |
| 48. | Moreland Hills | 1.22% | 0.83%(+0.394)#57 | 0.78%(+0.442)#518 |
| 49. | Ottawa Hills | 1.21% | 0.83%(+0.386)#58 | 0.78%(+0.434)#519 |
| 50. | Lakewood | 1.21% | 0.83%(+0.383)#59 | 0.78%(+0.430)#520 |
| 51. | Gahanna | 1.21% | 0.83%(+0.381)#60 | 0.78%(+0.428)#521 |
| 52. | Galena | 1.16% | 0.83%(+0.335)#61 | 0.78%(+0.383)#522 |
| 53. | Pataskala | 1.15% | 0.83%(+0.328)#62 | 0.78%(+0.375)#523 |
| 54. | Lyndhurst | 1.15% | 0.83%(+0.327)#63 | 0.78%(+0.375)#524 |
| 55. | Reading | 1.15% | 0.83%(+0.323)#64 | 0.78%(+0.370)#525 |
| 56. | Shaker Heights | 1.13% | 0.83%(+0.302)#65 | 0.78%(+0.349)#526 |
| 57. | Holland | 1.09% | 0.83%(+0.262)#66 | 0.78%(+0.310)#527 |
| 58. | Englewood | 1.09% | 0.83%(+0.260)#67 | 0.78%(+0.308)#528 |
| 59. | Mason | 1.07% | 0.83%(+0.246)#68 | 0.78%(+0.294)#529 |
| 60. | Parma Heights | 1.07% | 0.83%(+0.241)#69 | 0.78%(+0.288)#530 |
| 61. | Beachwood | 1.04% | 0.83%(+0.213)#70 | 0.78%(+0.261)#531 |
| 62. | Lincoln Village | 1.02% | 0.83%(+0.189)#71 | 0.78%(+0.236)#532 |
| 63. | Milford | 1.01% | 0.83%(+0.180)#72 | 0.78%(+0.227)#533 |
| 64. | Cleveland Heights | 0.98% | 0.83%(+0.153)#73 | 0.78%(+0.201)#534 |
| 65. | North Royalton | 0.97% | 0.83%(+0.147)#74 | 0.78%(+0.194)#535 |
| 66. | Pickerington | 0.96% | 0.83%(+0.129)#75 | 0.78%(+0.176)#536 |
| 67. | Rawson | 0.96% | 0.83%(+0.129)#76 | 0.78%(+0.176)#537 |
| 68. | Painesville | 0.92% | 0.83%(+0.095)#77 | 0.78%(+0.143)#538 |
| 69. | Union | 0.91% | 0.83%(+0.087)#78 | 0.78%(+0.135)#539 |
| 70. | Hilliard | 0.87% | 0.83%(+0.040)#79 | 0.78%(+0.088)#540 |
| 71. | Huber Heights | 0.83% | 0.83%(+0.006)#80 | 0.78%(+0.054)#541 |
| 72. | Blacklick Estates | 0.82% | 0.83%(-0.005)#81 | 0.78%(+0.042)#542 |
| 73. | Brook Park | 0.82% | 0.83%(-0.005)#82 | 0.78%(+0.042)#543 |
| 74. | Blue Ash | 0.82% | 0.83%(-0.009)#83 | 0.78%(+0.039)#544 |
| 75. | Coolville | 0.81% | 0.83%(-0.014)#84 | 0.78%(+0.034)#545 |
| 76. | North Olmsted | 0.81% | 0.83%(-0.014)#85 | 0.78%(+0.033)#546 |
| 77. | White Oak | 0.81% | 0.83%(-0.015)#86 | 0.78%(+0.032)#547 |
| 78. | Athens | 0.81% | 0.83%(-0.016)#87 | 0.78%(+0.031)#548 |
| 79. | Akron | 0.81% | 0.83%(-0.016)#88 | 0.78%(+0.031)#549 |
| 80. | Gambier | 0.80% | 0.83%(-0.027)#89 | 0.78%(+0.021)#550 |
| 81. | Fairborn | 0.80% | 0.83%(-0.029)#90 | 0.78%(+0.018)#551 |
| 82. | Hills And Dales | 0.79% | 0.83%(-0.039)#91 | 0.78%(+0.008)#552 |
| 83. | Xenia | 0.76% | 0.83%(-0.066)#92 | 0.78%(-0.018)#553 |
| 84. | Cedarville | 0.74% | 0.83%(-0.086)#93 | 0.78%(-0.039)#554 |
| 85. | Highland Hills | 0.72% | 0.83%(-0.111)#94 | 0.78%(-0.064)#555 |
| 86. | Cleveland | 0.71% | 0.83%(-0.118)#95 | 0.78%(-0.071)#565 |
| 87. | Wright Patterson Afb | 0.71% | 0.83%(-0.119)#96 | 0.78%(-0.071)#566 |
| 88. | Sixteen Mile Stand | 0.71% | 0.83%(-0.120)#97 | 0.78%(-0.072)#567 |
| 89. | Newtown | 0.71% | 0.83%(-0.121)#98 | 0.78%(-0.073)#568 |
| 90. | Delaware | 0.71% | 0.83%(-0.121)#99 | 0.78%(-0.073)#569 |
| 91. | Pepper Pike | 0.69% | 0.83%(-0.133)#100 | 0.78%(-0.086)#570 |
| 92. | Amberley | 0.68% | 0.83%(-0.147)#101 | 0.78%(-0.099)#571 |
| 93. | Parma | 0.65% | 0.83%(-0.178)#102 | 0.78%(-0.130)#572 |
| 94. | Harveysburg | 0.64% | 0.83%(-0.183)#103 | 0.78%(-0.136)#573 |
| 95. | New Philadelphia | 0.64% | 0.83%(-0.185)#104 | 0.78%(-0.137)#574 |
| 96. | Westlake | 0.64% | 0.83%(-0.186)#105 | 0.78%(-0.139)#575 |
| 97. | Euclid | 0.62% | 0.83%(-0.204)#106 | 0.78%(-0.156)#576 |
| 98. | Oberlin | 0.62% | 0.83%(-0.204)#107 | 0.78%(-0.157)#577 |
| 99. | Dent | 0.61% | 0.83%(-0.218)#108 | 0.78%(-0.171)#578 |
| 100. | Beckett Ridge | 0.60% | 0.83%(-0.229)#109 | 0.78%(-0.182)#579 |
Common Questions
What are the Top 10 Cities with the Highest Percentage of Immigrants from Africa in Ohio?
Top 10 Cities with the Highest Percentage of Immigrants from Africa in Ohio are:
#1
35.82%
#2
26.36%
#3
10.52%
#4
9.96%
#5
6.69%
#6
6.60%
#7
5.16%
#8
5.09%
#9
4.53%
#10
4.46%
What city has the Highest Percentage of Immigrants from Africa in Ohio?
Beulah Beach has the Highest Percentage of Immigrants from Africa in Ohio with 35.82%.
What is the Percentage of Immigrants from Africa in the State of Ohio?
Percentage of Immigrants from Africa in Ohio is 0.83%.
What is the Percentage of Immigrants from Africa in the United States?
Percentage of Immigrants from Africa in the United States is 0.78%.