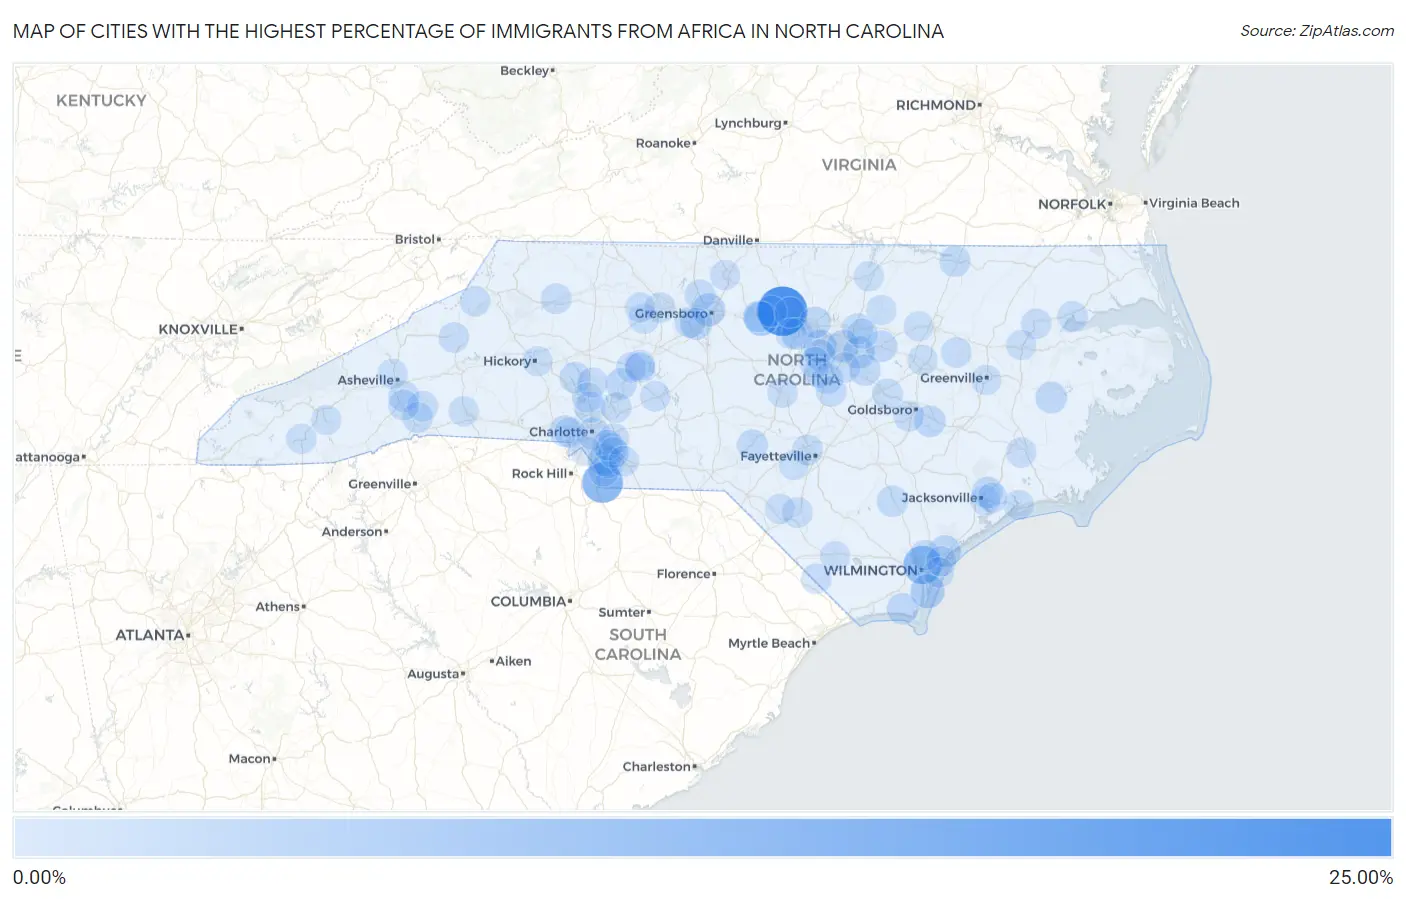
Cities with the Highest Percentage of Immigrants from Africa in North Carolina
RELATED REPORTS & OPTIONS
Africa
North Carolina
Compare Cities
Map of Cities with the Highest Percentage of Immigrants from Africa in North Carolina
0.00%
25.00%
Cities with the Highest Percentage of Immigrants from Africa in North Carolina
| City | Africa | vs State | vs National | |
| 1. | Efland | 20.12% | 0.68%(+19.4)#-1 | 0.78%(+19.3)#0 |
| 2. | Jaars | 10.82% | 0.68%(+10.1)#0 | 0.78%(+10.0)#1 |
| 3. | Hightsville | 8.40% | 0.68%(+7.72)#1 | 0.78%(+7.62)#2 |
| 4. | Swepsonville | 4.30% | 0.68%(+3.62)#2 | 0.78%(+3.52)#3 |
| 5. | Sea Breeze | 4.17% | 0.68%(+3.49)#3 | 0.78%(+3.40)#4 |
| 6. | Greensboro | 3.14% | 0.68%(+2.46)#7 | 0.78%(+2.36)#432 |
| 7. | Morrisville | 2.93% | 0.68%(+2.25)#8 | 0.78%(+2.15)#433 |
| 8. | Raleigh | 2.35% | 0.68%(+1.67)#9 | 0.78%(+1.57)#465 |
| 9. | Hampstead | 2.19% | 0.68%(+1.51)#10 | 0.78%(+1.41)#466 |
| 10. | Jamestown | 2.18% | 0.68%(+1.49)#11 | 0.78%(+1.40)#467 |
| 11. | Charlotte | 2.05% | 0.68%(+1.36)#12 | 0.78%(+1.27)#468 |
| 12. | Knightdale | 1.99% | 0.68%(+1.31)#13 | 0.78%(+1.21)#469 |
| 13. | Weddington | 1.93% | 0.68%(+1.25)#14 | 0.78%(+1.15)#470 |
| 14. | Chapel Hill | 1.78% | 0.68%(+1.10)#15 | 0.78%(+1.00)#471 |
| 15. | Bath | 1.69% | 0.68%(+1.01)#16 | 0.78%(+0.916)#472 |
| 16. | Cramerton | 1.68% | 0.68%(+0.999)#17 | 0.78%(+0.902)#473 |
| 17. | Zebulon | 1.67% | 0.68%(+0.989)#18 | 0.78%(+0.892)#474 |
| 18. | Durham | 1.66% | 0.68%(+0.982)#19 | 0.78%(+0.885)#475 |
| 19. | St James | 1.66% | 0.68%(+0.978)#20 | 0.78%(+0.881)#476 |
| 20. | China Grove | 1.57% | 0.68%(+0.891)#21 | 0.78%(+0.794)#477 |
| 21. | Walnut Creek | 1.53% | 0.68%(+0.847)#22 | 0.78%(+0.749)#478 |
| 22. | Graham | 1.49% | 0.68%(+0.812)#23 | 0.78%(+0.715)#479 |
| 23. | Clayton | 1.46% | 0.68%(+0.782)#24 | 0.78%(+0.685)#480 |
| 24. | Harrells | 1.44% | 0.68%(+0.753)#25 | 0.78%(+0.656)#481 |
| 25. | Pumpkin Center | 1.35% | 0.68%(+0.666)#26 | 0.78%(+0.569)#482 |
| 26. | Roanoke Rapids | 1.34% | 0.68%(+0.658)#27 | 0.78%(+0.561)#483 |
| 27. | Mebane | 1.30% | 0.68%(+0.620)#28 | 0.78%(+0.522)#484 |
| 28. | Lake Norman Of Catawba | 1.29% | 0.68%(+0.603)#29 | 0.78%(+0.506)#485 |
| 29. | Wesley Chapel | 1.28% | 0.68%(+0.596)#30 | 0.78%(+0.499)#486 |
| 30. | Aberdeen | 1.23% | 0.68%(+0.551)#31 | 0.78%(+0.454)#487 |
| 31. | Cary | 1.20% | 0.68%(+0.518)#32 | 0.78%(+0.421)#488 |
| 32. | Stallings | 1.20% | 0.68%(+0.516)#33 | 0.78%(+0.419)#489 |
| 33. | Carrboro | 1.16% | 0.68%(+0.481)#34 | 0.78%(+0.384)#490 |
| 34. | High Point | 1.13% | 0.68%(+0.453)#35 | 0.78%(+0.355)#491 |
| 35. | Wake Forest | 1.07% | 0.68%(+0.386)#36 | 0.78%(+0.288)#492 |
| 36. | Summerfield | 1.05% | 0.68%(+0.365)#37 | 0.78%(+0.268)#493 |
| 37. | Apex | 1.01% | 0.68%(+0.329)#38 | 0.78%(+0.232)#494 |
| 38. | Royal Pines | 0.98% | 0.68%(+0.301)#39 | 0.78%(+0.203)#495 |
| 39. | Huntersville | 0.96% | 0.68%(+0.282)#40 | 0.78%(+0.185)#496 |
| 40. | Fuquay Varina | 0.94% | 0.68%(+0.258)#41 | 0.78%(+0.161)#497 |
| 41. | Dana | 0.88% | 0.68%(+0.200)#42 | 0.78%(+0.103)#498 |
| 42. | Fayetteville | 0.87% | 0.68%(+0.188)#43 | 0.78%(+0.090)#499 |
| 43. | North Wilkesboro | 0.83% | 0.68%(+0.146)#44 | 0.78%(+0.048)#500 |
| 44. | Waxhaw | 0.83% | 0.68%(+0.145)#45 | 0.78%(+0.048)#501 |
| 45. | Edneyville | 0.81% | 0.68%(+0.131)#46 | 0.78%(+0.034)#502 |
| 46. | Fletcher | 0.81% | 0.68%(+0.130)#47 | 0.78%(+0.033)#503 |
| 47. | Misenheimer | 0.77% | 0.68%(+0.085)#48 | 0.78%(-0.012)#504 |
| 48. | Mint Hill | 0.76% | 0.68%(+0.083)#49 | 0.78%(-0.014)#505 |
| 49. | Spruce Pine | 0.76% | 0.68%(+0.076)#50 | 0.78%(-0.021)#506 |
| 50. | Edenton | 0.75% | 0.68%(+0.071)#51 | 0.78%(-0.026)#507 |
| 51. | Holly Springs | 0.75% | 0.68%(+0.070)#52 | 0.78%(-0.027)#508 |
| 52. | Belmont | 0.73% | 0.68%(+0.046)#53 | 0.78%(-0.052)#509 |
| 53. | Hillsborough | 0.72% | 0.68%(+0.042)#54 | 0.78%(-0.056)#510 |
| 54. | Matthews | 0.71% | 0.68%(+0.024)#55 | 0.78%(-0.074)#511 |
| 55. | Winston Salem | 0.70% | 0.68%(+0.018)#56 | 0.78%(-0.079)#523 |
| 56. | Rolesville | 0.67% | 0.68%(-0.012)#57 | 0.78%(-0.109)#524 |
| 57. | Concord | 0.65% | 0.68%(-0.036)#58 | 0.78%(-0.133)#525 |
| 58. | Indian Trail | 0.64% | 0.68%(-0.040)#59 | 0.78%(-0.137)#526 |
| 59. | Lumberton | 0.63% | 0.68%(-0.054)#60 | 0.78%(-0.151)#527 |
| 60. | Monroe | 0.62% | 0.68%(-0.066)#61 | 0.78%(-0.163)#528 |
| 61. | Pine Level | 0.61% | 0.68%(-0.068)#62 | 0.78%(-0.165)#529 |
| 62. | Mar Mac | 0.60% | 0.68%(-0.078)#63 | 0.78%(-0.176)#530 |
| 63. | Angier | 0.60% | 0.68%(-0.084)#64 | 0.78%(-0.181)#531 |
| 64. | Skippers Corner | 0.58% | 0.68%(-0.099)#65 | 0.78%(-0.196)#532 |
| 65. | Pinetops | 0.58% | 0.68%(-0.100)#66 | 0.78%(-0.197)#533 |
| 66. | Banner Elk | 0.57% | 0.68%(-0.115)#67 | 0.78%(-0.212)#534 |
| 67. | Spencer | 0.52% | 0.68%(-0.166)#68 | 0.78%(-0.264)#535 |
| 68. | Windsor | 0.52% | 0.68%(-0.167)#69 | 0.78%(-0.264)#536 |
| 69. | Tabor City | 0.51% | 0.68%(-0.170)#70 | 0.78%(-0.267)#537 |
| 70. | Sanford | 0.51% | 0.68%(-0.172)#71 | 0.78%(-0.269)#538 |
| 71. | Anderson Creek | 0.48% | 0.68%(-0.205)#72 | 0.78%(-0.302)#539 |
| 72. | Wilson | 0.48% | 0.68%(-0.205)#73 | 0.78%(-0.302)#540 |
| 73. | Franklin | 0.45% | 0.68%(-0.228)#74 | 0.78%(-0.325)#541 |
| 74. | Garner | 0.45% | 0.68%(-0.237)#75 | 0.78%(-0.334)#542 |
| 75. | Mooresville | 0.44% | 0.68%(-0.238)#76 | 0.78%(-0.336)#543 |
| 76. | Rockfish | 0.42% | 0.68%(-0.262)#77 | 0.78%(-0.359)#544 |
| 77. | Salisbury | 0.40% | 0.68%(-0.279)#78 | 0.78%(-0.376)#545 |
| 78. | Clemmons | 0.40% | 0.68%(-0.283)#79 | 0.78%(-0.380)#546 |
| 79. | New Bern | 0.40% | 0.68%(-0.284)#80 | 0.78%(-0.381)#547 |
| 80. | Henderson | 0.39% | 0.68%(-0.289)#81 | 0.78%(-0.386)#548 |
| 81. | Wrightsville Beach | 0.39% | 0.68%(-0.296)#82 | 0.78%(-0.393)#549 |
| 82. | Greenville | 0.39% | 0.68%(-0.296)#83 | 0.78%(-0.394)#550 |
| 83. | Rutherfordton | 0.38% | 0.68%(-0.301)#84 | 0.78%(-0.398)#551 |
| 84. | Whiteville | 0.38% | 0.68%(-0.304)#85 | 0.78%(-0.401)#552 |
| 85. | Reidsville | 0.36% | 0.68%(-0.324)#86 | 0.78%(-0.421)#553 |
| 86. | Cornelius | 0.36% | 0.68%(-0.325)#87 | 0.78%(-0.423)#554 |
| 87. | Williamston | 0.34% | 0.68%(-0.338)#88 | 0.78%(-0.435)#555 |
| 88. | Nashville | 0.34% | 0.68%(-0.344)#89 | 0.78%(-0.441)#556 |
| 89. | Jacksonville | 0.33% | 0.68%(-0.350)#90 | 0.78%(-0.447)#557 |
| 90. | East Spencer | 0.33% | 0.68%(-0.353)#91 | 0.78%(-0.450)#558 |
| 91. | Louisburg | 0.32% | 0.68%(-0.359)#92 | 0.78%(-0.457)#559 |
| 92. | Porters Neck | 0.32% | 0.68%(-0.361)#93 | 0.78%(-0.458)#560 |
| 93. | Cedar Point | 0.32% | 0.68%(-0.364)#94 | 0.78%(-0.461)#561 |
| 94. | Pembroke | 0.32% | 0.68%(-0.364)#95 | 0.78%(-0.461)#562 |
| 95. | Pineville | 0.31% | 0.68%(-0.369)#96 | 0.78%(-0.466)#563 |
| 96. | Lewisville | 0.30% | 0.68%(-0.386)#97 | 0.78%(-0.483)#564 |
| 97. | Hickory | 0.29% | 0.68%(-0.389)#98 | 0.78%(-0.486)#565 |
| 98. | Piney Green | 0.29% | 0.68%(-0.391)#99 | 0.78%(-0.488)#566 |
| 99. | Cullowhee | 0.28% | 0.68%(-0.399)#100 | 0.78%(-0.496)#567 |
| 100. | Woodfin | 0.28% | 0.68%(-0.404)#101 | 0.78%(-0.501)#568 |
Common Questions
What are the Top 10 Cities with the Highest Percentage of Immigrants from Africa in North Carolina?
Top 10 Cities with the Highest Percentage of Immigrants from Africa in North Carolina are:
#1
20.12%
#2
10.82%
#3
8.40%
#4
4.30%
#5
4.17%
#6
3.14%
#7
2.93%
#8
2.35%
#9
2.19%
#10
2.18%
What city has the Highest Percentage of Immigrants from Africa in North Carolina?
Efland has the Highest Percentage of Immigrants from Africa in North Carolina with 20.12%.
What is the Percentage of Immigrants from Africa in the State of North Carolina?
Percentage of Immigrants from Africa in North Carolina is 0.68%.
What is the Percentage of Immigrants from Africa in the United States?
Percentage of Immigrants from Africa in the United States is 0.78%.