Cities with the Highest Percentage of Immigrants from Africa in Pennsylvania
RELATED REPORTS & OPTIONS
Africa
Pennsylvania
Compare Cities
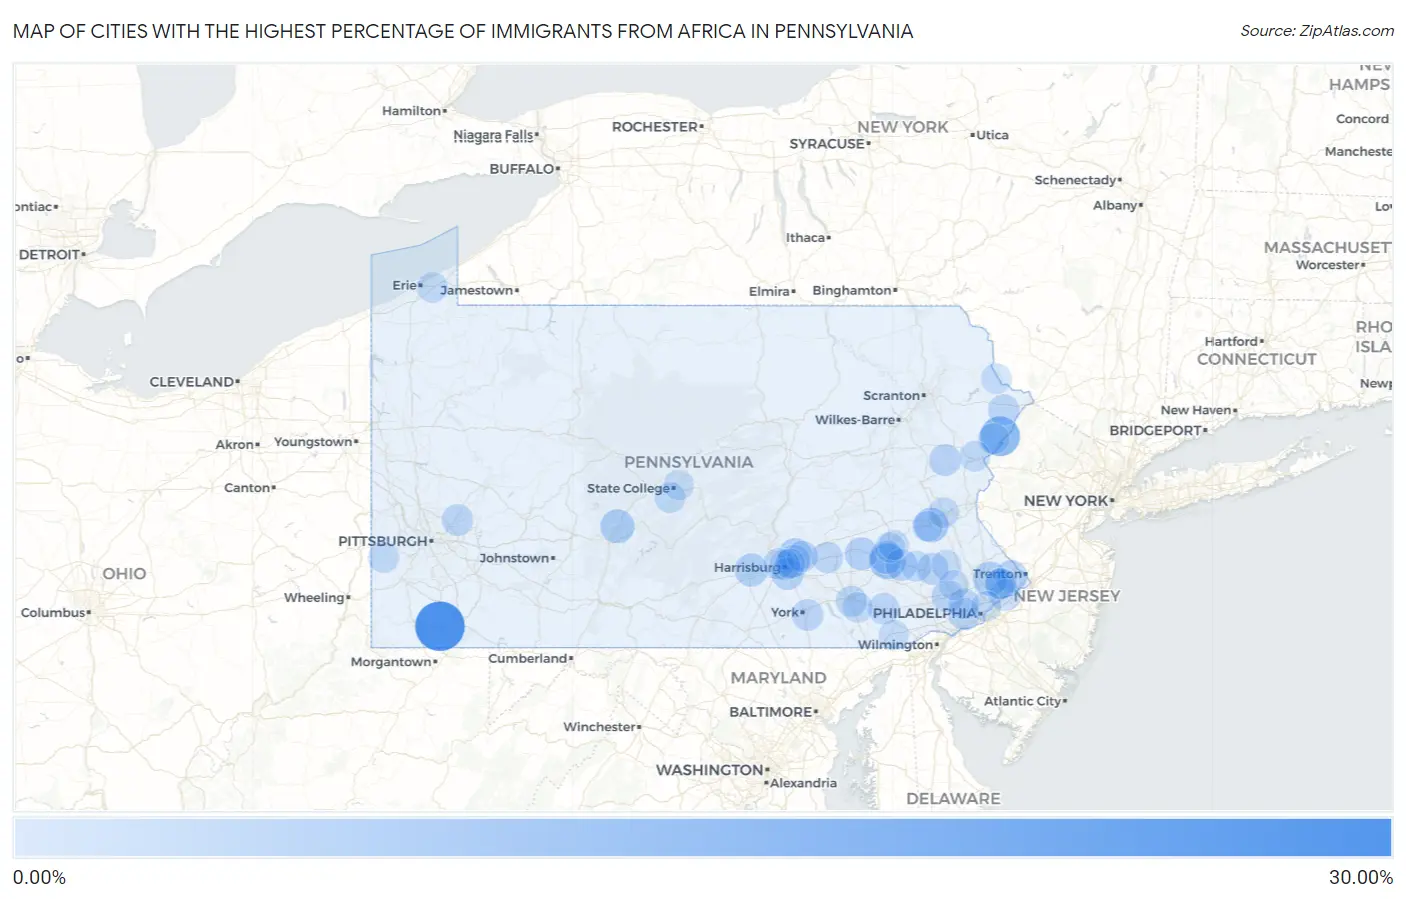
Map of Cities with the Highest Percentage of Immigrants from Africa in Pennsylvania
0.00%
30.00%
Cities with the Highest Percentage of Immigrants from Africa in Pennsylvania
| City | Africa | vs State | vs National | |
| 1. | Ronco | 25.64% | 0.67%(+25.0)#-1 | 0.78%(+24.9)#0 |
| 2. | Colwyn Borough | 24.22% | 0.67%(+23.5)#0 | 0.78%(+23.4)#1 |
| 3. | Darby Borough | 13.98% | 0.67%(+13.3)#1 | 0.78%(+13.2)#2 |
| 4. | Millbourne Borough | 13.40% | 0.67%(+12.7)#2 | 0.78%(+12.6)#3 |
| 5. | Pine Ridge | 13.06% | 0.67%(+12.4)#3 | 0.78%(+12.3)#4 |
| 6. | Sharon Hill Borough | 9.64% | 0.67%(+8.97)#4 | 0.78%(+8.86)#5 |
| 7. | South Coatesville Borough | 8.34% | 0.67%(+7.67)#5 | 0.78%(+7.56)#6 |
| 8. | Montrose Manor | 8.31% | 0.67%(+7.64)#6 | 0.78%(+7.53)#7 |
| 9. | East Lansdowne Borough | 7.88% | 0.67%(+7.21)#7 | 0.78%(+7.10)#8 |
| 10. | Folcroft Borough | 7.68% | 0.67%(+7.01)#8 | 0.78%(+6.90)#9 |
| 11. | Yeadon Borough | 7.56% | 0.67%(+6.89)#9 | 0.78%(+6.79)#10 |
| 12. | Wall Borough | 7.41% | 0.67%(+6.74)#10 | 0.78%(+6.64)#11 |
| 13. | Lansdowne Borough | 6.86% | 0.67%(+6.19)#11 | 0.78%(+6.08)#12 |
| 14. | Schwenksville Borough | 6.81% | 0.67%(+6.14)#12 | 0.78%(+6.03)#13 |
| 15. | Trexlertown | 6.74% | 0.67%(+6.07)#13 | 0.78%(+5.96)#14 |
| 16. | Bridgeport Borough | 6.58% | 0.67%(+5.91)#14 | 0.78%(+5.80)#15 |
| 17. | Warminster Heights | 5.95% | 0.67%(+5.28)#15 | 0.78%(+5.17)#16 |
| 18. | Greenwood | 5.81% | 0.67%(+5.14)#16 | 0.78%(+5.03)#17 |
| 19. | Aldan Borough | 5.66% | 0.67%(+4.98)#17 | 0.78%(+4.88)#18 |
| 20. | Linglestown | 5.28% | 0.67%(+4.60)#18 | 0.78%(+4.50)#26 |
| 21. | West Lawn | 4.93% | 0.67%(+4.26)#19 | 0.78%(+4.15)#27 |
| 22. | Schlusser | 4.75% | 0.67%(+4.08)#20 | 0.78%(+3.97)#28 |
| 23. | Newmanstown | 4.40% | 0.67%(+3.73)#21 | 0.78%(+3.62)#29 |
| 24. | Colonial Park | 3.96% | 0.67%(+3.29)#22 | 0.78%(+3.18)#30 |
| 25. | Collingdale Borough | 3.94% | 0.67%(+3.26)#23 | 0.78%(+3.16)#31 |
| 26. | Woodbourne | 3.85% | 0.67%(+3.18)#24 | 0.78%(+3.07)#32 |
| 27. | Brentwood Borough | 3.85% | 0.67%(+3.17)#25 | 0.78%(+3.07)#33 |
| 28. | New Market | 3.68% | 0.67%(+3.01)#26 | 0.78%(+2.90)#34 |
| 29. | Shiremanstown Borough | 3.60% | 0.67%(+2.93)#27 | 0.78%(+2.82)#35 |
| 30. | Clifton Heights Borough | 3.48% | 0.67%(+2.81)#28 | 0.78%(+2.70)#36 |
| 31. | Sanatoga | 3.45% | 0.67%(+2.78)#29 | 0.78%(+2.68)#37 |
| 32. | Glendon Borough | 3.39% | 0.67%(+2.71)#30 | 0.78%(+2.61)#38 |
| 33. | Sun Valley | 3.26% | 0.67%(+2.59)#31 | 0.78%(+2.48)#39 |
| 34. | Gibraltar | 3.24% | 0.67%(+2.57)#32 | 0.78%(+2.46)#40 |
| 35. | Penbrook Borough | 3.23% | 0.67%(+2.55)#33 | 0.78%(+2.45)#41 |
| 36. | Dover Borough | 3.21% | 0.67%(+2.54)#34 | 0.78%(+2.43)#42 |
| 37. | Chesterbrook | 3.21% | 0.67%(+2.53)#35 | 0.78%(+2.43)#43 |
| 38. | Chalfont Borough | 3.03% | 0.67%(+2.36)#36 | 0.78%(+2.25)#44 |
| 39. | Queens Gate | 2.94% | 0.67%(+2.27)#37 | 0.78%(+2.17)#45 |
| 40. | Drexel Hill | 2.88% | 0.67%(+2.21)#38 | 0.78%(+2.10)#46 |
| 41. | Royalton Borough | 2.86% | 0.67%(+2.19)#39 | 0.78%(+2.08)#47 |
| 42. | Cornwells Heights | 2.84% | 0.67%(+2.17)#40 | 0.78%(+2.06)#48 |
| 43. | Eddystone Borough | 2.81% | 0.67%(+2.14)#41 | 0.78%(+2.03)#49 |
| 44. | Arnold | 2.80% | 0.67%(+2.13)#42 | 0.78%(+2.03)#50 |
| 45. | Trevose | 2.78% | 0.67%(+2.11)#43 | 0.78%(+2.00)#51 |
| 46. | Gap | 2.75% | 0.67%(+2.08)#44 | 0.78%(+1.97)#52 |
| 47. | Sunrise Lake | 2.64% | 0.67%(+1.96)#45 | 0.78%(+1.86)#53 |
| 48. | Saw Creek | 2.63% | 0.67%(+1.96)#46 | 0.78%(+1.85)#54 |
| 49. | Mount Gretna Borough | 2.54% | 0.67%(+1.87)#47 | 0.78%(+1.76)#55 |
| 50. | Annville | 2.53% | 0.67%(+1.85)#48 | 0.78%(+1.75)#56 |
| 51. | Crafton Borough | 2.51% | 0.67%(+1.84)#49 | 0.78%(+1.74)#57 |
| 52. | Enola | 2.49% | 0.67%(+1.82)#50 | 0.78%(+1.71)#58 |
| 53. | Trainer Borough | 2.44% | 0.67%(+1.77)#51 | 0.78%(+1.66)#59 |
| 54. | Skyline View | 2.39% | 0.67%(+1.72)#52 | 0.78%(+1.61)#60 |
| 55. | Morton Borough | 2.39% | 0.67%(+1.72)#53 | 0.78%(+1.61)#61 |
| 56. | Lancaster | 2.35% | 0.67%(+1.68)#54 | 0.78%(+1.57)#62 |
| 57. | Ambler Borough | 2.32% | 0.67%(+1.65)#55 | 0.78%(+1.54)#63 |
| 58. | West Conshohocken Borough | 2.31% | 0.67%(+1.64)#56 | 0.78%(+1.53)#64 |
| 59. | Hayti | 2.27% | 0.67%(+1.60)#57 | 0.78%(+1.49)#65 |
| 60. | Harrisburg | 2.21% | 0.67%(+1.54)#58 | 0.78%(+1.43)#66 |
| 61. | New Britain Borough | 2.18% | 0.67%(+1.51)#59 | 0.78%(+1.40)#67 |
| 62. | Mcconnellsburg Borough | 2.08% | 0.67%(+1.41)#60 | 0.78%(+1.30)#68 |
| 63. | Wormleysburg Borough | 2.06% | 0.67%(+1.39)#61 | 0.78%(+1.28)#69 |
| 64. | Pine Grove Mills | 2.06% | 0.67%(+1.38)#62 | 0.78%(+1.28)#70 |
| 65. | Norristown Borough | 2.05% | 0.67%(+1.38)#63 | 0.78%(+1.27)#71 |
| 66. | Bryn Mawr | 2.05% | 0.67%(+1.38)#64 | 0.78%(+1.27)#72 |
| 67. | Cross Creek | 2.04% | 0.67%(+1.37)#65 | 0.78%(+1.26)#73 |
| 68. | Arlington Heights | 2.03% | 0.67%(+1.36)#66 | 0.78%(+1.25)#74 |
| 69. | Feasterville | 1.97% | 0.67%(+1.30)#67 | 0.78%(+1.20)#75 |
| 70. | Morgan Hill | 1.96% | 0.67%(+1.28)#68 | 0.78%(+1.18)#76 |
| 71. | Penn State Erie Behrend | 1.94% | 0.67%(+1.27)#69 | 0.78%(+1.16)#77 |
| 72. | Elizabethtown Borough | 1.88% | 0.67%(+1.21)#70 | 0.78%(+1.10)#78 |
| 73. | Hatfield Borough | 1.86% | 0.67%(+1.19)#71 | 0.78%(+1.08)#79 |
| 74. | Swarthmore Borough | 1.86% | 0.67%(+1.19)#72 | 0.78%(+1.08)#80 |
| 75. | Amity Gardens | 1.86% | 0.67%(+1.18)#73 | 0.78%(+1.08)#81 |
| 76. | Fullerton | 1.78% | 0.67%(+1.11)#74 | 0.78%(+1.000)#82 |
| 77. | Albion Borough | 1.74% | 0.67%(+1.07)#75 | 0.78%(+0.963)#83 |
| 78. | Lampeter | 1.70% | 0.67%(+1.03)#76 | 0.78%(+0.925)#84 |
| 79. | Masthope | 1.68% | 0.67%(+1.00)#77 | 0.78%(+0.896)#85 |
| 80. | Philadelphia | 1.65% | 0.67%(+0.978)#78 | 0.78%(+0.871)#443 |
| 81. | Breinigsville | 1.60% | 0.67%(+0.933)#79 | 0.78%(+0.826)#444 |
| 82. | Red Hill Borough | 1.58% | 0.67%(+0.905)#80 | 0.78%(+0.798)#445 |
| 83. | Freemansburg Borough | 1.57% | 0.67%(+0.901)#81 | 0.78%(+0.794)#446 |
| 84. | Edwardsville Borough | 1.52% | 0.67%(+0.851)#82 | 0.78%(+0.744)#447 |
| 85. | Penndel Borough | 1.48% | 0.67%(+0.809)#83 | 0.78%(+0.702)#448 |
| 86. | Progress | 1.44% | 0.67%(+0.771)#84 | 0.78%(+0.664)#449 |
| 87. | Brookhaven Borough | 1.44% | 0.67%(+0.767)#85 | 0.78%(+0.660)#450 |
| 88. | Spring Mount | 1.40% | 0.67%(+0.731)#86 | 0.78%(+0.624)#451 |
| 89. | East Stroudsburg Borough | 1.40% | 0.67%(+0.730)#87 | 0.78%(+0.623)#452 |
| 90. | Lansdale Borough | 1.38% | 0.67%(+0.711)#88 | 0.78%(+0.604)#453 |
| 91. | Hamburg Borough | 1.38% | 0.67%(+0.710)#89 | 0.78%(+0.603)#454 |
| 92. | Temple | 1.38% | 0.67%(+0.705)#90 | 0.78%(+0.598)#455 |
| 93. | Bellefonte Borough | 1.37% | 0.67%(+0.695)#91 | 0.78%(+0.588)#456 |
| 94. | Trooper | 1.35% | 0.67%(+0.678)#92 | 0.78%(+0.571)#457 |
| 95. | Fox Chase | 1.35% | 0.67%(+0.675)#93 | 0.78%(+0.567)#458 |
| 96. | Lemont | 1.34% | 0.67%(+0.671)#94 | 0.78%(+0.564)#459 |
| 97. | Wyomissing Borough | 1.32% | 0.67%(+0.647)#95 | 0.78%(+0.540)#460 |
| 98. | Lincoln University | 1.31% | 0.67%(+0.638)#96 | 0.78%(+0.531)#461 |
| 99. | Villanova | 1.30% | 0.67%(+0.627)#97 | 0.78%(+0.520)#462 |
| 100. | Greencastle Borough | 1.30% | 0.67%(+0.627)#98 | 0.78%(+0.519)#463 |
Common Questions
What are the Top 10 Cities with the Highest Percentage of Immigrants from Africa in Pennsylvania?
Top 10 Cities with the Highest Percentage of Immigrants from Africa in Pennsylvania are:
#1
25.64%
#2
13.06%
#3
8.31%
#4
6.74%
#5
5.95%
#6
5.81%
#7
5.28%
#8
4.93%
#9
4.75%
#10
4.40%
What city has the Highest Percentage of Immigrants from Africa in Pennsylvania?
Ronco has the Highest Percentage of Immigrants from Africa in Pennsylvania with 25.64%.
What is the Percentage of Immigrants from Africa in the State of Pennsylvania?
Percentage of Immigrants from Africa in Pennsylvania is 0.67%.
What is the Percentage of Immigrants from Africa in the United States?
Percentage of Immigrants from Africa in the United States is 0.78%.