Cities with the Highest Percentage of Honduran Population in New York
RELATED REPORTS & OPTIONS
Honduran
New York
Compare Cities
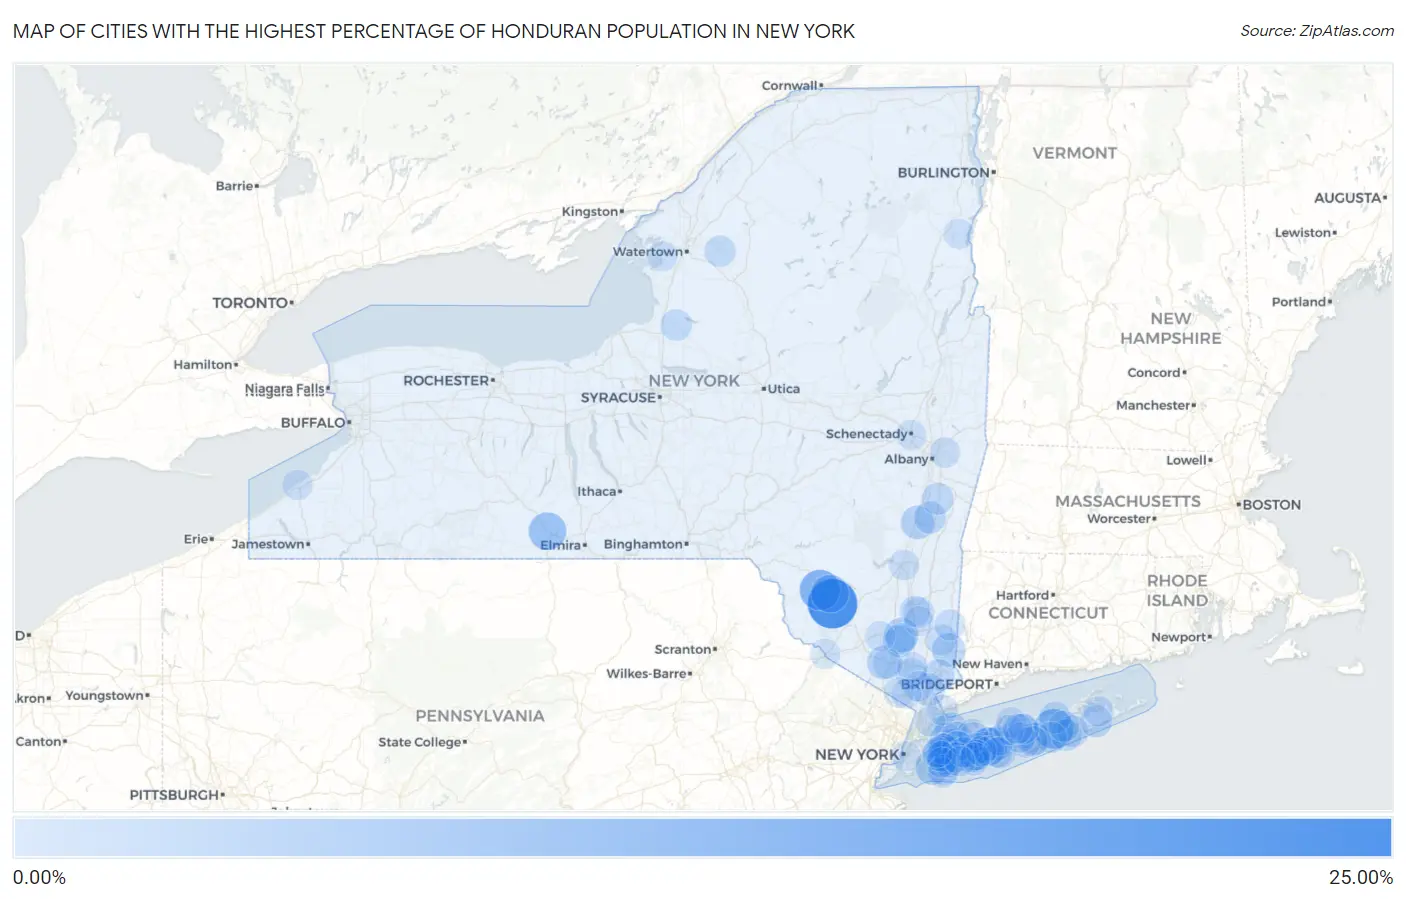
Map of Cities with the Highest Percentage of Honduran Population in New York
0.00%
25.00%
Cities with the Highest Percentage of Honduran Population in New York
| City | Honduran | vs State | vs National | |
| 1. | South Fallsburg | 23.89% | 0.44%(+23.5)#1 | 0.32%(+23.6)#7 |
| 2. | Liberty | 12.90% | 0.44%(+12.5)#2 | 0.32%(+12.6)#23 |
| 3. | Northampton | 12.10% | 0.44%(+11.7)#3 | 0.32%(+11.8)#26 |
| 4. | Loch Sheldrake | 9.37% | 0.44%(+8.93)#4 | 0.32%(+9.04)#45 |
| 5. | Coopers Plains | 9.26% | 0.44%(+8.82)#5 | 0.32%(+8.94)#47 |
| 6. | North Bay Shore | 9.08% | 0.44%(+8.64)#6 | 0.32%(+8.76)#50 |
| 7. | Wurtsboro Hills | 7.06% | 0.44%(+6.63)#7 | 0.32%(+6.74)#70 |
| 8. | Gordon Heights | 5.98% | 0.44%(+5.54)#8 | 0.32%(+5.66)#98 |
| 9. | Hempstead | 5.96% | 0.44%(+5.53)#9 | 0.32%(+5.64)#99 |
| 10. | Inwood | 5.58% | 0.44%(+5.14)#10 | 0.32%(+5.25)#107 |
| 11. | Mountain Dale | 5.38% | 0.44%(+4.95)#11 | 0.32%(+5.06)#114 |
| 12. | Newburgh | 5.21% | 0.44%(+4.77)#12 | 0.32%(+4.88)#123 |
| 13. | North Amityville | 5.16% | 0.44%(+4.73)#13 | 0.32%(+4.84)#126 |
| 14. | New Cassel | 5.08% | 0.44%(+4.65)#14 | 0.32%(+4.76)#130 |
| 15. | Central Islip | 4.46% | 0.44%(+4.02)#15 | 0.32%(+4.14)#162 |
| 16. | Brewster | 4.35% | 0.44%(+3.91)#16 | 0.32%(+4.03)#169 |
| 17. | Jefferson Heights | 4.32% | 0.44%(+3.88)#17 | 0.32%(+4.00)#171 |
| 18. | Monroe | 4.30% | 0.44%(+3.86)#18 | 0.32%(+3.98)#174 |
| 19. | Uniondale | 3.77% | 0.44%(+3.33)#19 | 0.32%(+3.45)#212 |
| 20. | Brentwood | 3.49% | 0.44%(+3.05)#20 | 0.32%(+3.17)#228 |
| 21. | Pleasantville | 3.45% | 0.44%(+3.01)#21 | 0.32%(+3.12)#232 |
| 22. | Locust Valley | 3.35% | 0.44%(+2.91)#22 | 0.32%(+3.03)#242 |
| 23. | Roosevelt | 3.33% | 0.44%(+2.90)#23 | 0.32%(+3.01)#246 |
| 24. | Farmingdale | 3.07% | 0.44%(+2.64)#24 | 0.32%(+2.75)#279 |
| 25. | Mastic | 3.01% | 0.44%(+2.58)#25 | 0.32%(+2.69)#286 |
| 26. | Lorenz Park | 3.00% | 0.44%(+2.56)#26 | 0.32%(+2.67)#289 |
| 27. | Bridgehampton | 2.82% | 0.44%(+2.38)#27 | 0.32%(+2.50)#319 |
| 28. | Roslyn Harbor | 2.74% | 0.44%(+2.31)#28 | 0.32%(+2.42)#332 |
| 29. | Vails Gate | 2.71% | 0.44%(+2.27)#29 | 0.32%(+2.38)#337 |
| 30. | Kinderhook | 2.66% | 0.44%(+2.23)#30 | 0.32%(+2.34)#344 |
| 31. | Great River | 2.51% | 0.44%(+2.07)#31 | 0.32%(+2.19)#379 |
| 32. | Bedford Hills | 2.39% | 0.44%(+1.95)#32 | 0.32%(+2.06)#397 |
| 33. | Muttontown | 2.31% | 0.44%(+1.88)#33 | 0.32%(+1.99)#414 |
| 34. | Hampton Bays | 2.31% | 0.44%(+1.87)#34 | 0.32%(+1.99)#417 |
| 35. | East Quogue | 2.30% | 0.44%(+1.86)#35 | 0.32%(+1.97)#419 |
| 36. | Riverhead | 2.27% | 0.44%(+1.84)#36 | 0.32%(+1.95)#422 |
| 37. | Altmar | 2.26% | 0.44%(+1.82)#37 | 0.32%(+1.94)#429 |
| 38. | West Hempstead | 2.17% | 0.44%(+1.74)#38 | 0.32%(+1.85)#447 |
| 39. | Lakeview | 2.12% | 0.44%(+1.69)#39 | 0.32%(+1.80)#460 |
| 40. | West Carthage | 2.02% | 0.44%(+1.59)#40 | 0.32%(+1.70)#479 |
| 41. | North Lindenhurst | 1.95% | 0.44%(+1.52)#41 | 0.32%(+1.63)#491 |
| 42. | New Windsor | 1.91% | 0.44%(+1.48)#42 | 0.32%(+1.59)#500 |
| 43. | Baywood | 1.77% | 0.44%(+1.33)#43 | 0.32%(+1.44)#531 |
| 44. | Montrose | 1.74% | 0.44%(+1.31)#44 | 0.32%(+1.42)#539 |
| 45. | New Hyde Park | 1.72% | 0.44%(+1.28)#45 | 0.32%(+1.40)#543 |
| 46. | Elmont | 1.66% | 0.44%(+1.22)#46 | 0.32%(+1.34)#557 |
| 47. | Remsenburg Speonk | 1.62% | 0.44%(+1.18)#47 | 0.32%(+1.29)#569 |
| 48. | Wyandanch | 1.54% | 0.44%(+1.11)#48 | 0.32%(+1.22)#603 |
| 49. | Flanders | 1.53% | 0.44%(+1.09)#49 | 0.32%(+1.21)#606 |
| 50. | Red Oaks Mill | 1.52% | 0.44%(+1.09)#50 | 0.32%(+1.20)#608 |
| 51. | Lake Carmel | 1.50% | 0.44%(+1.06)#51 | 0.32%(+1.17)#622 |
| 52. | Mineola | 1.49% | 0.44%(+1.06)#52 | 0.32%(+1.17)#623 |
| 53. | Garden City Park | 1.39% | 0.44%(+0.953)#53 | 0.32%(+1.07)#667 |
| 54. | Pawling | 1.39% | 0.44%(+0.949)#54 | 0.32%(+1.06)#669 |
| 55. | Copiague | 1.34% | 0.44%(+0.908)#55 | 0.32%(+1.02)#684 |
| 56. | Huntington Station | 1.27% | 0.44%(+0.836)#56 | 0.32%(+0.949)#724 |
| 57. | Spackenkill | 1.25% | 0.44%(+0.809)#57 | 0.32%(+0.923)#736 |
| 58. | Lincoln Park | 1.05% | 0.44%(+0.616)#58 | 0.32%(+0.730)#855 |
| 59. | Islandia | 1.04% | 0.44%(+0.601)#59 | 0.32%(+0.714)#868 |
| 60. | Port Chester | 1.04% | 0.44%(+0.599)#60 | 0.32%(+0.713)#870 |
| 61. | North Bellport | 1.03% | 0.44%(+0.589)#61 | 0.32%(+0.703)#876 |
| 62. | Peekskill | 1.02% | 0.44%(+0.587)#62 | 0.32%(+0.701)#879 |
| 63. | South Huntington | 1.02% | 0.44%(+0.583)#63 | 0.32%(+0.696)#883 |
| 64. | Hicksville | 0.99% | 0.44%(+0.557)#64 | 0.32%(+0.671)#897 |
| 65. | Port Jefferson Station | 0.92% | 0.44%(+0.479)#65 | 0.32%(+0.593)#948 |
| 66. | Medford | 0.89% | 0.44%(+0.457)#66 | 0.32%(+0.571)#962 |
| 67. | Sag Harbor | 0.89% | 0.44%(+0.453)#67 | 0.32%(+0.566)#964 |
| 68. | Shirley | 0.88% | 0.44%(+0.439)#68 | 0.32%(+0.553)#976 |
| 69. | Bay Shore | 0.86% | 0.44%(+0.421)#69 | 0.32%(+0.535)#994 |
| 70. | Island Park | 0.85% | 0.44%(+0.413)#70 | 0.32%(+0.526)#1,003 |
| 71. | Ossining | 0.84% | 0.44%(+0.406)#71 | 0.32%(+0.519)#1,008 |
| 72. | Wynantskill | 0.84% | 0.44%(+0.406)#72 | 0.32%(+0.519)#1,010 |
| 73. | Long Beach | 0.79% | 0.44%(+0.353)#73 | 0.32%(+0.466)#1,071 |
| 74. | Port Jervis | 0.77% | 0.44%(+0.332)#74 | 0.32%(+0.445)#1,091 |
| 75. | Baldwin | 0.76% | 0.44%(+0.325)#75 | 0.32%(+0.438)#1,104 |
| 76. | West Babylon | 0.76% | 0.44%(+0.323)#76 | 0.32%(+0.437)#1,106 |
| 77. | Schenectady | 0.73% | 0.44%(+0.297)#77 | 0.32%(+0.410)#1,132 |
| 78. | Centereach | 0.73% | 0.44%(+0.294)#78 | 0.32%(+0.408)#1,136 |
| 79. | East Islip | 0.73% | 0.44%(+0.293)#79 | 0.32%(+0.407)#1,138 |
| 80. | North Bellmore | 0.73% | 0.44%(+0.290)#80 | 0.32%(+0.404)#1,144 |
| 81. | Franklin Square | 0.72% | 0.44%(+0.286)#81 | 0.32%(+0.400)#1,147 |
| 82. | Mineville | 0.72% | 0.44%(+0.286)#82 | 0.32%(+0.400)#1,148 |
| 83. | Spring Valley | 0.72% | 0.44%(+0.286)#83 | 0.32%(+0.399)#1,149 |
| 84. | Dunkirk | 0.70% | 0.44%(+0.266)#84 | 0.32%(+0.380)#1,179 |
| 85. | Fallsburg | 0.70% | 0.44%(+0.265)#85 | 0.32%(+0.379)#1,181 |
| 86. | Plainedge | 0.69% | 0.44%(+0.256)#86 | 0.32%(+0.369)#1,193 |
| 87. | Middle Island | 0.67% | 0.44%(+0.235)#87 | 0.32%(+0.348)#1,223 |
| 88. | Sackets Harbor | 0.65% | 0.44%(+0.217)#88 | 0.32%(+0.331)#1,250 |
| 89. | Harriman | 0.64% | 0.44%(+0.207)#89 | 0.32%(+0.320)#1,262 |
| 90. | Coram | 0.63% | 0.44%(+0.192)#90 | 0.32%(+0.306)#1,281 |
| 91. | New Rochelle | 0.63% | 0.44%(+0.191)#91 | 0.32%(+0.305)#1,282 |
| 92. | North Babylon | 0.63% | 0.44%(+0.189)#92 | 0.32%(+0.303)#1,284 |
| 93. | Maybrook | 0.61% | 0.44%(+0.170)#93 | 0.32%(+0.283)#1,305 |
| 94. | Bardonia | 0.60% | 0.44%(+0.163)#94 | 0.32%(+0.277)#1,314 |
| 95. | Myers Corner | 0.59% | 0.44%(+0.155)#95 | 0.32%(+0.269)#1,328 |
| 96. | Lynbrook | 0.59% | 0.44%(+0.155)#96 | 0.32%(+0.269)#1,331 |
| 97. | Lindenhurst | 0.59% | 0.44%(+0.150)#97 | 0.32%(+0.263)#1,340 |
| 98. | New York | 0.58% | 0.44%(+0.148)#98 | 0.32%(+0.262)#1,345 |
| 99. | Floral Park | 0.58% | 0.44%(+0.143)#99 | 0.32%(+0.256)#1,354 |
| 100. | Wantagh | 0.58% | 0.44%(+0.142)#100 | 0.32%(+0.255)#1,356 |
Common Questions
What are the Top 10 Cities with the Highest Percentage of Honduran Population in New York?
Top 10 Cities with the Highest Percentage of Honduran Population in New York are:
#1
23.89%
#2
12.90%
#3
12.10%
#4
9.37%
#5
9.26%
#6
9.08%
#7
5.98%
#8
5.96%
#9
5.58%
#10
5.21%
What city has the Highest Percentage of Honduran Population in New York?
South Fallsburg has the Highest Percentage of Honduran Population in New York with 23.89%.
What is the Percentage of Honduran Population in the State of New York?
Percentage of Honduran Population in New York is 0.44%.
What is the Percentage of Honduran Population in the United States?
Percentage of Honduran Population in the United States is 0.32%.