Elizabeth Lake, CA Map & Demographics
Elizabeth Lake Map
Elizabeth Lake Overview
$45,330
PER CAPITA INCOME
$116,319
AVG FAMILY INCOME
$99,811
AVG HOUSEHOLD INCOME
45.8%
WAGE / INCOME GAP [ % ]
54.2¢/ $1
WAGE / INCOME GAP [ $ ]
0.36
INEQUALITY / GINI INDEX
1,764
TOTAL POPULATION
912
MALE POPULATION
852
FEMALE POPULATION
107.04
MALES / 100 FEMALES
93.42
FEMALES / 100 MALES
38.9
MEDIAN AGE
2.9
AVG FAMILY SIZE
2.5
AVG HOUSEHOLD SIZE
972
LABOR FORCE [ PEOPLE ]
63.3%
PERCENT IN LABOR FORCE
8.7%
UNEMPLOYMENT RATE
Elizabeth Lake Area Codes
Income in Elizabeth Lake
Income Overview in Elizabeth Lake
Per Capita Income in Elizabeth Lake is $45,330, while median incomes of families and households are $116,319 and $99,811 respectively.
| Characteristic | Number | Measure |
| Per Capita Income | 1,764 | $45,330 |
| Median Family Income | 473 | $116,319 |
| Mean Family Income | 473 | $124,289 |
| Median Household Income | 693 | $99,811 |
| Mean Household Income | 693 | $113,618 |
| Income Deficit | 473 | $0 |
| Wage / Income Gap (%) | 1,764 | 45.82% |
| Wage / Income Gap ($) | 1,764 | 54.18¢ per $1 |
| Gini / Inequality Index | 1,764 | 0.36 |
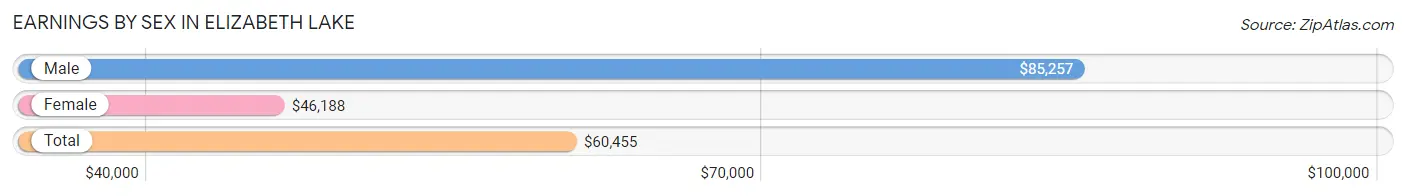
Earnings by Sex in Elizabeth Lake
Average Earnings in Elizabeth Lake are $60,455, $85,257 for men and $46,188 for women, a difference of 45.8%.
| Sex | Number | Average Earnings |
| Male | 559 (58.5%) | $85,257 |
| Female | 397 (41.5%) | $46,188 |
| Total | 956 (100.0%) | $60,455 |
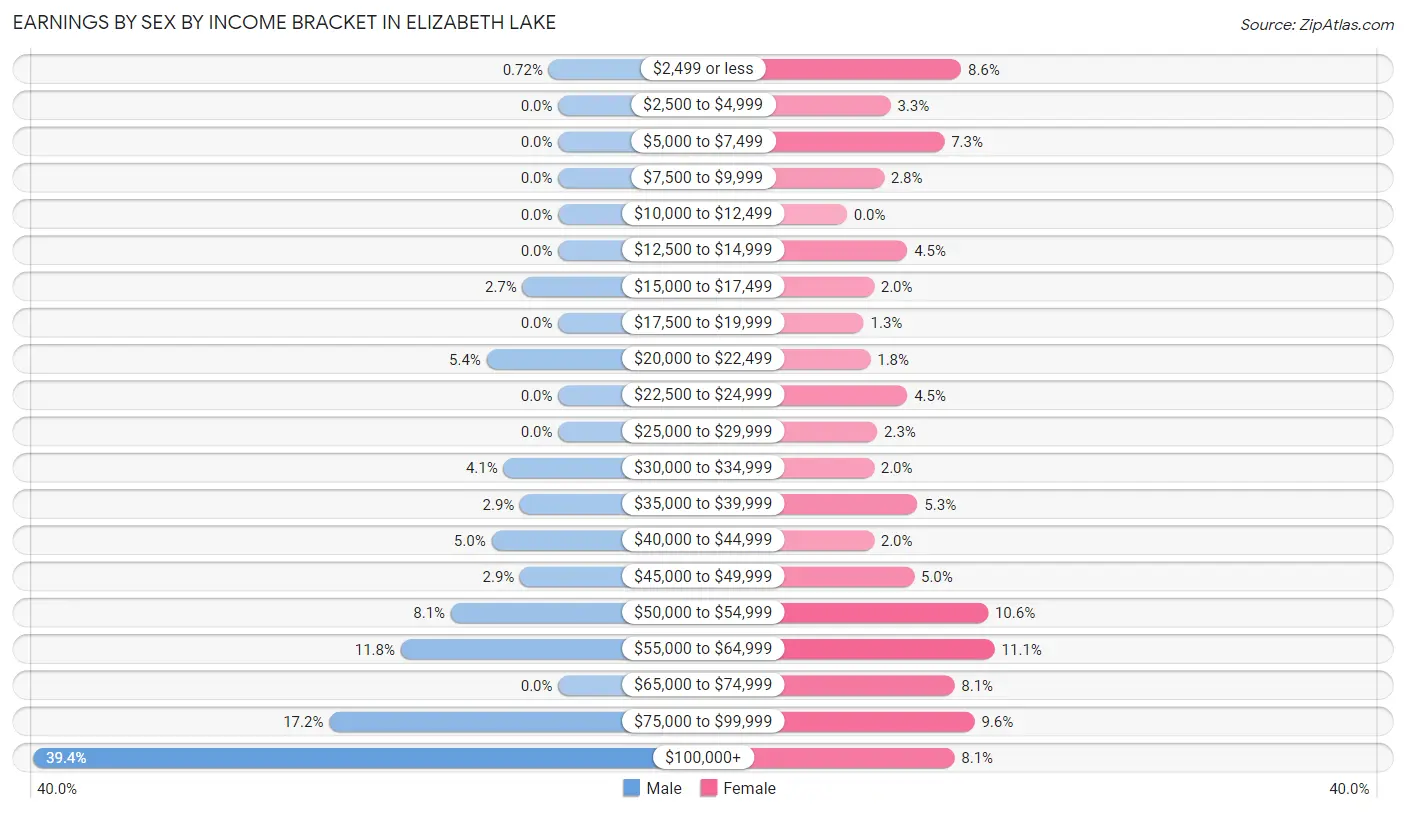
Earnings by Sex by Income Bracket in Elizabeth Lake
The most common earnings brackets in Elizabeth Lake are $100,000+ for men (220 | 39.4%) and $55,000 to $64,999 for women (44 | 11.1%).
| Income | Male | Female |
| $2,499 or less | 4 (0.7%) | 34 (8.6%) |
| $2,500 to $4,999 | 0 (0.0%) | 13 (3.3%) |
| $5,000 to $7,499 | 0 (0.0%) | 29 (7.3%) |
| $7,500 to $9,999 | 0 (0.0%) | 11 (2.8%) |
| $10,000 to $12,499 | 0 (0.0%) | 0 (0.0%) |
| $12,500 to $14,999 | 0 (0.0%) | 18 (4.5%) |
| $15,000 to $17,499 | 15 (2.7%) | 8 (2.0%) |
| $17,500 to $19,999 | 0 (0.0%) | 5 (1.3%) |
| $20,000 to $22,499 | 30 (5.4%) | 7 (1.8%) |
| $22,500 to $24,999 | 0 (0.0%) | 18 (4.5%) |
| $25,000 to $29,999 | 0 (0.0%) | 9 (2.3%) |
| $30,000 to $34,999 | 23 (4.1%) | 8 (2.0%) |
| $35,000 to $39,999 | 16 (2.9%) | 21 (5.3%) |
| $40,000 to $44,999 | 28 (5.0%) | 8 (2.0%) |
| $45,000 to $49,999 | 16 (2.9%) | 20 (5.0%) |
| $50,000 to $54,999 | 45 (8.1%) | 42 (10.6%) |
| $55,000 to $64,999 | 66 (11.8%) | 44 (11.1%) |
| $65,000 to $74,999 | 0 (0.0%) | 32 (8.1%) |
| $75,000 to $99,999 | 96 (17.2%) | 38 (9.6%) |
| $100,000+ | 220 (39.4%) | 32 (8.1%) |
| Total | 559 (100.0%) | 397 (100.0%) |
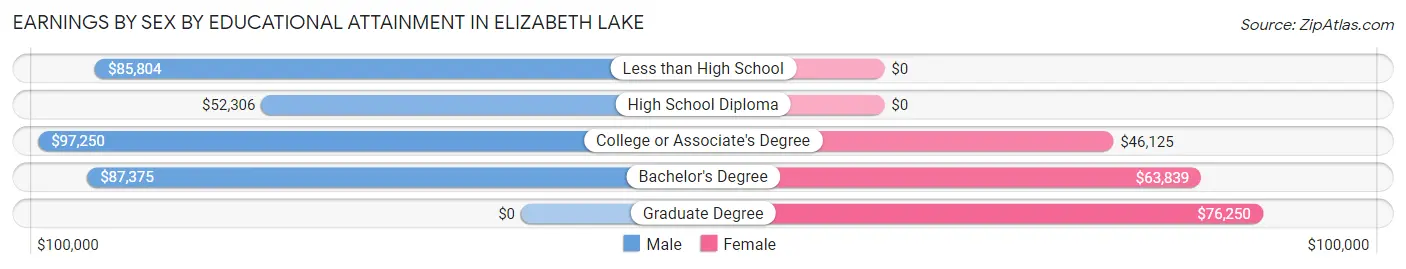
Earnings by Sex by Educational Attainment in Elizabeth Lake
Average earnings in Elizabeth Lake are $85,882 for men and $50,577 for women, a difference of 41.1%. Men with an educational attainment of college or associate's degree enjoy the highest average annual earnings of $97,250, while those with high school diploma education earn the least with $52,306. Women with an educational attainment of graduate degree earn the most with the average annual earnings of $76,250, while those with college or associate's degree education have the smallest earnings of $46,125.
| Educational Attainment | Male Income | Female Income |
| Less than High School | $85,804 | $0 |
| High School Diploma | $52,306 | $0 |
| College or Associate's Degree | $97,250 | $46,125 |
| Bachelor's Degree | $87,375 | $63,839 |
| Graduate Degree | - | - |
| Total | $85,882 | $50,577 |
Family Income in Elizabeth Lake
Family Income Brackets in Elizabeth Lake
According to the Elizabeth Lake family income data, there are 131 families falling into the $150,000 to $199,999 income range, which is the most common income bracket and makes up 27.7% of all families.
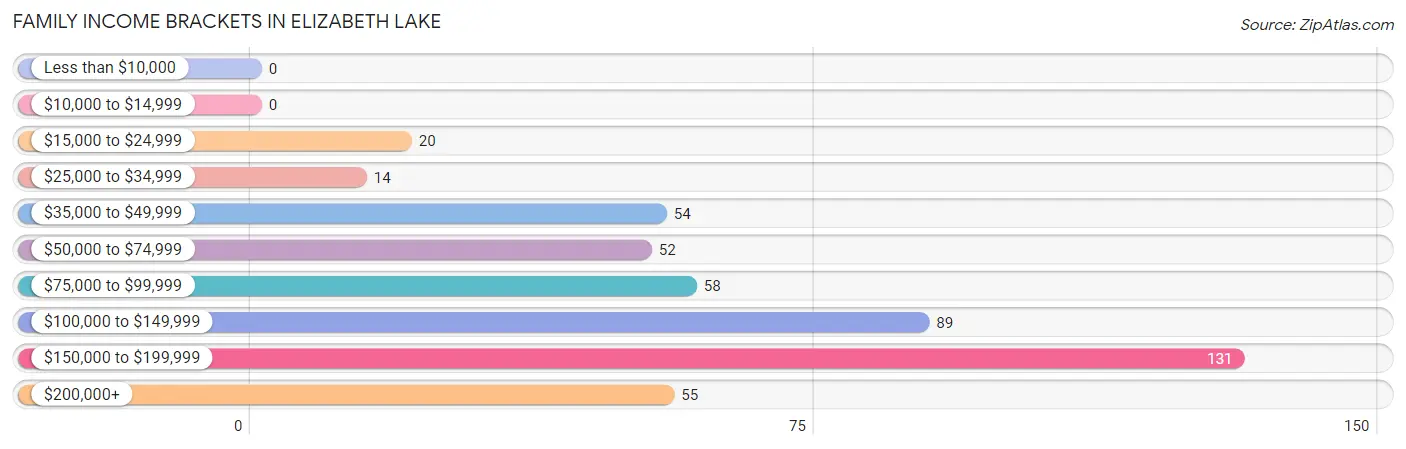
| Income Bracket | # Families | % Families |
| Less than $10,000 | 0 | 0.0% |
| $10,000 to $14,999 | 0 | 0.0% |
| $15,000 to $24,999 | 20 | 4.2% |
| $25,000 to $34,999 | 14 | 3.0% |
| $35,000 to $49,999 | 54 | 11.4% |
| $50,000 to $74,999 | 52 | 11.0% |
| $75,000 to $99,999 | 58 | 12.3% |
| $100,000 to $149,999 | 89 | 18.8% |
| $150,000 to $199,999 | 131 | 27.7% |
| $200,000+ | 55 | 11.6% |
Family Income by Famaliy Size in Elizabeth Lake
5-person families (45 | 9.5%) account for the highest median family income in Elizabeth Lake with $183,313 per family, while 3-person families (101 | 21.3%) have the highest median income of $56,830 per family member.
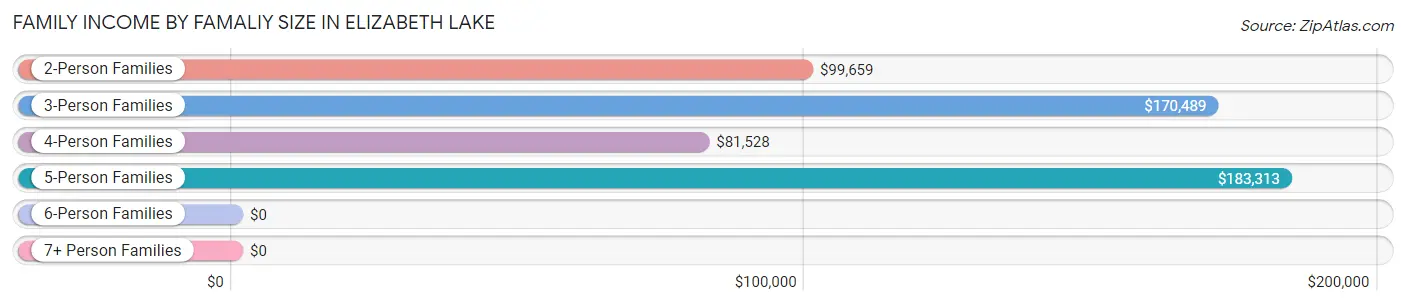
| Income Bracket | # Families | Median Income |
| 2-Person Families | 251 (53.1%) | $99,659 |
| 3-Person Families | 101 (21.3%) | $170,489 |
| 4-Person Families | 71 (15.0%) | $81,528 |
| 5-Person Families | 45 (9.5%) | $183,313 |
| 6-Person Families | 5 (1.1%) | $0 |
| 7+ Person Families | 0 (0.0%) | $0 |
| Total | 473 (100.0%) | $116,319 |
Family Income by Number of Earners in Elizabeth Lake
The median family income in Elizabeth Lake is $116,319, with families comprising 3+ earners (51) having the highest median family income of $184,087, while families with 1 earner (196) have the lowest median family income of $77,083, accounting for 10.8% and 41.4% of families, respectively.
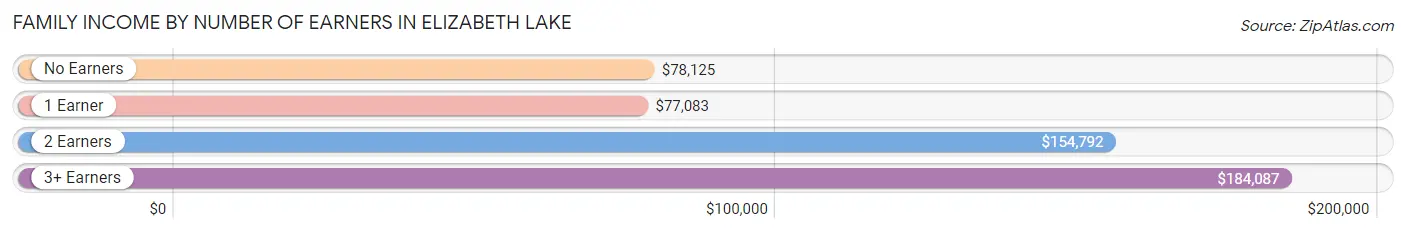
| Number of Earners | # Families | Median Income |
| No Earners | 54 (11.4%) | $78,125 |
| 1 Earner | 196 (41.4%) | $77,083 |
| 2 Earners | 172 (36.4%) | $154,792 |
| 3+ Earners | 51 (10.8%) | $184,087 |
| Total | 473 (100.0%) | $116,319 |
Household Income in Elizabeth Lake
Household Income Brackets in Elizabeth Lake
With 143 households falling in the category, the $150,000 to $199,999 income range is the most frequent in Elizabeth Lake, accounting for 20.6% of all households. In contrast, only 5 households (0.7%) fall into the $10,000 to $14,999 income bracket, making it the least populous group.
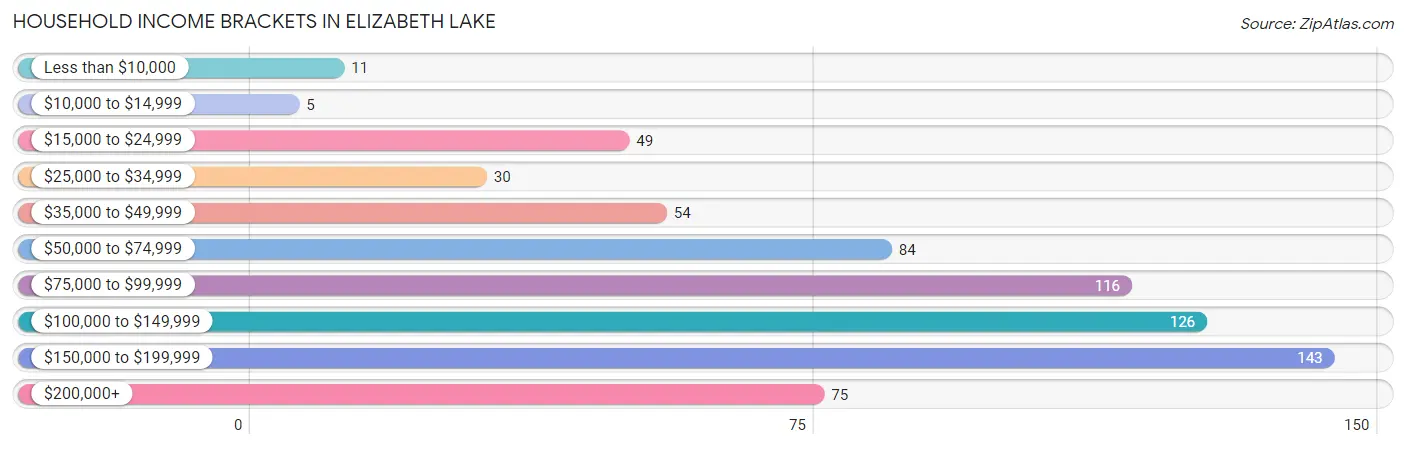
| Income Bracket | # Households | % Households |
| Less than $10,000 | 11 | 1.6% |
| $10,000 to $14,999 | 5 | 0.7% |
| $15,000 to $24,999 | 49 | 7.1% |
| $25,000 to $34,999 | 30 | 4.3% |
| $35,000 to $49,999 | 54 | 7.8% |
| $50,000 to $74,999 | 84 | 12.1% |
| $75,000 to $99,999 | 116 | 16.7% |
| $100,000 to $149,999 | 126 | 18.2% |
| $150,000 to $199,999 | 143 | 20.6% |
| $200,000+ | 75 | 10.8% |
Household Income by Householder Age in Elizabeth Lake
The median household income in Elizabeth Lake is $99,811, with the highest median household income of $122,955 found in the 45 to 64 years age bracket for the primary householder. A total of 258 households (37.2%) fall into this category. Meanwhile, the 15 to 24 years age bracket for the primary householder has the lowest median household income of $0, with 7 households (1.0%) in this group.
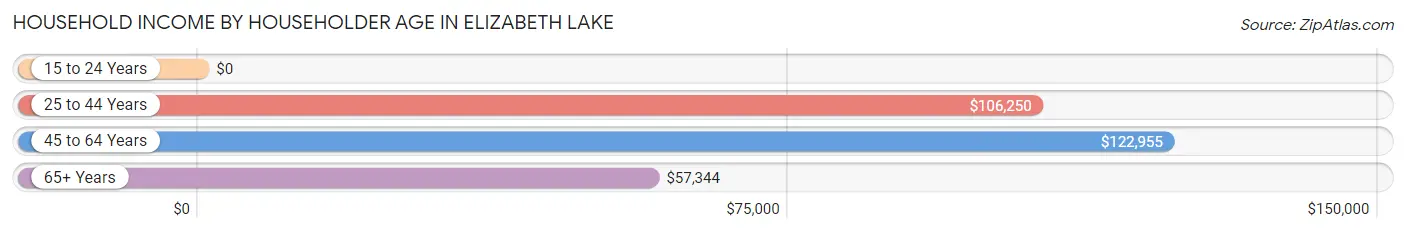
| Income Bracket | # Households | Median Income |
| 15 to 24 Years | 7 (1.0%) | $0 |
| 25 to 44 Years | 237 (34.2%) | $106,250 |
| 45 to 64 Years | 258 (37.2%) | $122,955 |
| 65+ Years | 191 (27.6%) | $57,344 |
| Total | 693 (100.0%) | $99,811 |
Poverty in Elizabeth Lake
Income Below Poverty by Sex and Age in Elizabeth Lake
With 1.2% poverty level for males and 6.4% for females among the residents of Elizabeth Lake, 75 year old and over males and 25 to 34 year old females are the most vulnerable to poverty, with 6 males (13.6%) and 33 females (20.7%) in their respective age groups living below the poverty level.
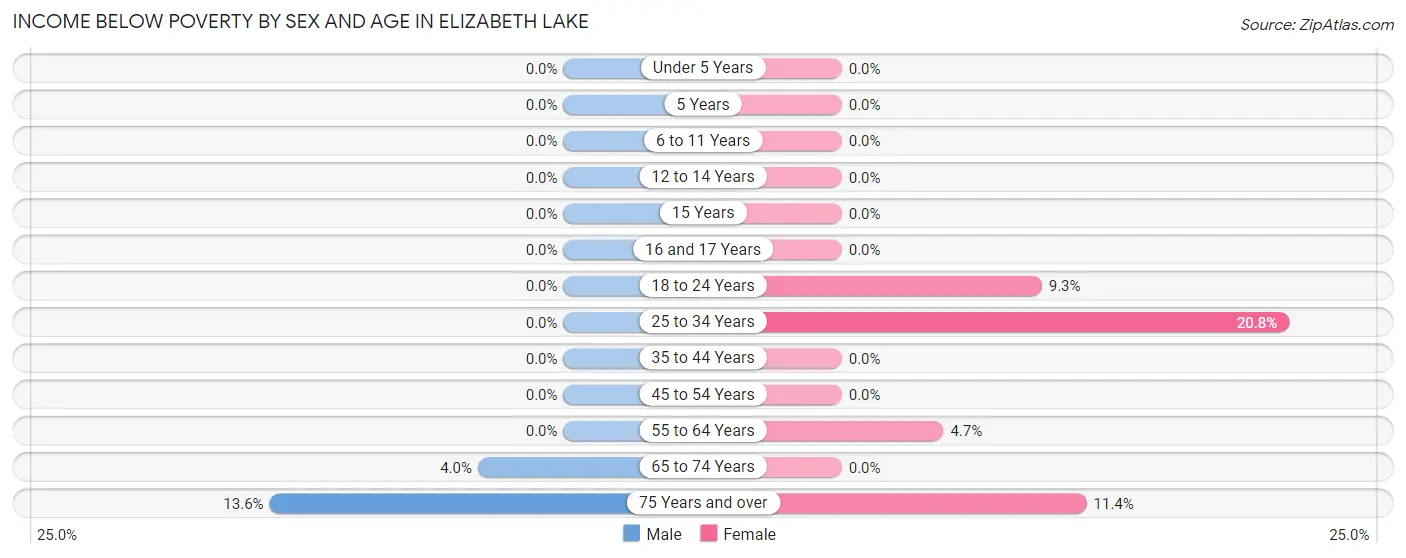
| Age Bracket | Male | Female |
| Under 5 Years | 0 (0.0%) | 0 (0.0%) |
| 5 Years | 0 (0.0%) | 0 (0.0%) |
| 6 to 11 Years | 0 (0.0%) | 0 (0.0%) |
| 12 to 14 Years | 0 (0.0%) | 0 (0.0%) |
| 15 Years | 0 (0.0%) | 0 (0.0%) |
| 16 and 17 Years | 0 (0.0%) | 0 (0.0%) |
| 18 to 24 Years | 0 (0.0%) | 9 (9.3%) |
| 25 to 34 Years | 0 (0.0%) | 33 (20.7%) |
| 35 to 44 Years | 0 (0.0%) | 0 (0.0%) |
| 45 to 54 Years | 0 (0.0%) | 0 (0.0%) |
| 55 to 64 Years | 0 (0.0%) | 6 (4.7%) |
| 65 to 74 Years | 5 (4.0%) | 0 (0.0%) |
| 75 Years and over | 6 (13.6%) | 5 (11.4%) |
| Total | 11 (1.2%) | 53 (6.4%) |
Income Above Poverty by Sex and Age in Elizabeth Lake
According to the poverty statistics in Elizabeth Lake, males aged under 5 years and females aged under 5 years are the age groups that are most secure financially, with 100.0% of males and 100.0% of females in these age groups living above the poverty line.
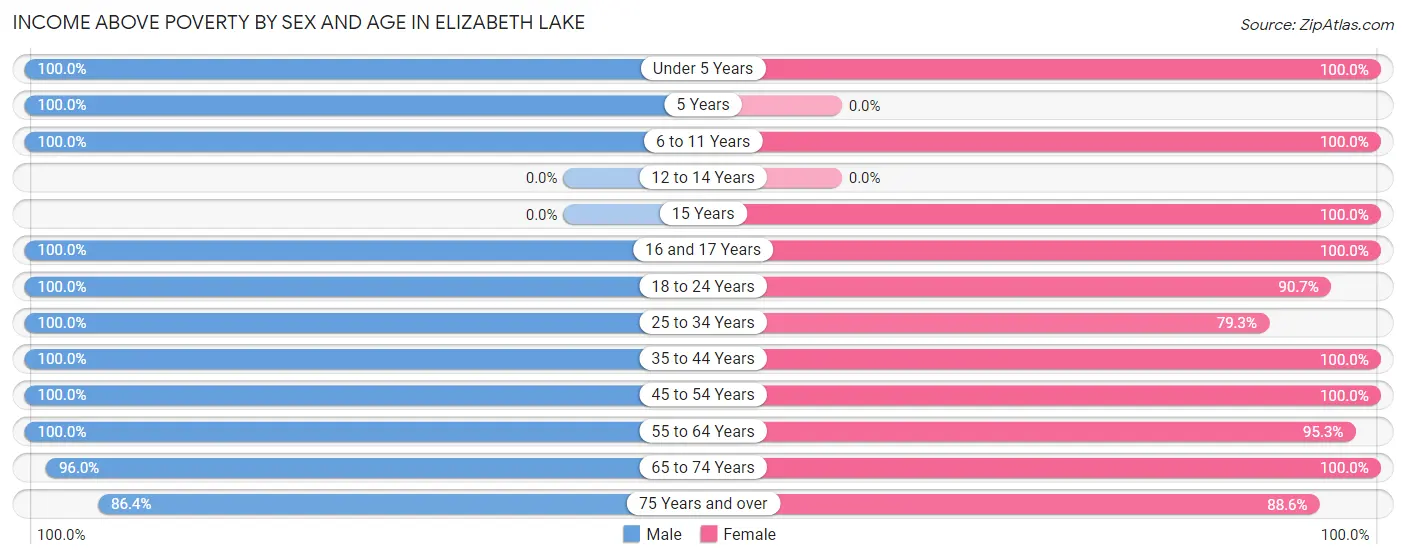
| Age Bracket | Male | Female |
| Under 5 Years | 59 (100.0%) | 31 (100.0%) |
| 5 Years | 8 (100.0%) | 0 (0.0%) |
| 6 to 11 Years | 81 (100.0%) | 21 (100.0%) |
| 12 to 14 Years | 0 (0.0%) | 0 (0.0%) |
| 15 Years | 0 (0.0%) | 9 (100.0%) |
| 16 and 17 Years | 33 (100.0%) | 19 (100.0%) |
| 18 to 24 Years | 41 (100.0%) | 88 (90.7%) |
| 25 to 34 Years | 171 (100.0%) | 126 (79.2%) |
| 35 to 44 Years | 130 (100.0%) | 74 (100.0%) |
| 45 to 54 Years | 133 (100.0%) | 147 (100.0%) |
| 55 to 64 Years | 86 (100.0%) | 121 (95.3%) |
| 65 to 74 Years | 121 (96.0%) | 104 (100.0%) |
| 75 Years and over | 38 (86.4%) | 39 (88.6%) |
| Total | 901 (98.8%) | 779 (93.6%) |
Income Below Poverty Among Married-Couple Families in Elizabeth Lake
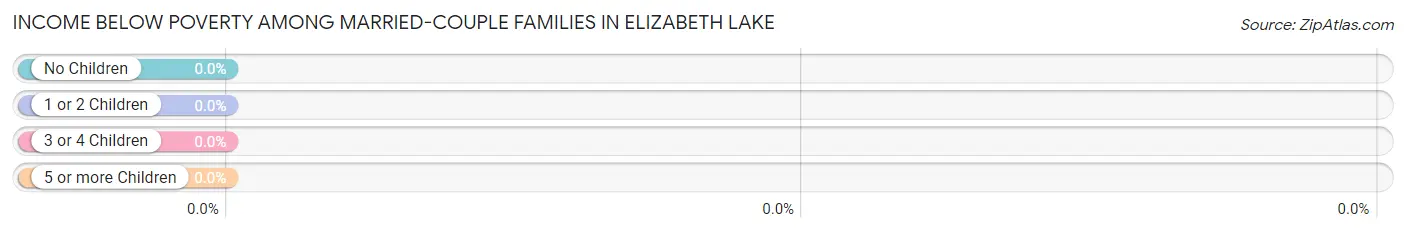
| Children | Above Poverty | Below Poverty |
| No Children | 240 (100.0%) | 0 (0.0%) |
| 1 or 2 Children | 123 (100.0%) | 0 (0.0%) |
| 3 or 4 Children | 0 (0.0%) | 0 (0.0%) |
| 5 or more Children | 0 (0.0%) | 0 (0.0%) |
| Total | 363 (100.0%) | 0 (0.0%) |
Income Below Poverty Among Single-Parent Households in Elizabeth Lake
| Children | Single Father | Single Mother |
| No Children | 0 (0.0%) | 0 (0.0%) |
| 1 or 2 Children | 0 (0.0%) | 0 (0.0%) |
| 3 or 4 Children | 0 (0.0%) | 0 (0.0%) |
| 5 or more Children | 0 (0.0%) | 0 (0.0%) |
| Total | 0 (0.0%) | 0 (0.0%) |
Income Below Poverty Among Married-Couple vs Single-Parent Households in Elizabeth Lake
| Children | Married-Couple Families | Single-Parent Households |
| No Children | 0 (0.0%) | 0 (0.0%) |
| 1 or 2 Children | 0 (0.0%) | 0 (0.0%) |
| 3 or 4 Children | 0 (0.0%) | 0 (0.0%) |
| 5 or more Children | 0 (0.0%) | 0 (0.0%) |
| Total | 0 (0.0%) | 0 (0.0%) |
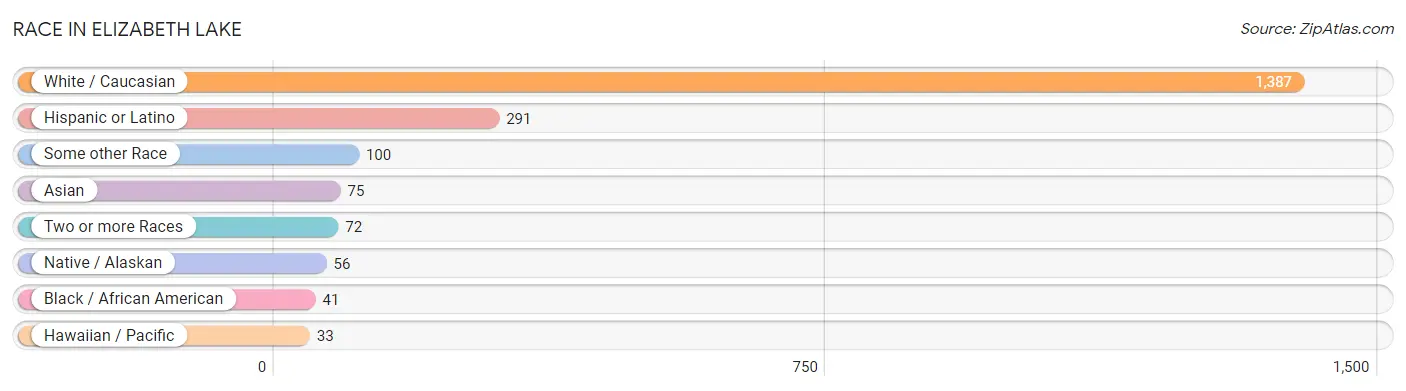
Race in Elizabeth Lake
The most populous races in Elizabeth Lake are White / Caucasian (1,387 | 78.6%), Hispanic or Latino (291 | 16.5%), and Some other Race (100 | 5.7%).
| Race | # Population | % Population |
| Asian | 75 | 4.3% |
| Black / African American | 41 | 2.3% |
| Hawaiian / Pacific | 33 | 1.9% |
| Hispanic or Latino | 291 | 16.5% |
| Native / Alaskan | 56 | 3.2% |
| White / Caucasian | 1,387 | 78.6% |
| Two or more Races | 72 | 4.1% |
| Some other Race | 100 | 5.7% |
| Total | 1,764 | 100.0% |
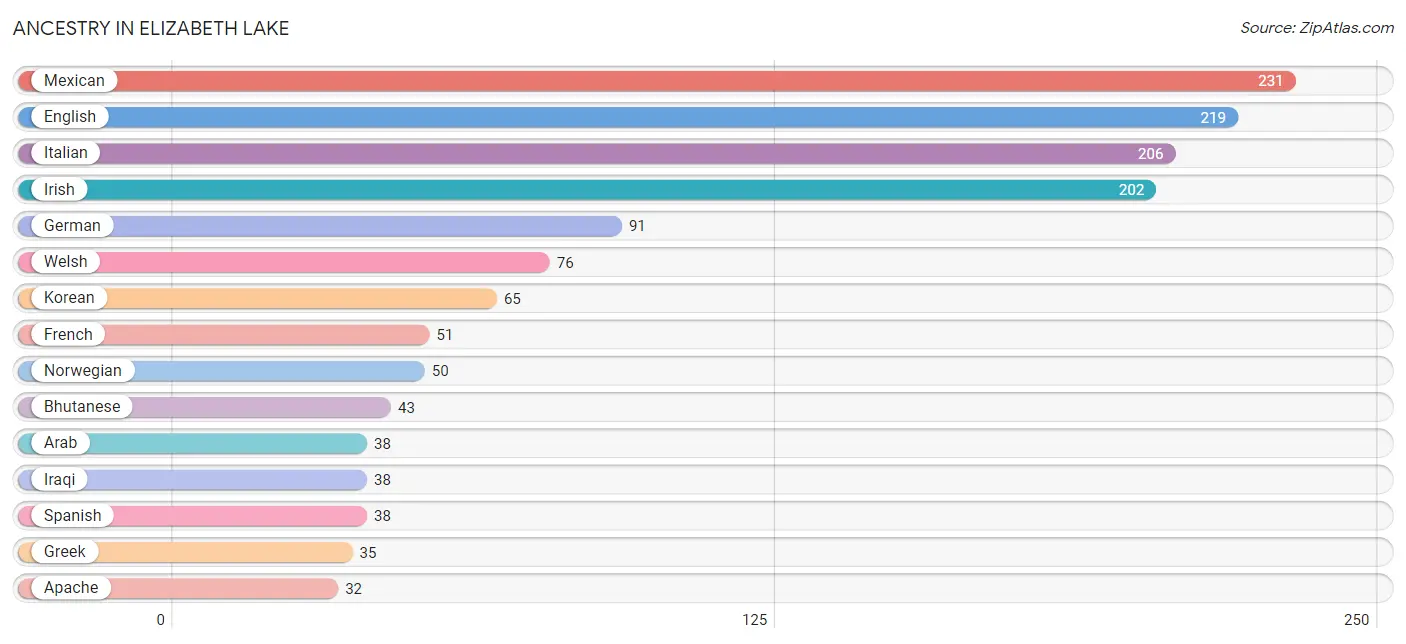
Ancestry in Elizabeth Lake
The most populous ancestries reported in Elizabeth Lake are Mexican (231 | 13.1%), English (219 | 12.4%), Italian (206 | 11.7%), Irish (202 | 11.5%), and German (91 | 5.2%), together accounting for 53.8% of all Elizabeth Lake residents.
| Ancestry | # Population | % Population |
| American | 9 | 0.5% |
| Apache | 32 | 1.8% |
| Arab | 38 | 2.1% |
| Armenian | 31 | 1.8% |
| Austrian | 4 | 0.2% |
| Bhutanese | 43 | 2.4% |
| British | 9 | 0.5% |
| Canadian | 4 | 0.2% |
| Central American | 18 | 1.0% |
| Czechoslovakian | 11 | 0.6% |
| Danish | 28 | 1.6% |
| Dutch | 4 | 0.2% |
| Eastern European | 4 | 0.2% |
| English | 219 | 12.4% |
| European | 9 | 0.5% |
| French | 51 | 2.9% |
| French Canadian | 12 | 0.7% |
| German | 91 | 5.2% |
| Greek | 35 | 2.0% |
| Honduran | 18 | 1.0% |
| Indian (Asian) | 18 | 1.0% |
| Iraqi | 38 | 2.1% |
| Irish | 202 | 11.5% |
| Italian | 206 | 11.7% |
| Jamaican | 27 | 1.5% |
| Korean | 65 | 3.7% |
| Mexican | 231 | 13.1% |
| Mexican American Indian | 20 | 1.1% |
| Northern European | 4 | 0.2% |
| Norwegian | 50 | 2.8% |
| Pakistani | 6 | 0.3% |
| Russian | 15 | 0.9% |
| Scandinavian | 5 | 0.3% |
| Scotch-Irish | 3 | 0.2% |
| Scottish | 23 | 1.3% |
| Spaniard | 4 | 0.2% |
| Spanish | 38 | 2.1% |
| Swedish | 18 | 1.0% |
| Ukrainian | 22 | 1.3% |
| Welsh | 76 | 4.3% |
| Yugoslavian | 4 | 0.2% | View All 41 Rows |
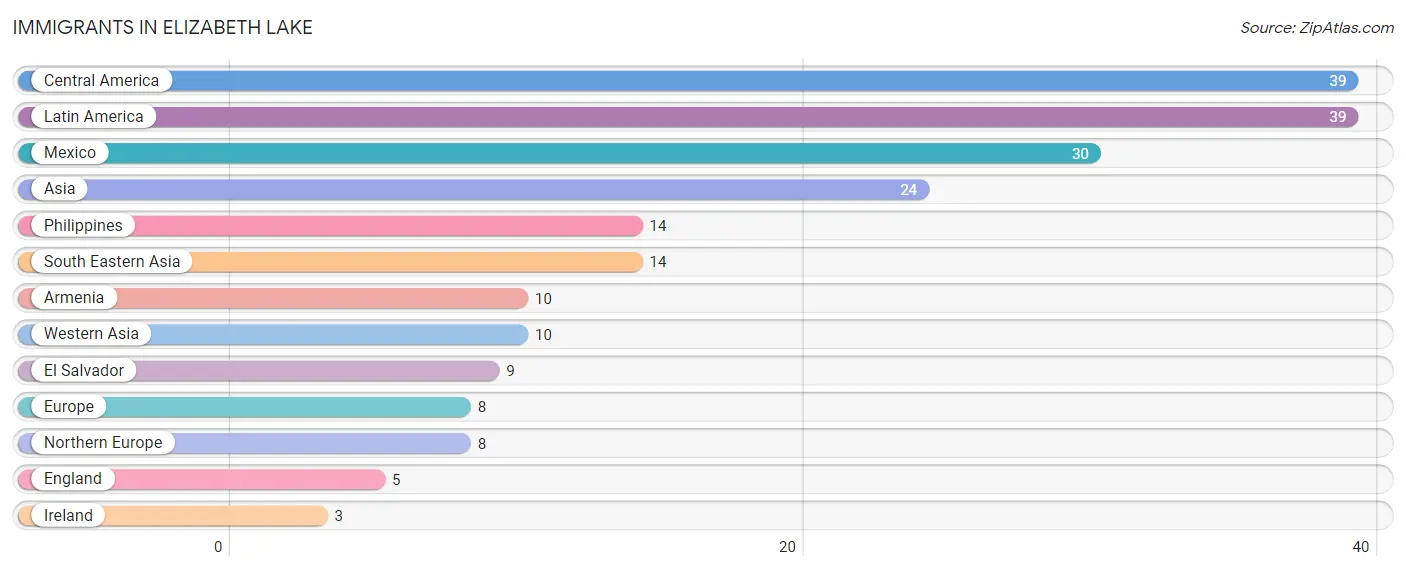
Immigrants in Elizabeth Lake
The most numerous immigrant groups reported in Elizabeth Lake came from Central America (39 | 2.2%), Latin America (39 | 2.2%), Mexico (30 | 1.7%), Asia (24 | 1.4%), and Philippines (14 | 0.8%), together accounting for 8.3% of all Elizabeth Lake residents.
| Immigration Origin | # Population | % Population |
| Armenia | 10 | 0.6% |
| Asia | 24 | 1.4% |
| Central America | 39 | 2.2% |
| El Salvador | 9 | 0.5% |
| England | 5 | 0.3% |
| Europe | 8 | 0.4% |
| Ireland | 3 | 0.2% |
| Latin America | 39 | 2.2% |
| Mexico | 30 | 1.7% |
| Northern Europe | 8 | 0.4% |
| Philippines | 14 | 0.8% |
| South Eastern Asia | 14 | 0.8% |
| Western Asia | 10 | 0.6% | View All 13 Rows |
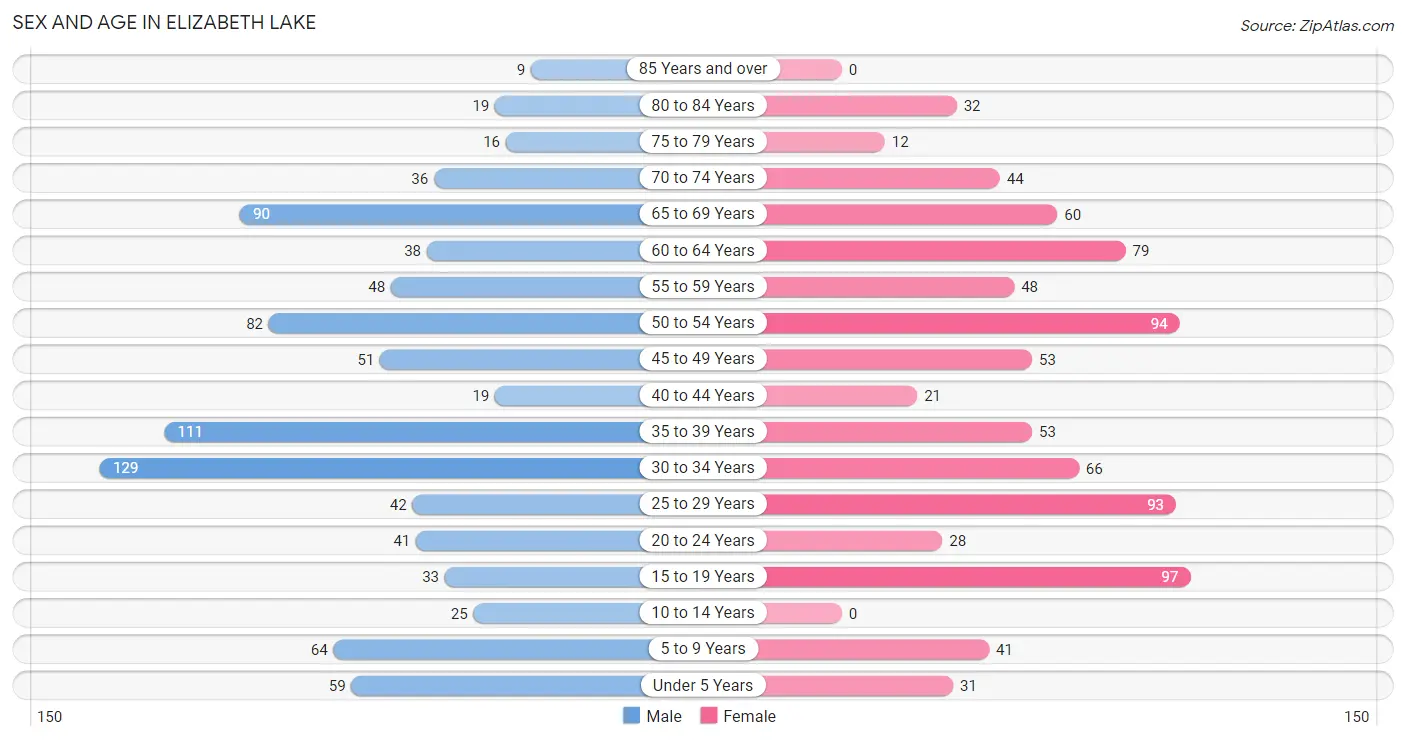
Sex and Age in Elizabeth Lake
Sex and Age in Elizabeth Lake
The most populous age groups in Elizabeth Lake are 30 to 34 Years (129 | 14.1%) for men and 15 to 19 Years (97 | 11.4%) for women.
| Age Bracket | Male | Female |
| Under 5 Years | 59 (6.5%) | 31 (3.6%) |
| 5 to 9 Years | 64 (7.0%) | 41 (4.8%) |
| 10 to 14 Years | 25 (2.7%) | 0 (0.0%) |
| 15 to 19 Years | 33 (3.6%) | 97 (11.4%) |
| 20 to 24 Years | 41 (4.5%) | 28 (3.3%) |
| 25 to 29 Years | 42 (4.6%) | 93 (10.9%) |
| 30 to 34 Years | 129 (14.1%) | 66 (7.7%) |
| 35 to 39 Years | 111 (12.2%) | 53 (6.2%) |
| 40 to 44 Years | 19 (2.1%) | 21 (2.5%) |
| 45 to 49 Years | 51 (5.6%) | 53 (6.2%) |
| 50 to 54 Years | 82 (9.0%) | 94 (11.0%) |
| 55 to 59 Years | 48 (5.3%) | 48 (5.6%) |
| 60 to 64 Years | 38 (4.2%) | 79 (9.3%) |
| 65 to 69 Years | 90 (9.9%) | 60 (7.0%) |
| 70 to 74 Years | 36 (4.0%) | 44 (5.2%) |
| 75 to 79 Years | 16 (1.8%) | 12 (1.4%) |
| 80 to 84 Years | 19 (2.1%) | 32 (3.8%) |
| 85 Years and over | 9 (1.0%) | 0 (0.0%) |
| Total | 912 (100.0%) | 852 (100.0%) |
Families and Households in Elizabeth Lake
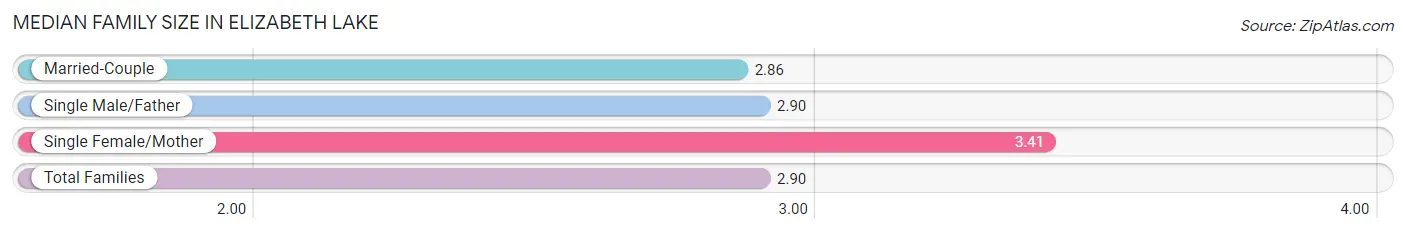
Median Family Size in Elizabeth Lake
The median family size in Elizabeth Lake is 2.90 persons per family, with single female/mother families (32 | 6.8%) accounting for the largest median family size of 3.41 persons per family. On the other hand, married-couple families (363 | 76.7%) represent the smallest median family size with 2.86 persons per family.
| Family Type | # Families | Family Size |
| Married-Couple | 363 (76.7%) | 2.86 |
| Single Male/Father | 78 (16.5%) | 2.90 |
| Single Female/Mother | 32 (6.8%) | 3.41 |
| Total Families | 473 (100.0%) | 2.90 |
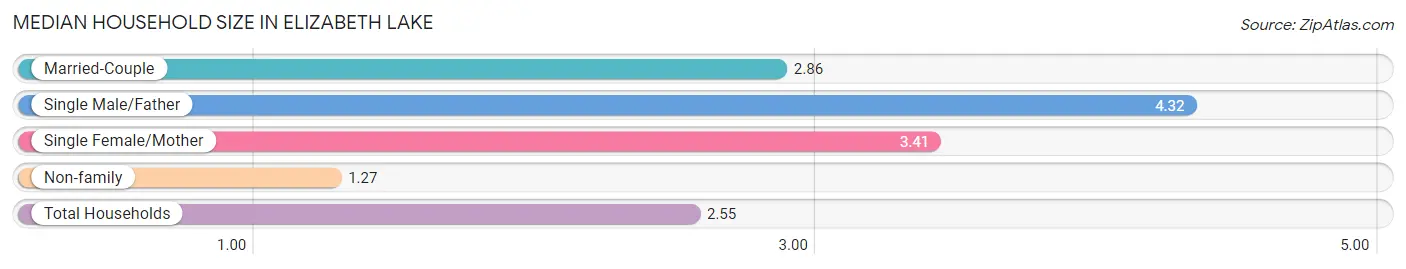
Median Household Size in Elizabeth Lake
The median household size in Elizabeth Lake is 2.55 persons per household, with single male/father households (78 | 11.3%) accounting for the largest median household size of 4.32 persons per household. non-family households (220 | 31.8%) represent the smallest median household size with 1.27 persons per household.
| Household Type | # Households | Household Size |
| Married-Couple | 363 (52.4%) | 2.86 |
| Single Male/Father | 78 (11.3%) | 4.32 |
| Single Female/Mother | 32 (4.6%) | 3.41 |
| Non-family | 220 (31.8%) | 1.27 |
| Total Households | 693 (100.0%) | 2.55 |
Household Size by Marriage Status in Elizabeth Lake
Out of a total of 693 households in Elizabeth Lake, 473 (68.2%) are family households, while 220 (31.8%) are nonfamily households. The most numerous type of family households are 2-person households, comprising 240, and the most common type of nonfamily households are 1-person households, comprising 162.
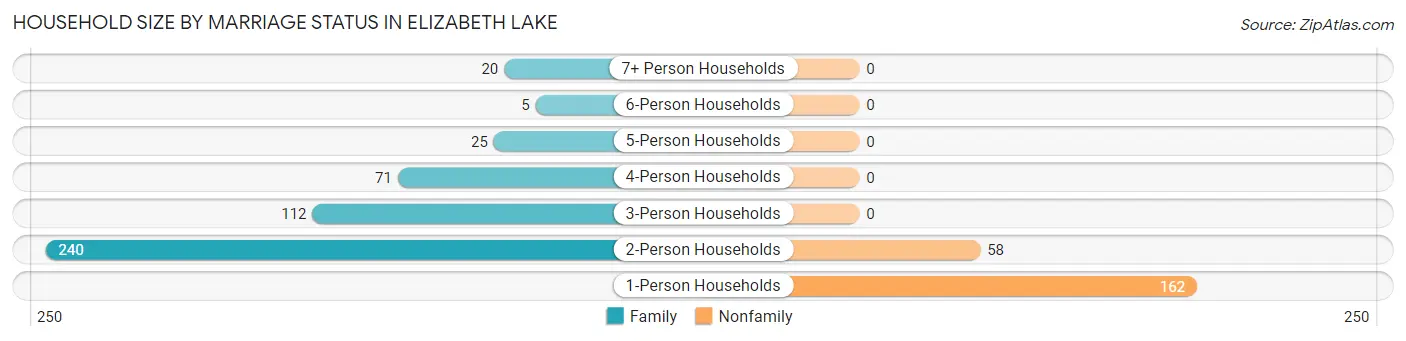
| Household Size | Family Households | Nonfamily Households |
| 1-Person Households | - | 162 (23.4%) |
| 2-Person Households | 240 (34.6%) | 58 (8.4%) |
| 3-Person Households | 112 (16.2%) | 0 (0.0%) |
| 4-Person Households | 71 (10.2%) | 0 (0.0%) |
| 5-Person Households | 25 (3.6%) | 0 (0.0%) |
| 6-Person Households | 5 (0.7%) | 0 (0.0%) |
| 7+ Person Households | 20 (2.9%) | 0 (0.0%) |
| Total | 473 (68.2%) | 220 (31.8%) |
Female Fertility in Elizabeth Lake
Fertility by Age in Elizabeth Lake
Average fertility rate in Elizabeth Lake is 21.0 births per 1,000 women. Women in the age bracket of 20 to 34 years have the highest fertility rate with 48.0 births per 1,000 women. Women in the age bracket of 20 to 34 years acount for 100.0% of all women with births.
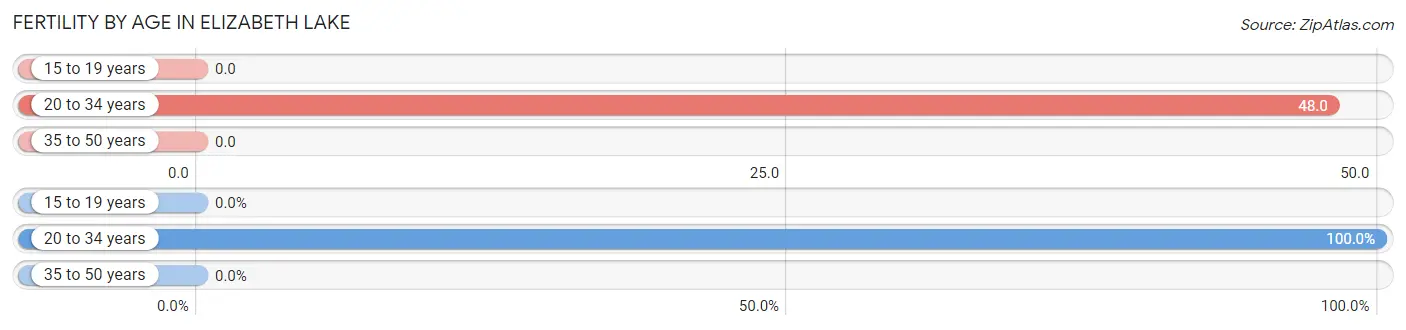
| Age Bracket | Women with Births | Births / 1,000 Women |
| 15 to 19 years | 0 (0.0%) | 0.0 |
| 20 to 34 years | 9 (100.0%) | 48.0 |
| 35 to 50 years | 0 (0.0%) | 0.0 |
| Total | 9 (100.0%) | 21.0 |
Fertility by Age by Marriage Status in Elizabeth Lake
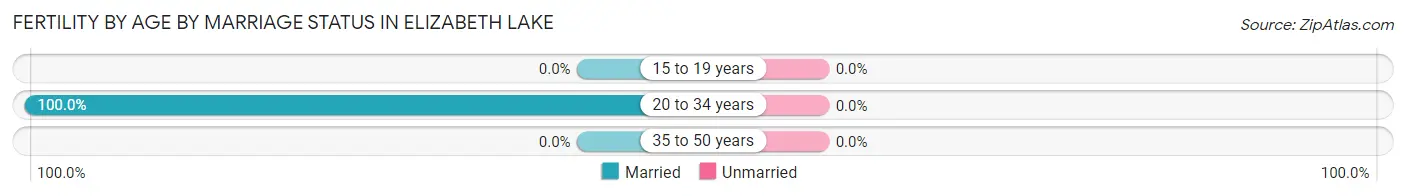
| Age Bracket | Married | Unmarried |
| 15 to 19 years | 0 (0.0%) | 0 (0.0%) |
| 20 to 34 years | 9 (100.0%) | 0 (0.0%) |
| 35 to 50 years | 0 (0.0%) | 0 (0.0%) |
| Total | 9 (100.0%) | 0 (0.0%) |
Fertility by Education in Elizabeth Lake
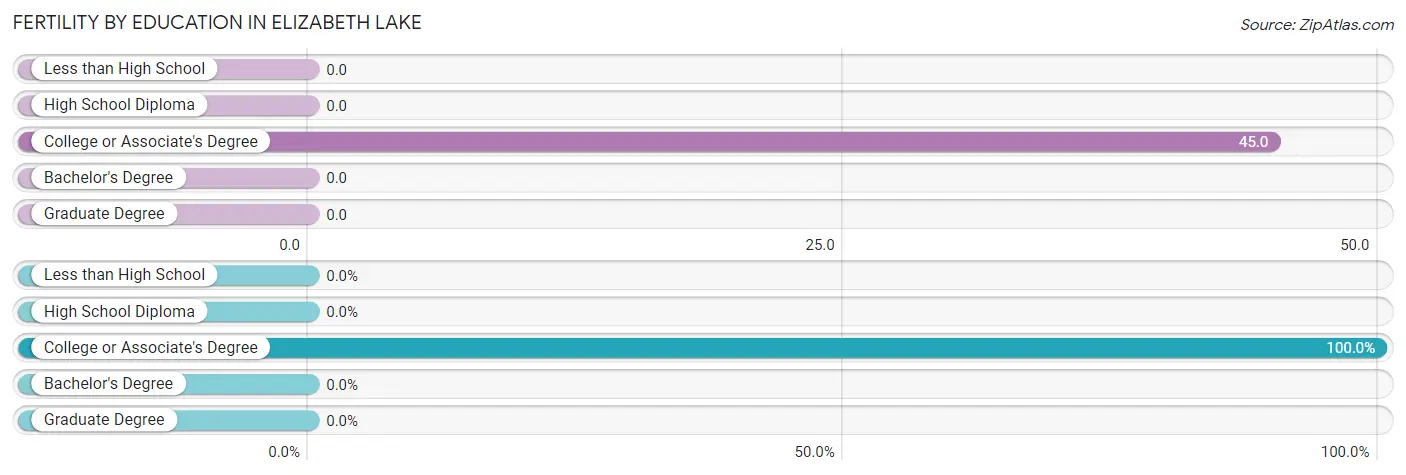
| Educational Attainment | Women with Births | Births / 1,000 Women |
| Less than High School | 0 (0.0%) | 0.0 |
| High School Diploma | 0 (0.0%) | 0.0 |
| College or Associate's Degree | 9 (100.0%) | 45.0 |
| Bachelor's Degree | 0 (0.0%) | 0.0 |
| Graduate Degree | 0 (0.0%) | 0.0 |
| Total | 9 (100.0%) | 21.0 |
Fertility by Education by Marriage Status in Elizabeth Lake
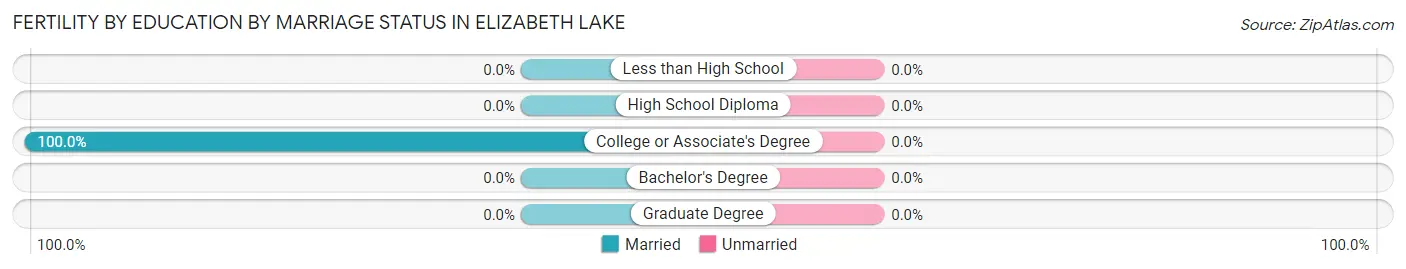
| Educational Attainment | Married | Unmarried |
| Less than High School | 0 (0.0%) | 0 (0.0%) |
| High School Diploma | 0 (0.0%) | 0 (0.0%) |
| College or Associate's Degree | 9 (100.0%) | 0 (0.0%) |
| Bachelor's Degree | 0 (0.0%) | 0 (0.0%) |
| Graduate Degree | 0 (0.0%) | 0 (0.0%) |
| Total | 9 (100.0%) | 0 (0.0%) |
Employment Characteristics in Elizabeth Lake
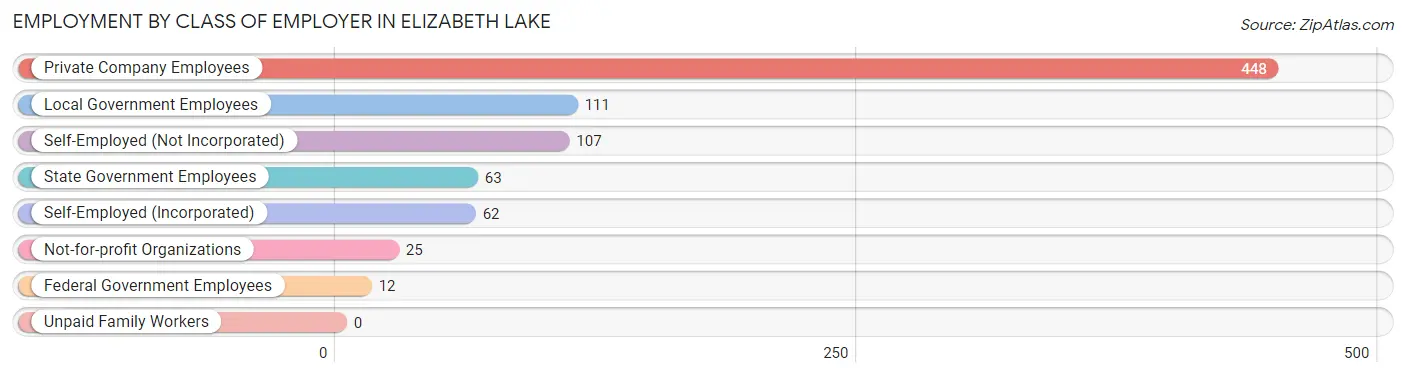
Employment by Class of Employer in Elizabeth Lake
Among the 828 employed individuals in Elizabeth Lake, private company employees (448 | 54.1%), local government employees (111 | 13.4%), and self-employed (not incorporated) (107 | 12.9%) make up the most common classes of employment.
| Employer Class | # Employees | % Employees |
| Private Company Employees | 448 | 54.1% |
| Self-Employed (Incorporated) | 62 | 7.5% |
| Self-Employed (Not Incorporated) | 107 | 12.9% |
| Not-for-profit Organizations | 25 | 3.0% |
| Local Government Employees | 111 | 13.4% |
| State Government Employees | 63 | 7.6% |
| Federal Government Employees | 12 | 1.5% |
| Unpaid Family Workers | 0 | 0.0% |
| Total | 828 | 100.0% |
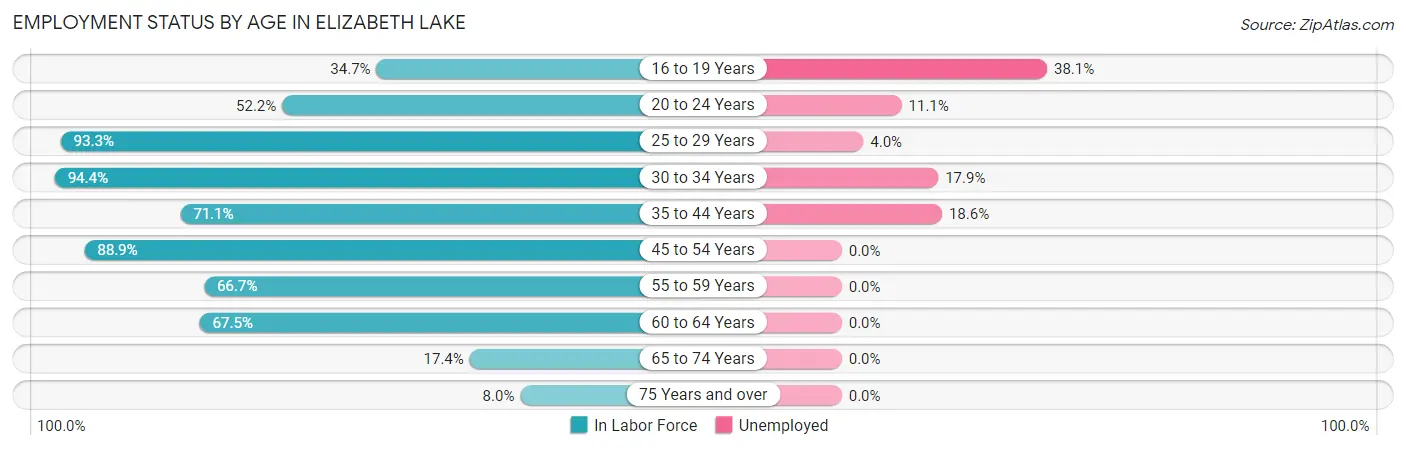
Employment Status by Age in Elizabeth Lake
According to the labor force statistics for Elizabeth Lake, out of the total population over 16 years of age (1,535), 63.3% or 972 individuals are in the labor force, with 8.7% or 85 of them unemployed. The age group with the highest labor force participation rate is 30 to 34 years, with 94.4% or 184 individuals in the labor force. Within the labor force, the 16 to 19 years age range has the highest percentage of unemployed individuals, with 38.1% or 16 of them being unemployed.
| Age Bracket | In Labor Force | Unemployed |
| 16 to 19 Years | 42 (34.7%) | 16 (38.1%) |
| 20 to 24 Years | 36 (52.2%) | 4 (11.1%) |
| 25 to 29 Years | 126 (93.3%) | 5 (4.0%) |
| 30 to 34 Years | 184 (94.4%) | 33 (17.9%) |
| 35 to 44 Years | 145 (71.1%) | 27 (18.6%) |
| 45 to 54 Years | 249 (88.9%) | 0 (0.0%) |
| 55 to 59 Years | 64 (66.7%) | 0 (0.0%) |
| 60 to 64 Years | 79 (67.5%) | 0 (0.0%) |
| 65 to 74 Years | 40 (17.4%) | 0 (0.0%) |
| 75 Years and over | 7 (8.0%) | 0 (0.0%) |
| Total | 972 (63.3%) | 85 (8.7%) |
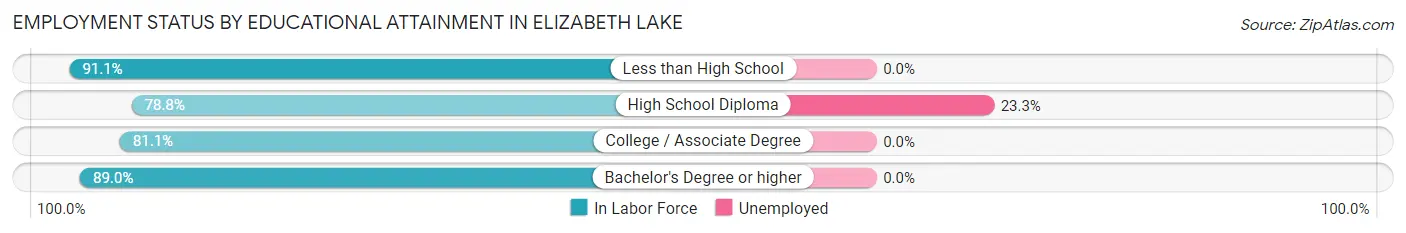
Employment Status by Educational Attainment in Elizabeth Lake
According to labor force statistics for Elizabeth Lake, 82.5% of individuals (847) out of the total population between 25 and 64 years of age (1,027) are in the labor force, with 7.7% or 65 of them being unemployed. The group with the highest labor force participation rate are those with the educational attainment of less than high school, with 91.1% or 51 individuals in the labor force. Within the labor force, individuals with high school diploma education have the highest percentage of unemployment, with 23.3% or 65 of them being unemployed.
| Educational Attainment | In Labor Force | Unemployed |
| Less than High School | 51 (91.1%) | 0 (0.0%) |
| High School Diploma | 279 (78.8%) | 82 (23.3%) |
| College / Associate Degree | 330 (81.1%) | 0 (0.0%) |
| Bachelor's Degree or higher | 187 (89.0%) | 0 (0.0%) |
| Total | 847 (82.5%) | 79 (7.7%) |
Employment Occupations by Sex in Elizabeth Lake
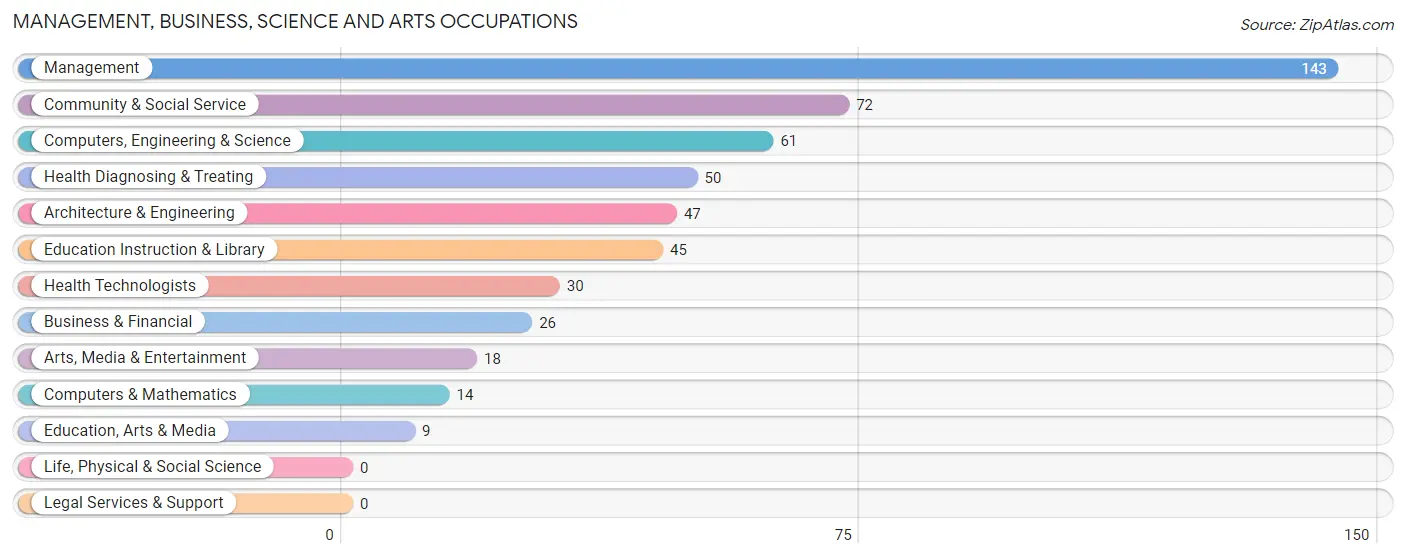
Management, Business, Science and Arts Occupations
The most common Management, Business, Science and Arts occupations in Elizabeth Lake are Management (143 | 16.1%), Community & Social Service (72 | 8.1%), Computers, Engineering & Science (61 | 6.9%), Health Diagnosing & Treating (50 | 5.6%), and Architecture & Engineering (47 | 5.3%).
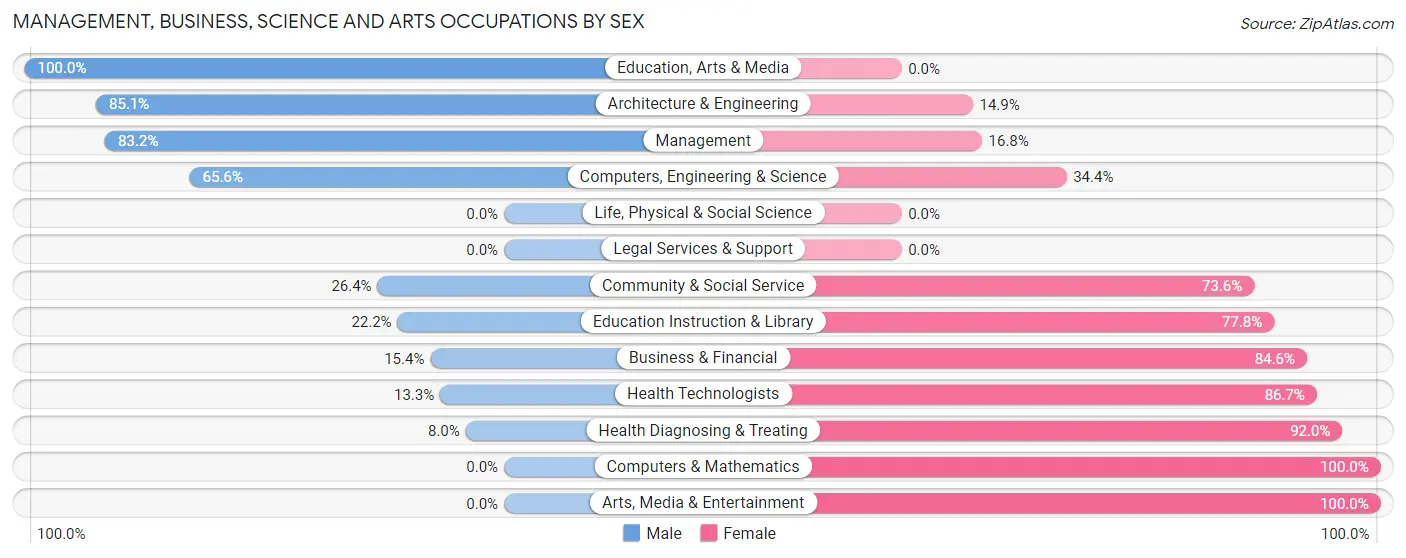
Management, Business, Science and Arts Occupations by Sex
Within the Management, Business, Science and Arts occupations in Elizabeth Lake, the most male-oriented occupations are Education, Arts & Media (100.0%), Architecture & Engineering (85.1%), and Management (83.2%), while the most female-oriented occupations are Computers & Mathematics (100.0%), Arts, Media & Entertainment (100.0%), and Health Diagnosing & Treating (92.0%).
| Occupation | Male | Female |
| Management | 119 (83.2%) | 24 (16.8%) |
| Business & Financial | 4 (15.4%) | 22 (84.6%) |
| Computers, Engineering & Science | 40 (65.6%) | 21 (34.4%) |
| Computers & Mathematics | 0 (0.0%) | 14 (100.0%) |
| Architecture & Engineering | 40 (85.1%) | 7 (14.9%) |
| Life, Physical & Social Science | 0 (0.0%) | 0 (0.0%) |
| Community & Social Service | 19 (26.4%) | 53 (73.6%) |
| Education, Arts & Media | 9 (100.0%) | 0 (0.0%) |
| Legal Services & Support | 0 (0.0%) | 0 (0.0%) |
| Education Instruction & Library | 10 (22.2%) | 35 (77.8%) |
| Arts, Media & Entertainment | 0 (0.0%) | 18 (100.0%) |
| Health Diagnosing & Treating | 4 (8.0%) | 46 (92.0%) |
| Health Technologists | 4 (13.3%) | 26 (86.7%) |
| Total (Category) | 186 (52.8%) | 166 (47.2%) |
| Total (Overall) | 517 (58.3%) | 370 (41.7%) |
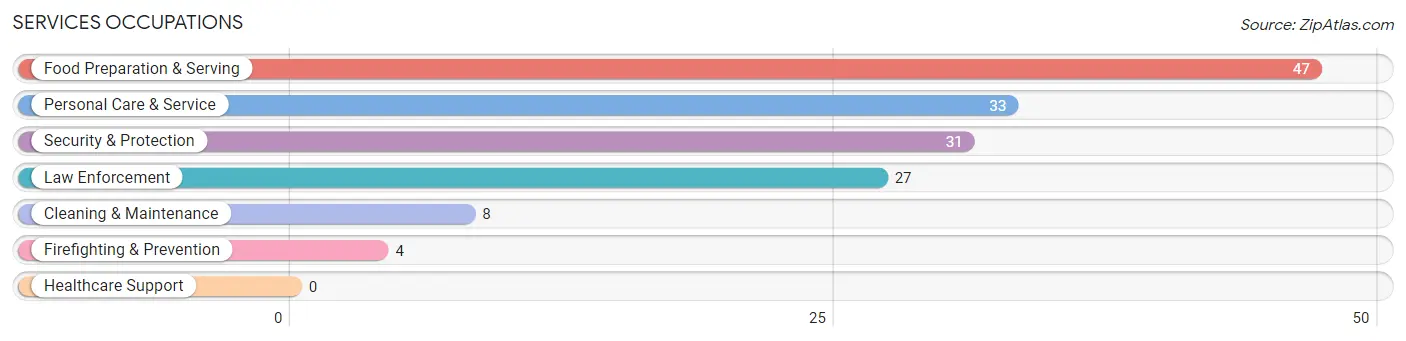
Services Occupations
The most common Services occupations in Elizabeth Lake are Food Preparation & Serving (47 | 5.3%), Personal Care & Service (33 | 3.7%), Security & Protection (31 | 3.5%), Law Enforcement (27 | 3.0%), and Cleaning & Maintenance (8 | 0.9%).
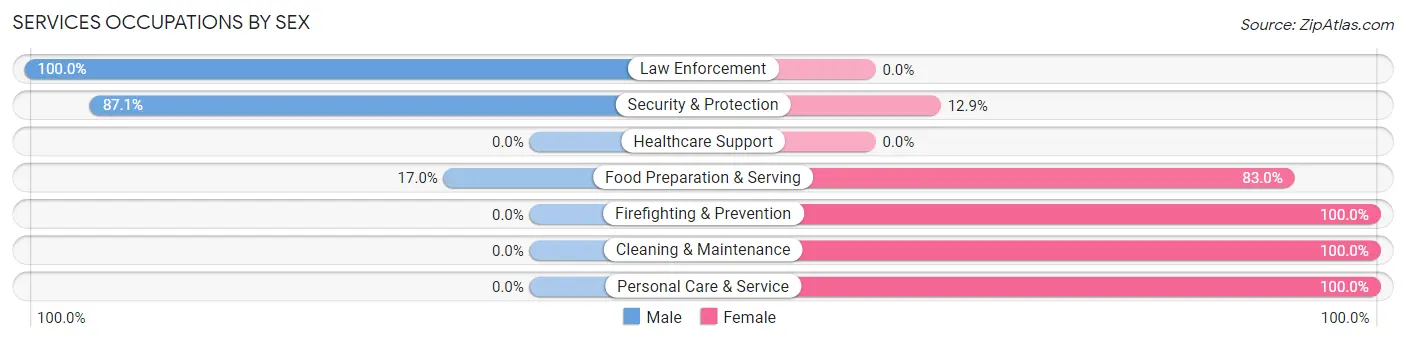
Services Occupations by Sex
Within the Services occupations in Elizabeth Lake, the most male-oriented occupations are Law Enforcement (100.0%), Security & Protection (87.1%), and Food Preparation & Serving (17.0%), while the most female-oriented occupations are Firefighting & Prevention (100.0%), Cleaning & Maintenance (100.0%), and Personal Care & Service (100.0%).
| Occupation | Male | Female |
| Healthcare Support | 0 (0.0%) | 0 (0.0%) |
| Security & Protection | 27 (87.1%) | 4 (12.9%) |
| Firefighting & Prevention | 0 (0.0%) | 4 (100.0%) |
| Law Enforcement | 27 (100.0%) | 0 (0.0%) |
| Food Preparation & Serving | 8 (17.0%) | 39 (83.0%) |
| Cleaning & Maintenance | 0 (0.0%) | 8 (100.0%) |
| Personal Care & Service | 0 (0.0%) | 33 (100.0%) |
| Total (Category) | 35 (29.4%) | 84 (70.6%) |
| Total (Overall) | 517 (58.3%) | 370 (41.7%) |
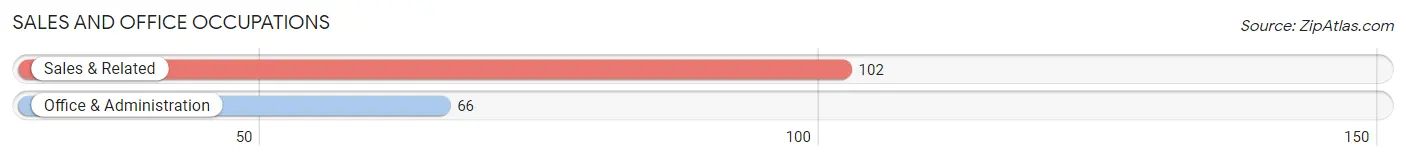
Sales and Office Occupations
The most common Sales and Office occupations in Elizabeth Lake are Sales & Related (102 | 11.5%), and Office & Administration (66 | 7.4%).
Sales and Office Occupations by Sex
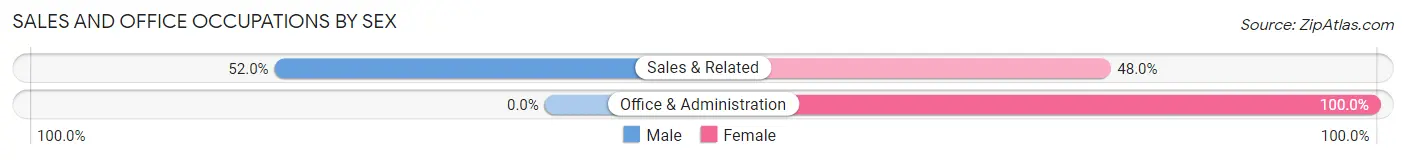
| Occupation | Male | Female |
| Sales & Related | 53 (52.0%) | 49 (48.0%) |
| Office & Administration | 0 (0.0%) | 66 (100.0%) |
| Total (Category) | 53 (31.6%) | 115 (68.4%) |
| Total (Overall) | 517 (58.3%) | 370 (41.7%) |
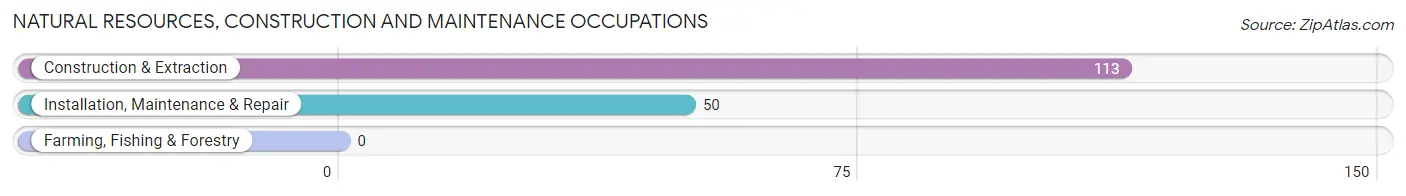
Natural Resources, Construction and Maintenance Occupations
The most common Natural Resources, Construction and Maintenance occupations in Elizabeth Lake are Construction & Extraction (113 | 12.7%), and Installation, Maintenance & Repair (50 | 5.6%).
Natural Resources, Construction and Maintenance Occupations by Sex
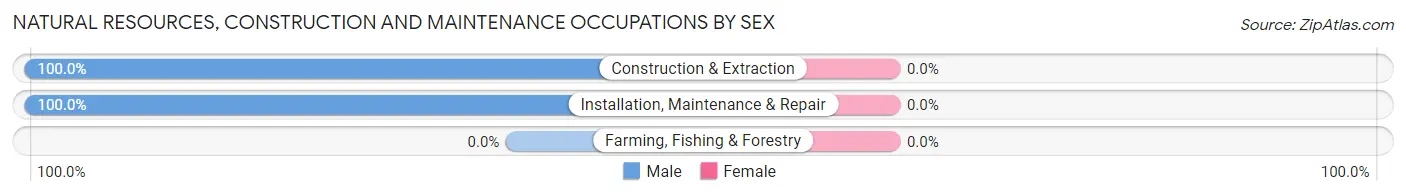
| Occupation | Male | Female |
| Farming, Fishing & Forestry | 0 (0.0%) | 0 (0.0%) |
| Construction & Extraction | 113 (100.0%) | 0 (0.0%) |
| Installation, Maintenance & Repair | 50 (100.0%) | 0 (0.0%) |
| Total (Category) | 163 (100.0%) | 0 (0.0%) |
| Total (Overall) | 517 (58.3%) | 370 (41.7%) |
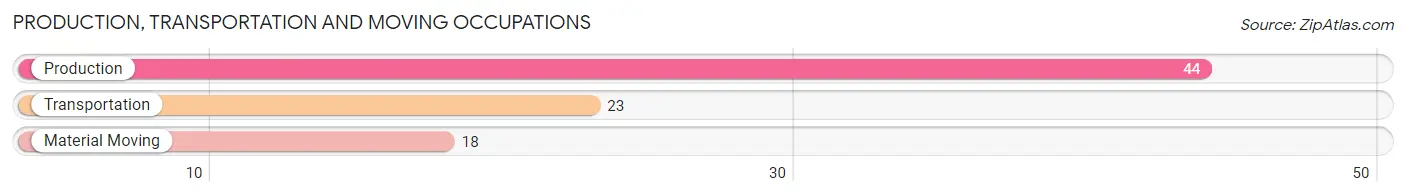
Production, Transportation and Moving Occupations
The most common Production, Transportation and Moving occupations in Elizabeth Lake are Production (44 | 5.0%), Transportation (23 | 2.6%), and Material Moving (18 | 2.0%).
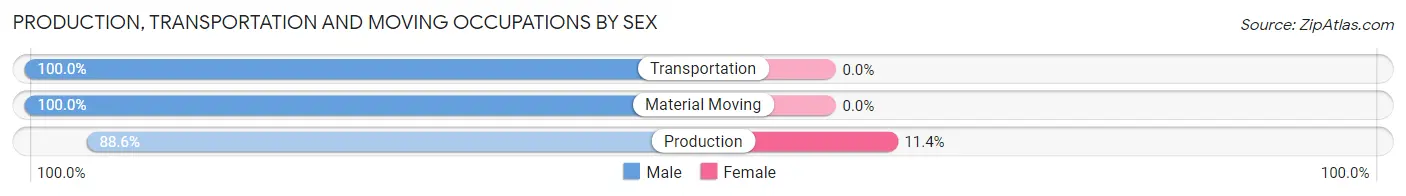
Production, Transportation and Moving Occupations by Sex
| Occupation | Male | Female |
| Production | 39 (88.6%) | 5 (11.4%) |
| Transportation | 23 (100.0%) | 0 (0.0%) |
| Material Moving | 18 (100.0%) | 0 (0.0%) |
| Total (Category) | 80 (94.1%) | 5 (5.9%) |
| Total (Overall) | 517 (58.3%) | 370 (41.7%) |
Employment Industries by Sex in Elizabeth Lake
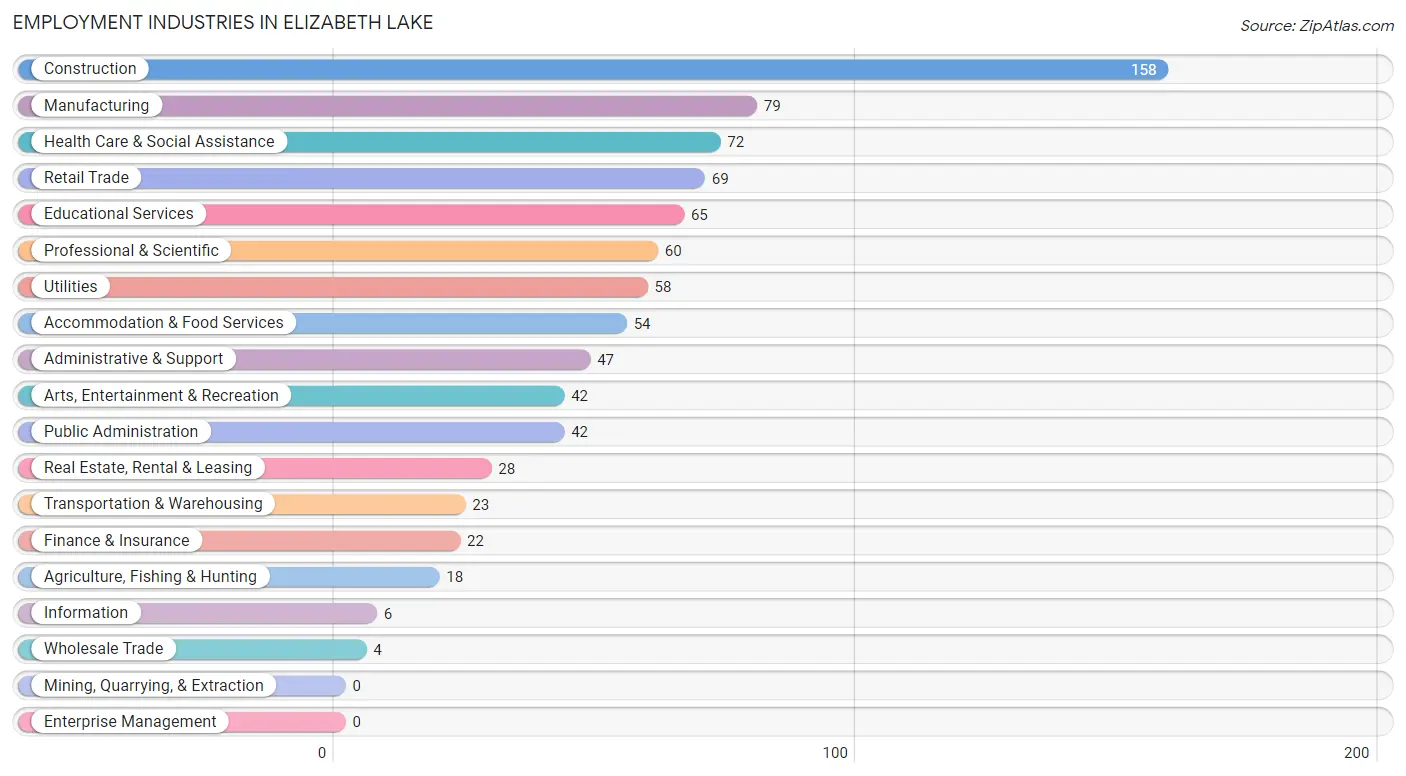
Employment Industries in Elizabeth Lake
The major employment industries in Elizabeth Lake include Construction (158 | 17.8%), Manufacturing (79 | 8.9%), Health Care & Social Assistance (72 | 8.1%), Retail Trade (69 | 7.8%), and Educational Services (65 | 7.3%).
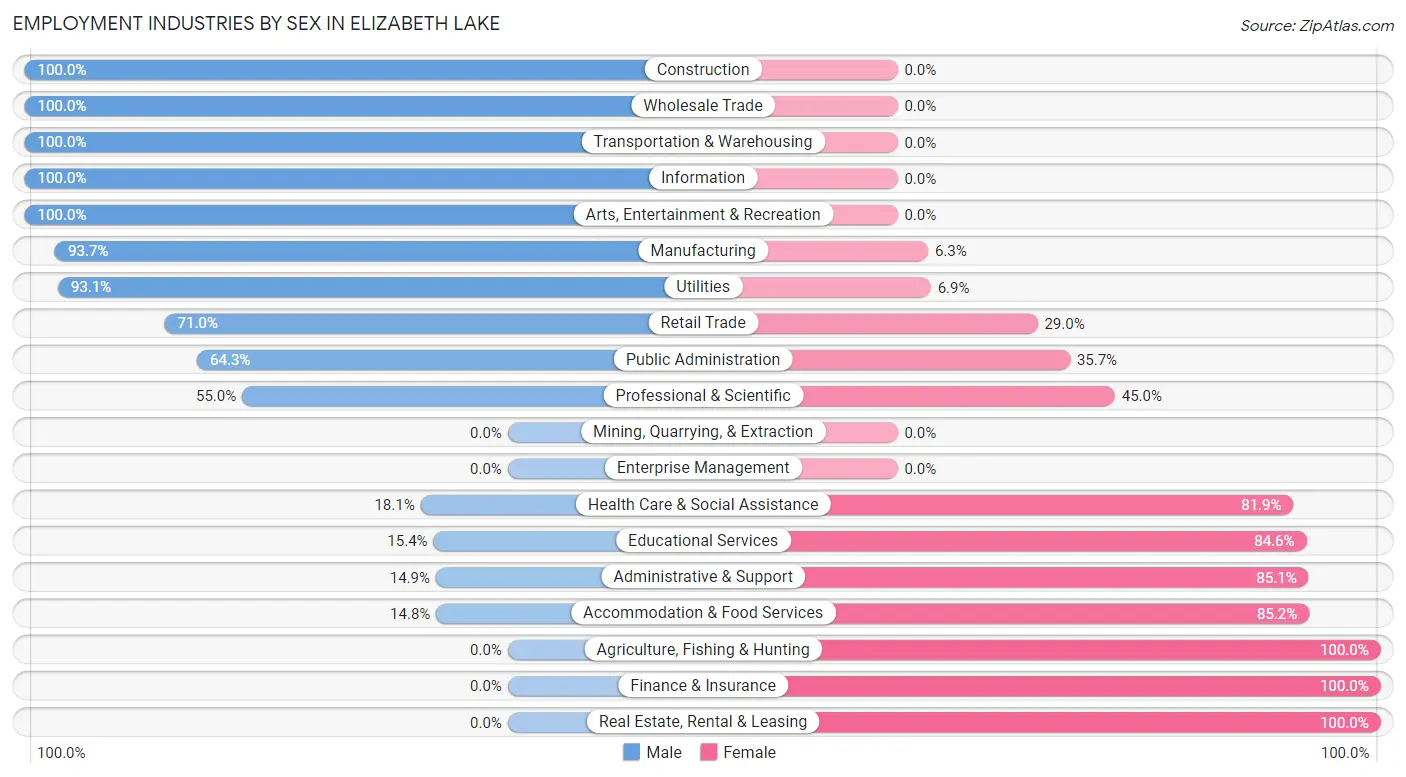
Employment Industries by Sex in Elizabeth Lake
The Elizabeth Lake industries that see more men than women are Construction (100.0%), Wholesale Trade (100.0%), and Transportation & Warehousing (100.0%), whereas the industries that tend to have a higher number of women are Agriculture, Fishing & Hunting (100.0%), Finance & Insurance (100.0%), and Real Estate, Rental & Leasing (100.0%).
| Industry | Male | Female |
| Agriculture, Fishing & Hunting | 0 (0.0%) | 18 (100.0%) |
| Mining, Quarrying, & Extraction | 0 (0.0%) | 0 (0.0%) |
| Construction | 158 (100.0%) | 0 (0.0%) |
| Manufacturing | 74 (93.7%) | 5 (6.3%) |
| Wholesale Trade | 4 (100.0%) | 0 (0.0%) |
| Retail Trade | 49 (71.0%) | 20 (29.0%) |
| Transportation & Warehousing | 23 (100.0%) | 0 (0.0%) |
| Utilities | 54 (93.1%) | 4 (6.9%) |
| Information | 6 (100.0%) | 0 (0.0%) |
| Finance & Insurance | 0 (0.0%) | 22 (100.0%) |
| Real Estate, Rental & Leasing | 0 (0.0%) | 28 (100.0%) |
| Professional & Scientific | 33 (55.0%) | 27 (45.0%) |
| Enterprise Management | 0 (0.0%) | 0 (0.0%) |
| Administrative & Support | 7 (14.9%) | 40 (85.1%) |
| Educational Services | 10 (15.4%) | 55 (84.6%) |
| Health Care & Social Assistance | 13 (18.1%) | 59 (81.9%) |
| Arts, Entertainment & Recreation | 42 (100.0%) | 0 (0.0%) |
| Accommodation & Food Services | 8 (14.8%) | 46 (85.2%) |
| Public Administration | 27 (64.3%) | 15 (35.7%) |
| Total | 517 (58.3%) | 370 (41.7%) |
Education in Elizabeth Lake
School Enrollment in Elizabeth Lake
The most common levels of schooling among the 315 students in Elizabeth Lake are college / undergraduate (143 | 45.4%), high school (65 | 20.6%), and elementary school (58 | 18.4%).
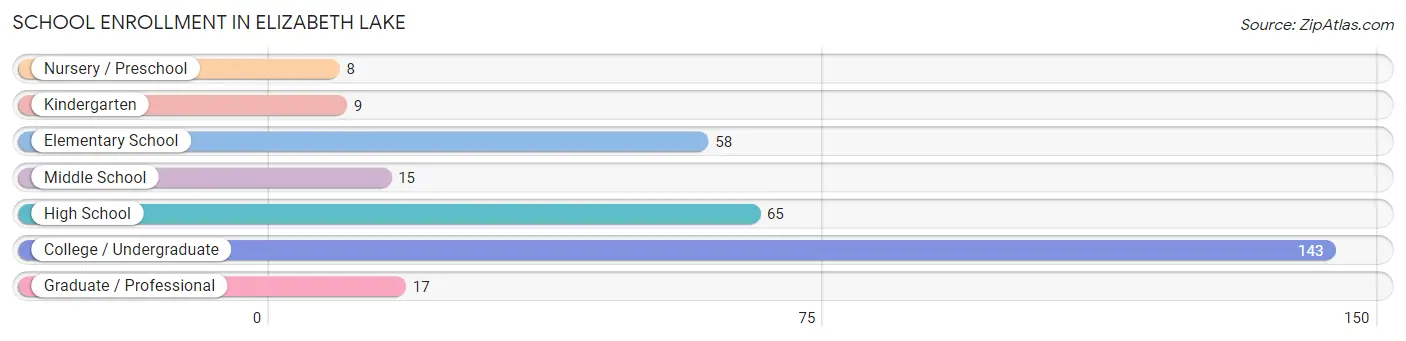
| School Level | # Students | % Students |
| Nursery / Preschool | 8 | 2.5% |
| Kindergarten | 9 | 2.9% |
| Elementary School | 58 | 18.4% |
| Middle School | 15 | 4.8% |
| High School | 65 | 20.6% |
| College / Undergraduate | 143 | 45.4% |
| Graduate / Professional | 17 | 5.4% |
| Total | 315 | 100.0% |
School Enrollment by Age by Funding Source in Elizabeth Lake
Out of a total of 315 students who are enrolled in schools in Elizabeth Lake, 62 (19.7%) attend a private institution, while the remaining 253 (80.3%) are enrolled in public schools. The age group of 15 to 17 year olds has the highest likelihood of being enrolled in private schools, with 19 (31.1% in the age bracket) enrolled. Conversely, the age group of 10 to 14 year olds has the lowest likelihood of being enrolled in a private school, with 25 (100.0% in the age bracket) attending a public institution.
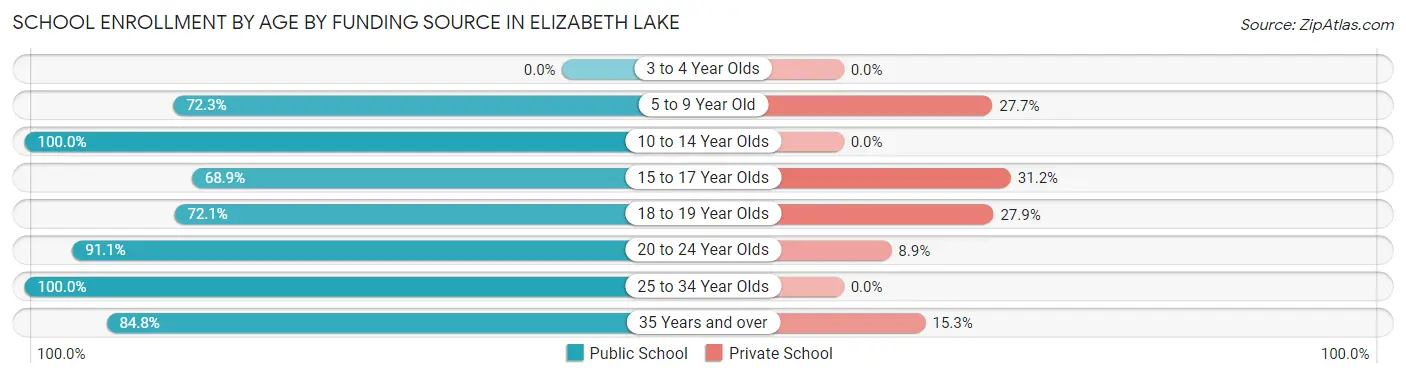
| Age Bracket | Public School | Private School |
| 3 to 4 Year Olds | 0 (0.0%) | 0 (0.0%) |
| 5 to 9 Year Old | 47 (72.3%) | 18 (27.7%) |
| 10 to 14 Year Olds | 25 (100.0%) | 0 (0.0%) |
| 15 to 17 Year Olds | 42 (68.9%) | 19 (31.1%) |
| 18 to 19 Year Olds | 31 (72.1%) | 12 (27.9%) |
| 20 to 24 Year Olds | 41 (91.1%) | 4 (8.9%) |
| 25 to 34 Year Olds | 17 (100.0%) | 0 (0.0%) |
| 35 Years and over | 50 (84.8%) | 9 (15.2%) |
| Total | 253 (80.3%) | 62 (19.7%) |
Educational Attainment by Field of Study in Elizabeth Lake
Science & technology (61 | 18.5%), business (58 | 17.6%), social sciences (51 | 15.5%), liberal arts & history (30 | 9.1%), and arts & humanities (27 | 8.2%) are the most common fields of study among 329 individuals in Elizabeth Lake who have obtained a bachelor's degree or higher.
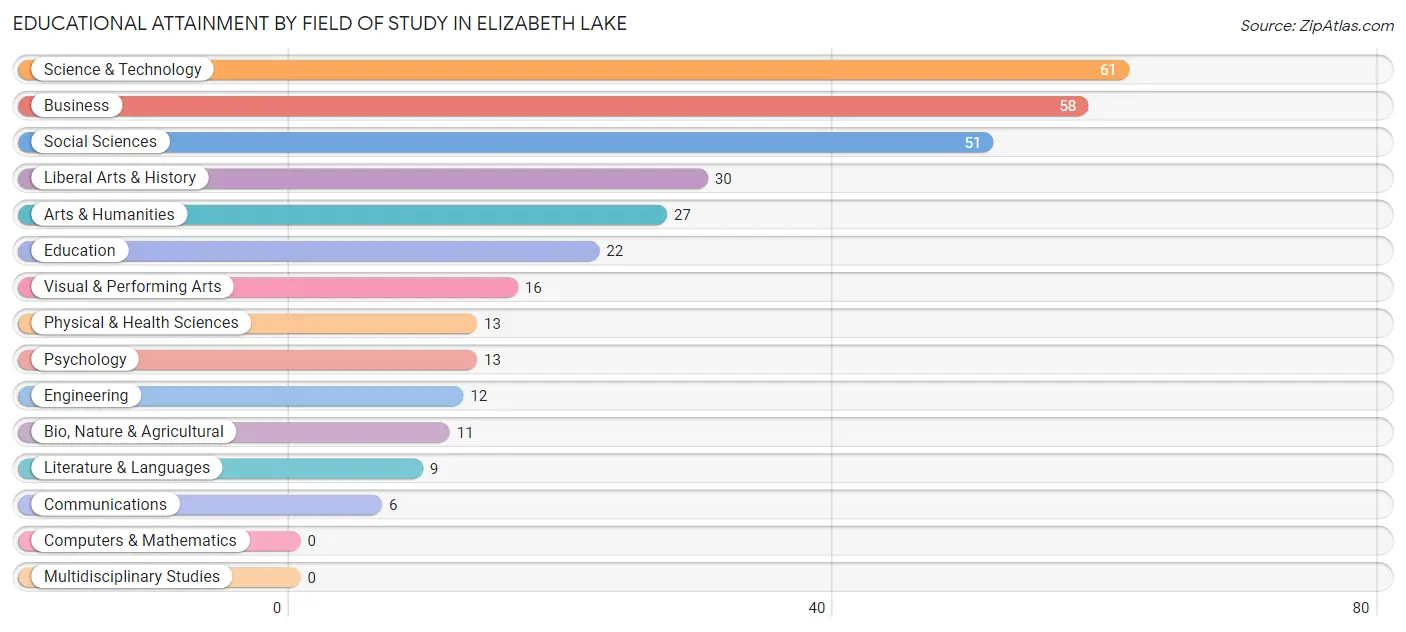
| Field of Study | # Graduates | % Graduates |
| Computers & Mathematics | 0 | 0.0% |
| Bio, Nature & Agricultural | 11 | 3.3% |
| Physical & Health Sciences | 13 | 4.0% |
| Psychology | 13 | 4.0% |
| Social Sciences | 51 | 15.5% |
| Engineering | 12 | 3.6% |
| Multidisciplinary Studies | 0 | 0.0% |
| Science & Technology | 61 | 18.5% |
| Business | 58 | 17.6% |
| Education | 22 | 6.7% |
| Literature & Languages | 9 | 2.7% |
| Liberal Arts & History | 30 | 9.1% |
| Visual & Performing Arts | 16 | 4.9% |
| Communications | 6 | 1.8% |
| Arts & Humanities | 27 | 8.2% |
| Total | 329 | 100.0% |
Transportation & Commute in Elizabeth Lake
Vehicle Availability by Sex in Elizabeth Lake
The most prevalent vehicle ownership categories in Elizabeth Lake are males with 2 vehicles (175, accounting for 34.8%) and females with 2 vehicles (126, making up 53.8%).
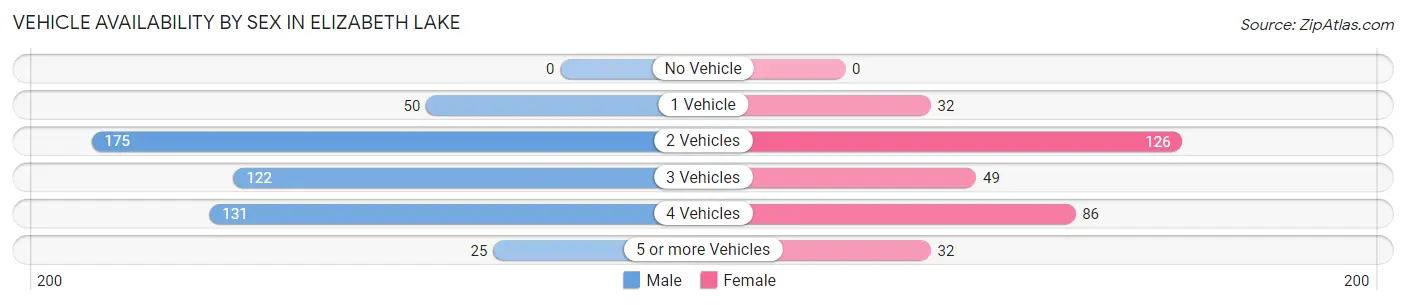
| Vehicles Available | Male | Female |
| No Vehicle | 0 (0.0%) | 0 (0.0%) |
| 1 Vehicle | 50 (9.9%) | 32 (9.9%) |
| 2 Vehicles | 175 (34.8%) | 126 (38.8%) |
| 3 Vehicles | 122 (24.2%) | 49 (15.1%) |
| 4 Vehicles | 131 (26.0%) | 86 (26.5%) |
| 5 or more Vehicles | 25 (5.0%) | 32 (9.9%) |
| Total | 503 (100.0%) | 325 (100.0%) |
Commute Time in Elizabeth Lake
The most frequently occuring commute durations in Elizabeth Lake are 60 to 89 minutes (205 commuters, 28.0%), 45 to 59 minutes (153 commuters, 20.9%), and 30 to 34 minutes (121 commuters, 16.5%).
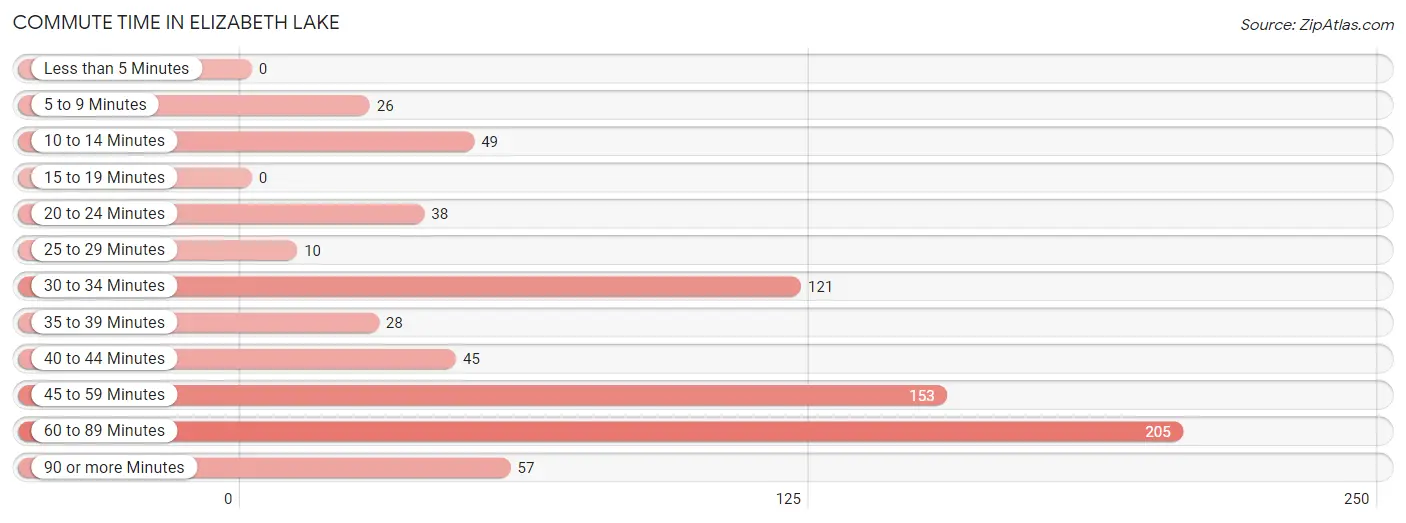
| Commute Time | # Commuters | % Commuters |
| Less than 5 Minutes | 0 | 0.0% |
| 5 to 9 Minutes | 26 | 3.5% |
| 10 to 14 Minutes | 49 | 6.7% |
| 15 to 19 Minutes | 0 | 0.0% |
| 20 to 24 Minutes | 38 | 5.2% |
| 25 to 29 Minutes | 10 | 1.4% |
| 30 to 34 Minutes | 121 | 16.5% |
| 35 to 39 Minutes | 28 | 3.8% |
| 40 to 44 Minutes | 45 | 6.1% |
| 45 to 59 Minutes | 153 | 20.9% |
| 60 to 89 Minutes | 205 | 28.0% |
| 90 or more Minutes | 57 | 7.8% |
Commute Time by Sex in Elizabeth Lake
The most common commute times in Elizabeth Lake are 60 to 89 minutes (184 commuters, 41.9%) for males and 45 to 59 minutes (91 commuters, 31.1%) for females.
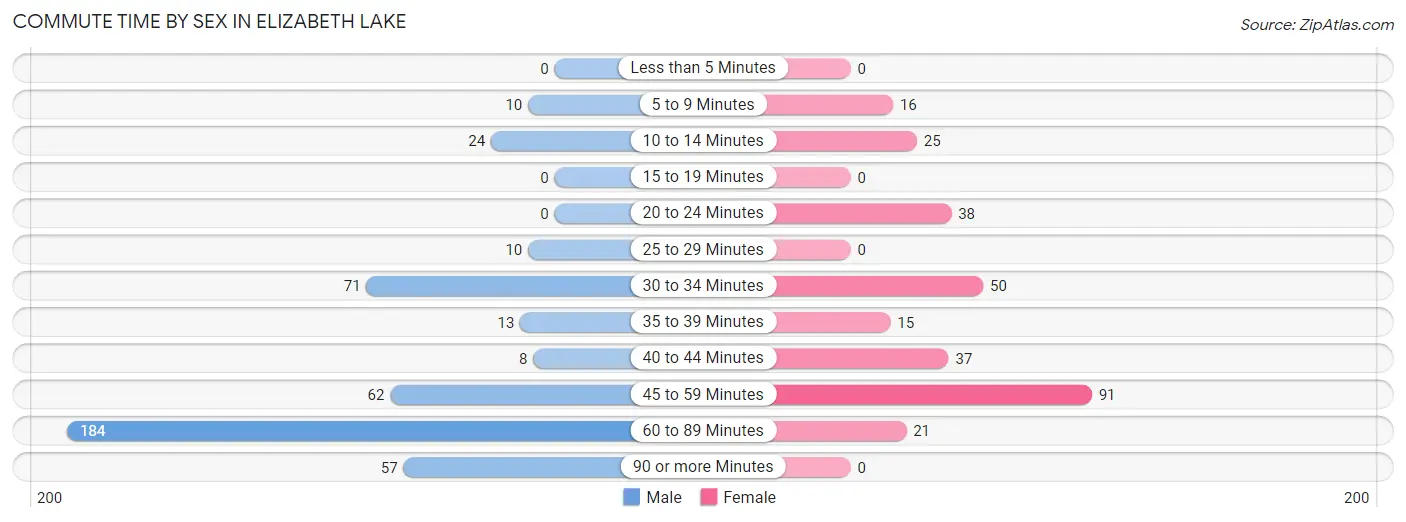
| Commute Time | Male | Female |
| Less than 5 Minutes | 0 (0.0%) | 0 (0.0%) |
| 5 to 9 Minutes | 10 (2.3%) | 16 (5.5%) |
| 10 to 14 Minutes | 24 (5.5%) | 25 (8.5%) |
| 15 to 19 Minutes | 0 (0.0%) | 0 (0.0%) |
| 20 to 24 Minutes | 0 (0.0%) | 38 (13.0%) |
| 25 to 29 Minutes | 10 (2.3%) | 0 (0.0%) |
| 30 to 34 Minutes | 71 (16.2%) | 50 (17.1%) |
| 35 to 39 Minutes | 13 (3.0%) | 15 (5.1%) |
| 40 to 44 Minutes | 8 (1.8%) | 37 (12.6%) |
| 45 to 59 Minutes | 62 (14.1%) | 91 (31.1%) |
| 60 to 89 Minutes | 184 (41.9%) | 21 (7.2%) |
| 90 or more Minutes | 57 (13.0%) | 0 (0.0%) |
Time of Departure to Work by Sex in Elizabeth Lake
The most frequent times of departure to work in Elizabeth Lake are 6:00 AM to 6:29 AM (100, 22.8%) for males and 7:00 AM to 7:29 AM (63, 21.5%) for females.
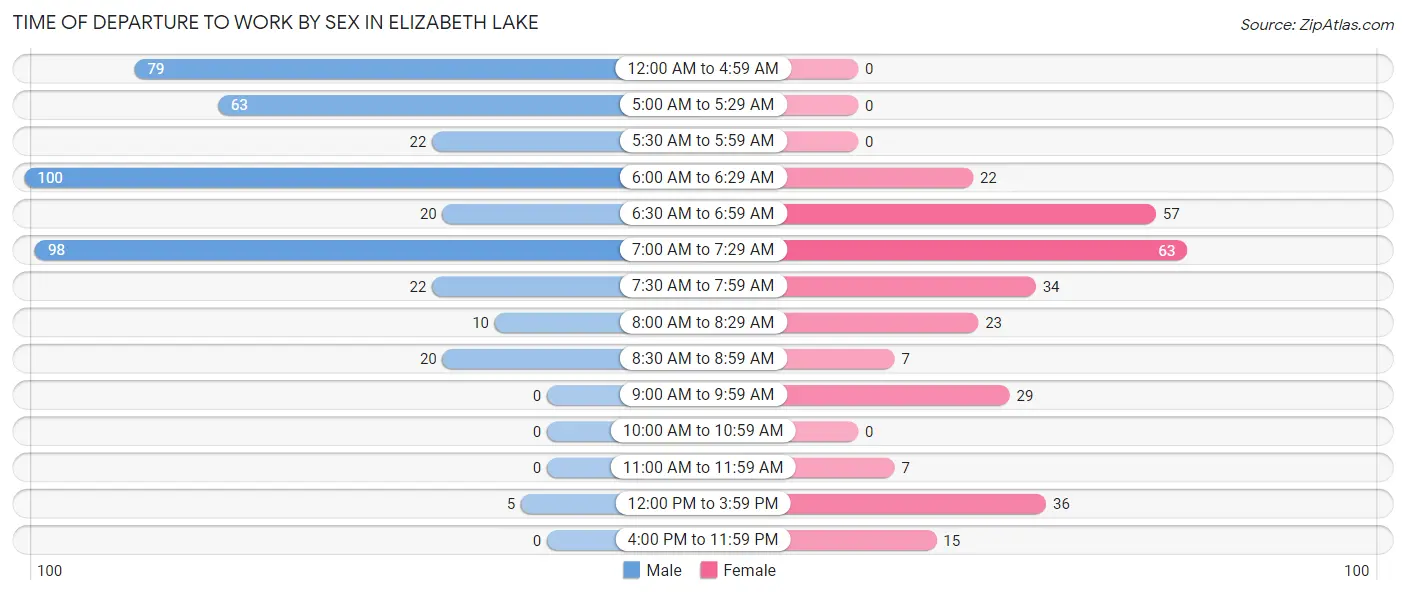
| Time of Departure | Male | Female |
| 12:00 AM to 4:59 AM | 79 (18.0%) | 0 (0.0%) |
| 5:00 AM to 5:29 AM | 63 (14.3%) | 0 (0.0%) |
| 5:30 AM to 5:59 AM | 22 (5.0%) | 0 (0.0%) |
| 6:00 AM to 6:29 AM | 100 (22.8%) | 22 (7.5%) |
| 6:30 AM to 6:59 AM | 20 (4.6%) | 57 (19.5%) |
| 7:00 AM to 7:29 AM | 98 (22.3%) | 63 (21.5%) |
| 7:30 AM to 7:59 AM | 22 (5.0%) | 34 (11.6%) |
| 8:00 AM to 8:29 AM | 10 (2.3%) | 23 (7.9%) |
| 8:30 AM to 8:59 AM | 20 (4.6%) | 7 (2.4%) |
| 9:00 AM to 9:59 AM | 0 (0.0%) | 29 (9.9%) |
| 10:00 AM to 10:59 AM | 0 (0.0%) | 0 (0.0%) |
| 11:00 AM to 11:59 AM | 0 (0.0%) | 7 (2.4%) |
| 12:00 PM to 3:59 PM | 5 (1.1%) | 36 (12.3%) |
| 4:00 PM to 11:59 PM | 0 (0.0%) | 15 (5.1%) |
| Total | 439 (100.0%) | 293 (100.0%) |
Housing Occupancy in Elizabeth Lake
Occupancy by Ownership in Elizabeth Lake
Of the total 693 dwellings in Elizabeth Lake, owner-occupied units account for 609 (87.9%), while renter-occupied units make up 84 (12.1%).
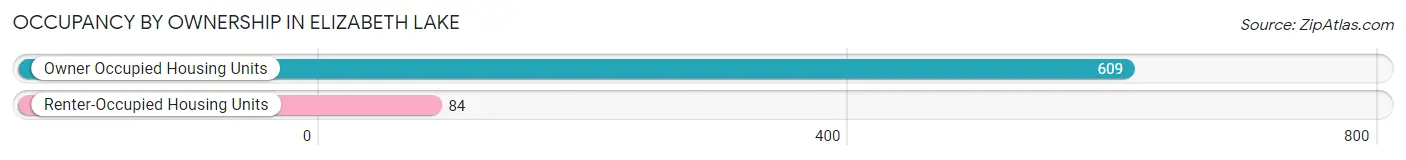
| Occupancy | # Housing Units | % Housing Units |
| Owner Occupied Housing Units | 609 | 87.9% |
| Renter-Occupied Housing Units | 84 | 12.1% |
| Total Occupied Housing Units | 693 | 100.0% |
Occupancy by Household Size in Elizabeth Lake
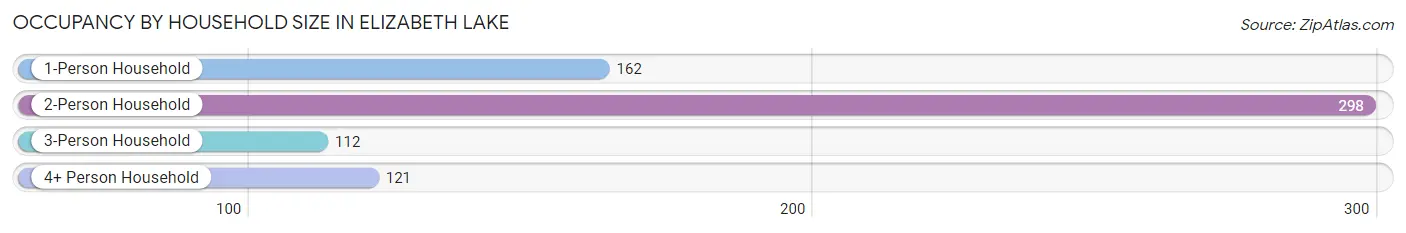
| Household Size | # Housing Units | % Housing Units |
| 1-Person Household | 162 | 23.4% |
| 2-Person Household | 298 | 43.0% |
| 3-Person Household | 112 | 16.2% |
| 4+ Person Household | 121 | 17.5% |
| Total Housing Units | 693 | 100.0% |
Occupancy by Ownership by Household Size in Elizabeth Lake
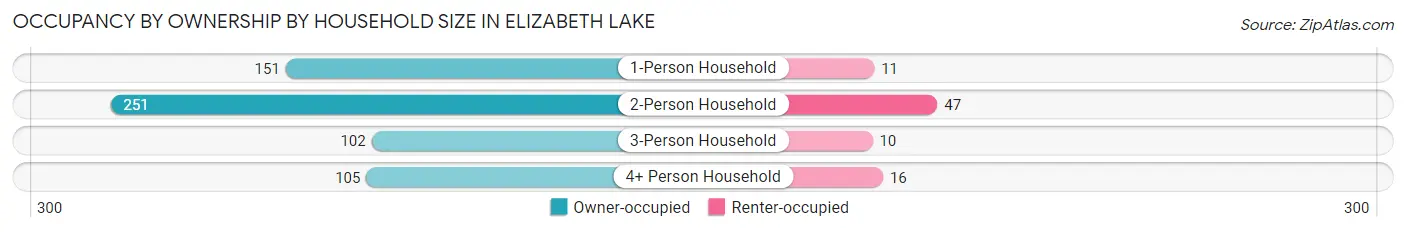
| Household Size | Owner-occupied | Renter-occupied |
| 1-Person Household | 151 (93.2%) | 11 (6.8%) |
| 2-Person Household | 251 (84.2%) | 47 (15.8%) |
| 3-Person Household | 102 (91.1%) | 10 (8.9%) |
| 4+ Person Household | 105 (86.8%) | 16 (13.2%) |
| Total Housing Units | 609 (87.9%) | 84 (12.1%) |
Occupancy by Educational Attainment in Elizabeth Lake
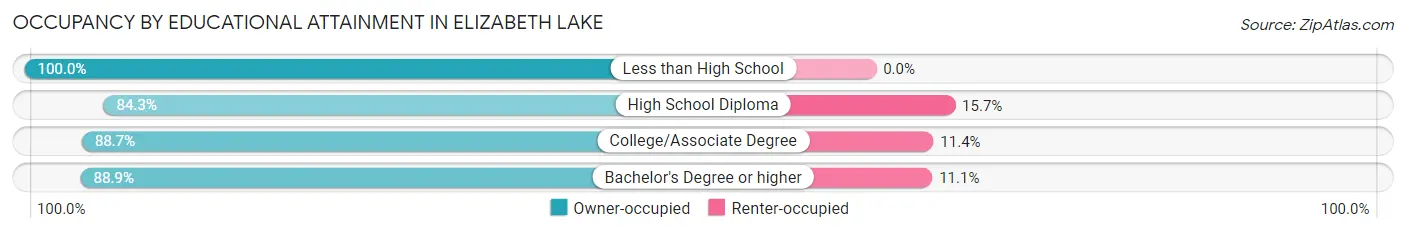
| Household Size | Owner-occupied | Renter-occupied |
| Less than High School | 24 (100.0%) | 0 (0.0%) |
| High School Diploma | 167 (84.3%) | 31 (15.7%) |
| College/Associate Degree | 250 (88.6%) | 32 (11.4%) |
| Bachelor's Degree or higher | 168 (88.9%) | 21 (11.1%) |
Occupancy by Age of Householder in Elizabeth Lake
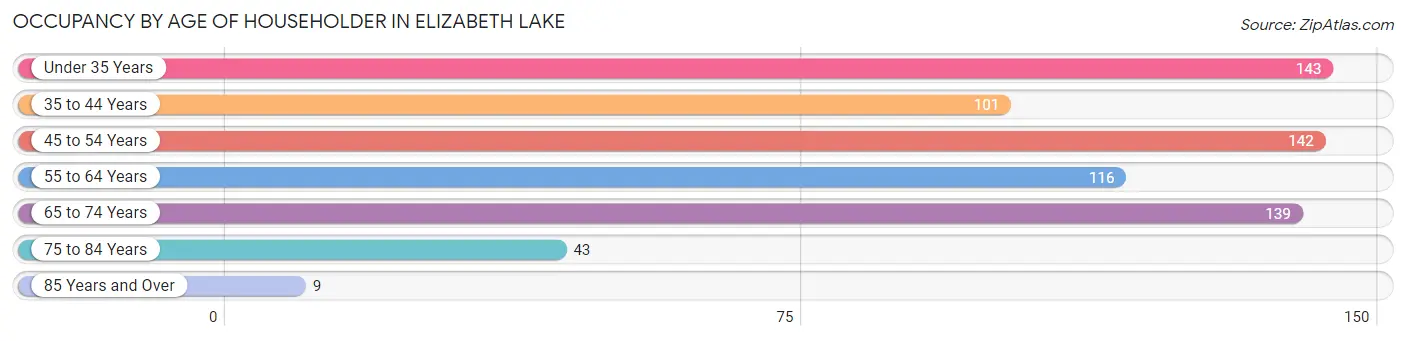
| Age Bracket | # Households | % Households |
| Under 35 Years | 143 | 20.6% |
| 35 to 44 Years | 101 | 14.6% |
| 45 to 54 Years | 142 | 20.5% |
| 55 to 64 Years | 116 | 16.7% |
| 65 to 74 Years | 139 | 20.1% |
| 75 to 84 Years | 43 | 6.2% |
| 85 Years and Over | 9 | 1.3% |
| Total | 693 | 100.0% |
Housing Finances in Elizabeth Lake
Median Income by Occupancy in Elizabeth Lake
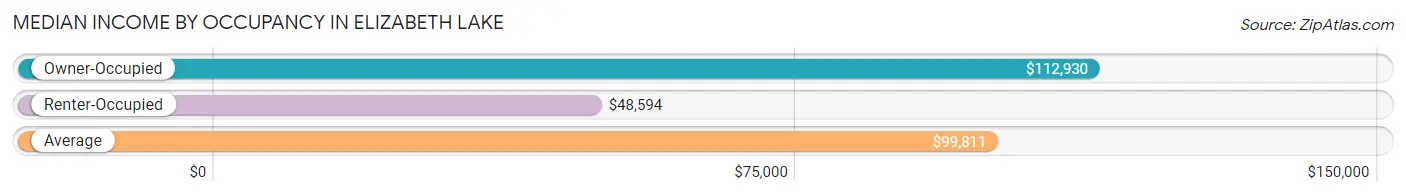
| Occupancy Type | # Households | Median Income |
| Owner-Occupied | 609 (87.9%) | $112,930 |
| Renter-Occupied | 84 (12.1%) | $48,594 |
| Average | 693 (100.0%) | $99,811 |
Occupancy by Householder Income Bracket in Elizabeth Lake
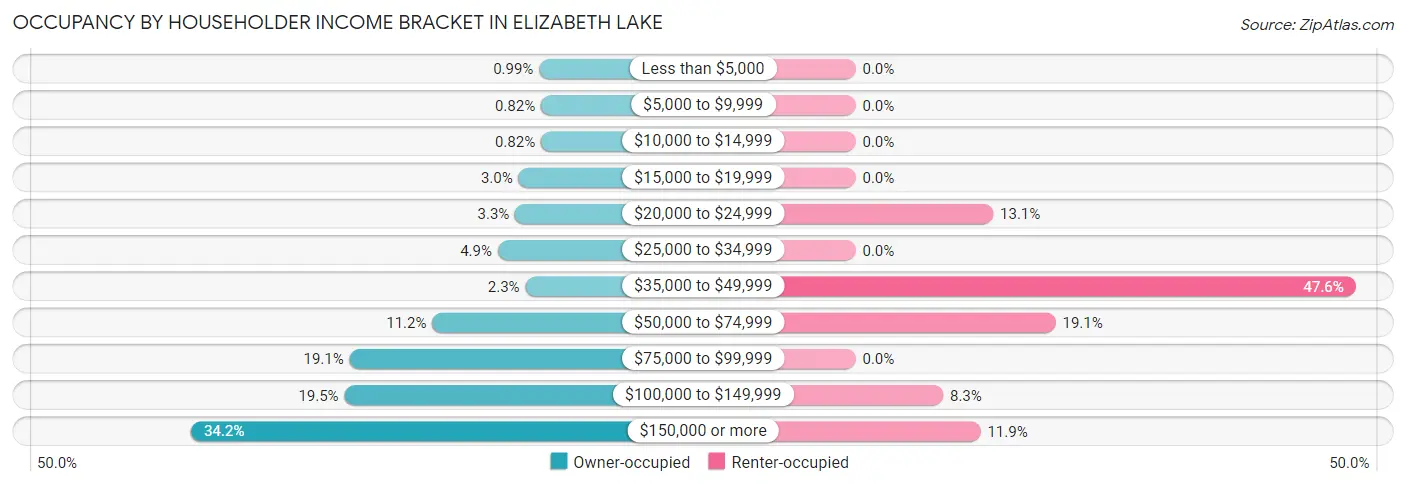
| Income Bracket | Owner-occupied | Renter-occupied |
| Less than $5,000 | 6 (1.0%) | 0 (0.0%) |
| $5,000 to $9,999 | 5 (0.8%) | 0 (0.0%) |
| $10,000 to $14,999 | 5 (0.8%) | 0 (0.0%) |
| $15,000 to $19,999 | 18 (3.0%) | 0 (0.0%) |
| $20,000 to $24,999 | 20 (3.3%) | 11 (13.1%) |
| $25,000 to $34,999 | 30 (4.9%) | 0 (0.0%) |
| $35,000 to $49,999 | 14 (2.3%) | 40 (47.6%) |
| $50,000 to $74,999 | 68 (11.2%) | 16 (19.1%) |
| $75,000 to $99,999 | 116 (19.1%) | 0 (0.0%) |
| $100,000 to $149,999 | 119 (19.5%) | 7 (8.3%) |
| $150,000 or more | 208 (34.2%) | 10 (11.9%) |
| Total | 609 (100.0%) | 84 (100.0%) |
Monthly Housing Cost Tiers in Elizabeth Lake
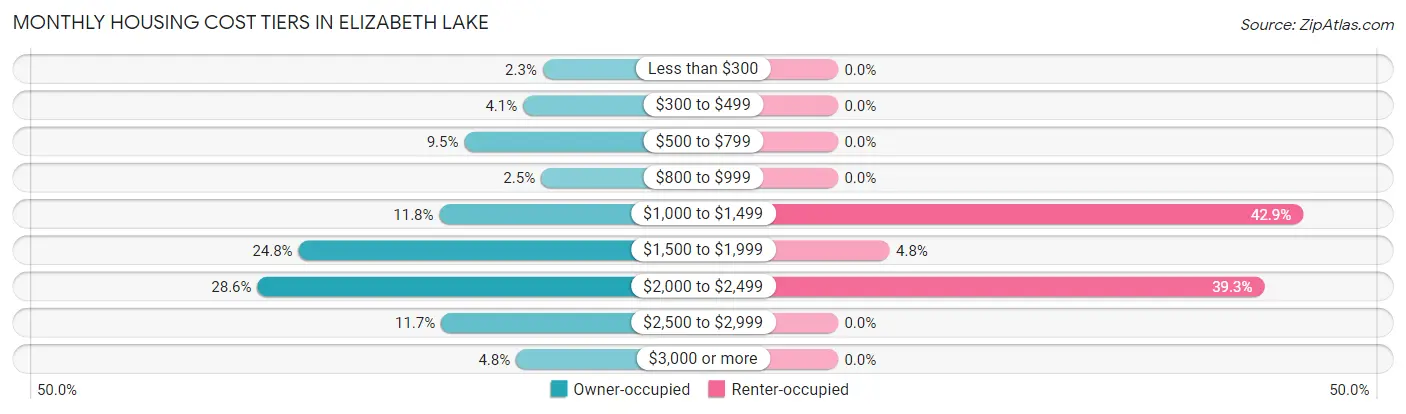
| Monthly Cost | Owner-occupied | Renter-occupied |
| Less than $300 | 14 (2.3%) | 0 (0.0%) |
| $300 to $499 | 25 (4.1%) | 0 (0.0%) |
| $500 to $799 | 58 (9.5%) | 0 (0.0%) |
| $800 to $999 | 15 (2.5%) | 0 (0.0%) |
| $1,000 to $1,499 | 72 (11.8%) | 36 (42.9%) |
| $1,500 to $1,999 | 151 (24.8%) | 4 (4.8%) |
| $2,000 to $2,499 | 174 (28.6%) | 33 (39.3%) |
| $2,500 to $2,999 | 71 (11.7%) | 0 (0.0%) |
| $3,000 or more | 29 (4.8%) | 0 (0.0%) |
| Total | 609 (100.0%) | 84 (100.0%) |
Physical Housing Characteristics in Elizabeth Lake
Housing Structures in Elizabeth Lake
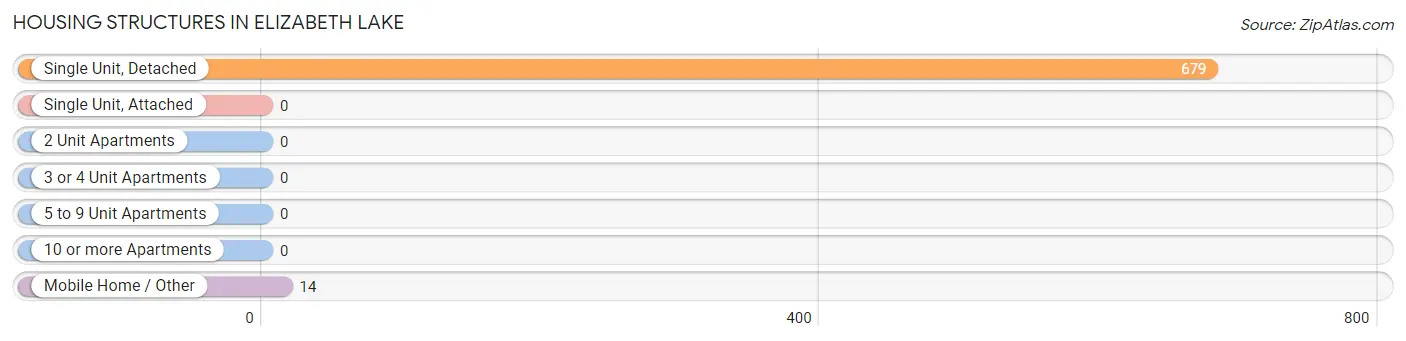
| Structure Type | # Housing Units | % Housing Units |
| Single Unit, Detached | 679 | 98.0% |
| Single Unit, Attached | 0 | 0.0% |
| 2 Unit Apartments | 0 | 0.0% |
| 3 or 4 Unit Apartments | 0 | 0.0% |
| 5 to 9 Unit Apartments | 0 | 0.0% |
| 10 or more Apartments | 0 | 0.0% |
| Mobile Home / Other | 14 | 2.0% |
| Total | 693 | 100.0% |
Housing Structures by Occupancy in Elizabeth Lake
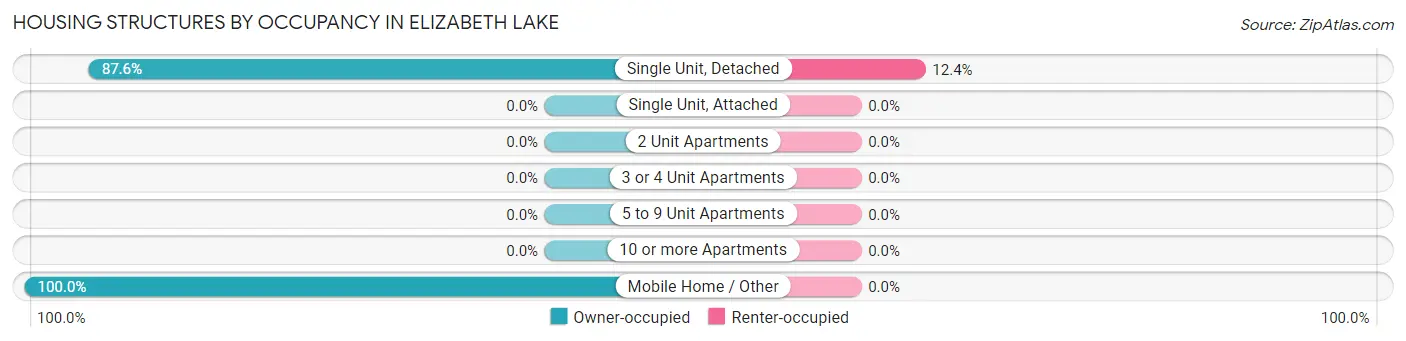
| Structure Type | Owner-occupied | Renter-occupied |
| Single Unit, Detached | 595 (87.6%) | 84 (12.4%) |
| Single Unit, Attached | 0 (0.0%) | 0 (0.0%) |
| 2 Unit Apartments | 0 (0.0%) | 0 (0.0%) |
| 3 or 4 Unit Apartments | 0 (0.0%) | 0 (0.0%) |
| 5 to 9 Unit Apartments | 0 (0.0%) | 0 (0.0%) |
| 10 or more Apartments | 0 (0.0%) | 0 (0.0%) |
| Mobile Home / Other | 14 (100.0%) | 0 (0.0%) |
| Total | 609 (87.9%) | 84 (12.1%) |
Housing Structures by Number of Rooms in Elizabeth Lake
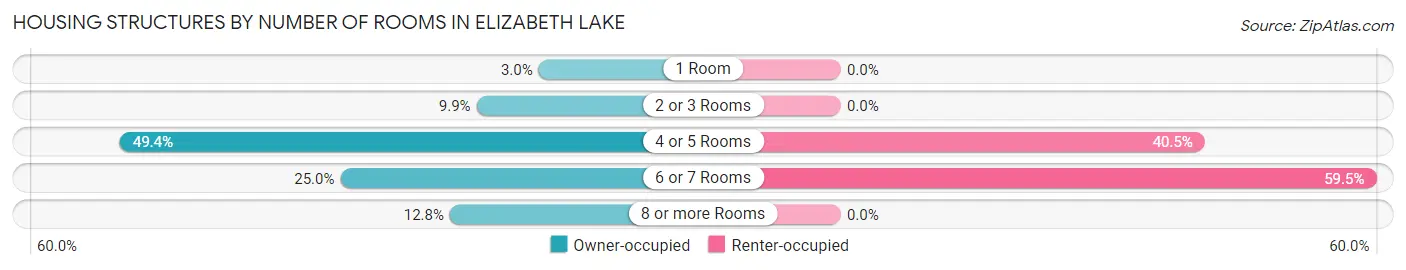
| Number of Rooms | Owner-occupied | Renter-occupied |
| 1 Room | 18 (3.0%) | 0 (0.0%) |
| 2 or 3 Rooms | 60 (9.9%) | 0 (0.0%) |
| 4 or 5 Rooms | 301 (49.4%) | 34 (40.5%) |
| 6 or 7 Rooms | 152 (25.0%) | 50 (59.5%) |
| 8 or more Rooms | 78 (12.8%) | 0 (0.0%) |
| Total | 609 (100.0%) | 84 (100.0%) |
Housing Structure by Heating Type in Elizabeth Lake
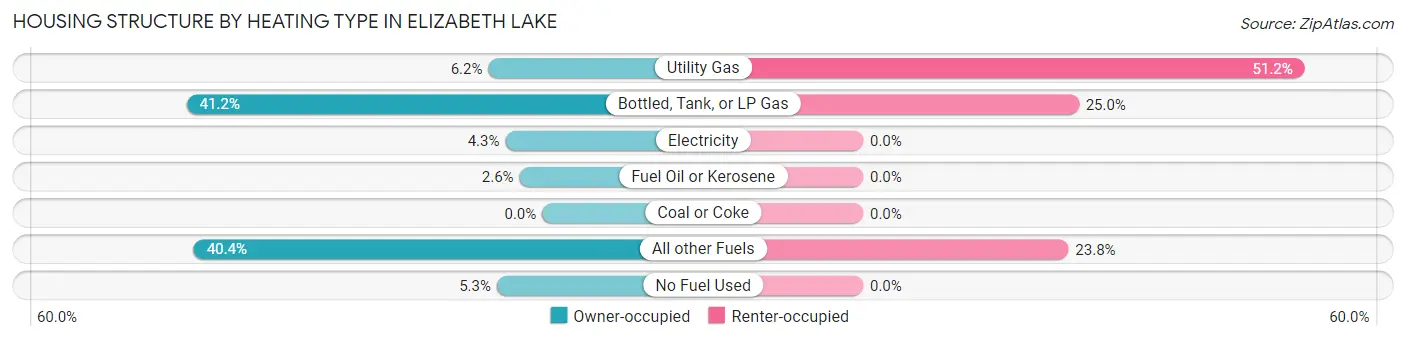
| Heating Type | Owner-occupied | Renter-occupied |
| Utility Gas | 38 (6.2%) | 43 (51.2%) |
| Bottled, Tank, or LP Gas | 251 (41.2%) | 21 (25.0%) |
| Electricity | 26 (4.3%) | 0 (0.0%) |
| Fuel Oil or Kerosene | 16 (2.6%) | 0 (0.0%) |
| Coal or Coke | 0 (0.0%) | 0 (0.0%) |
| All other Fuels | 246 (40.4%) | 20 (23.8%) |
| No Fuel Used | 32 (5.2%) | 0 (0.0%) |
| Total | 609 (100.0%) | 84 (100.0%) |
Household Vehicle Usage in Elizabeth Lake
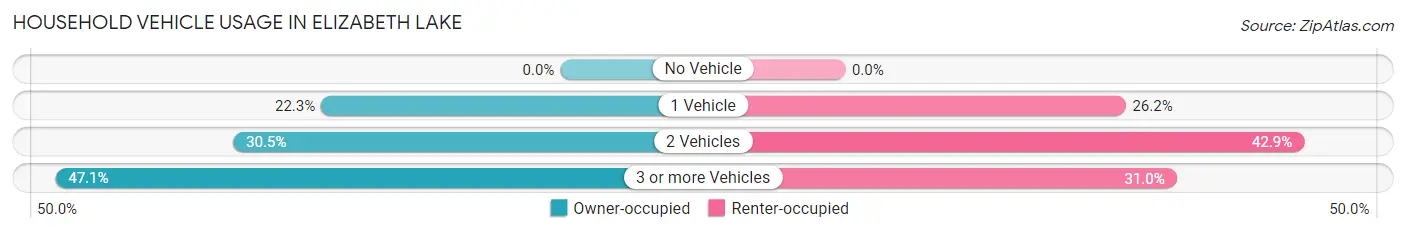
| Vehicles per Household | Owner-occupied | Renter-occupied |
| No Vehicle | 0 (0.0%) | 0 (0.0%) |
| 1 Vehicle | 136 (22.3%) | 22 (26.2%) |
| 2 Vehicles | 186 (30.5%) | 36 (42.9%) |
| 3 or more Vehicles | 287 (47.1%) | 26 (30.9%) |
| Total | 609 (100.0%) | 84 (100.0%) |
Real Estate & Mortgages in Elizabeth Lake
Real Estate and Mortgage Overview in Elizabeth Lake
| Characteristic | Without Mortgage | With Mortgage |
| Housing Units | 109 | 500 |
| Median Property Value | $301,200 | $370,900 |
| Median Household Income | $85,089 | $208 |
| Monthly Housing Costs | $553 | $29 |
| Real Estate Taxes | $2,174 | $0 |
Property Value by Mortgage Status in Elizabeth Lake
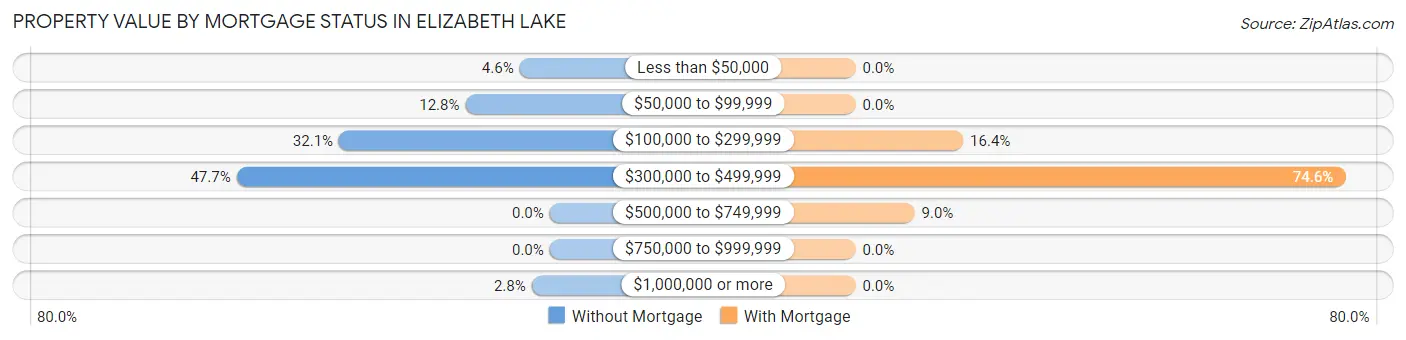
| Property Value | Without Mortgage | With Mortgage |
| Less than $50,000 | 5 (4.6%) | 0 (0.0%) |
| $50,000 to $99,999 | 14 (12.8%) | 0 (0.0%) |
| $100,000 to $299,999 | 35 (32.1%) | 82 (16.4%) |
| $300,000 to $499,999 | 52 (47.7%) | 373 (74.6%) |
| $500,000 to $749,999 | 0 (0.0%) | 45 (9.0%) |
| $750,000 to $999,999 | 0 (0.0%) | 0 (0.0%) |
| $1,000,000 or more | 3 (2.8%) | 0 (0.0%) |
| Total | 109 (100.0%) | 500 (100.0%) |
Household Income by Mortgage Status in Elizabeth Lake
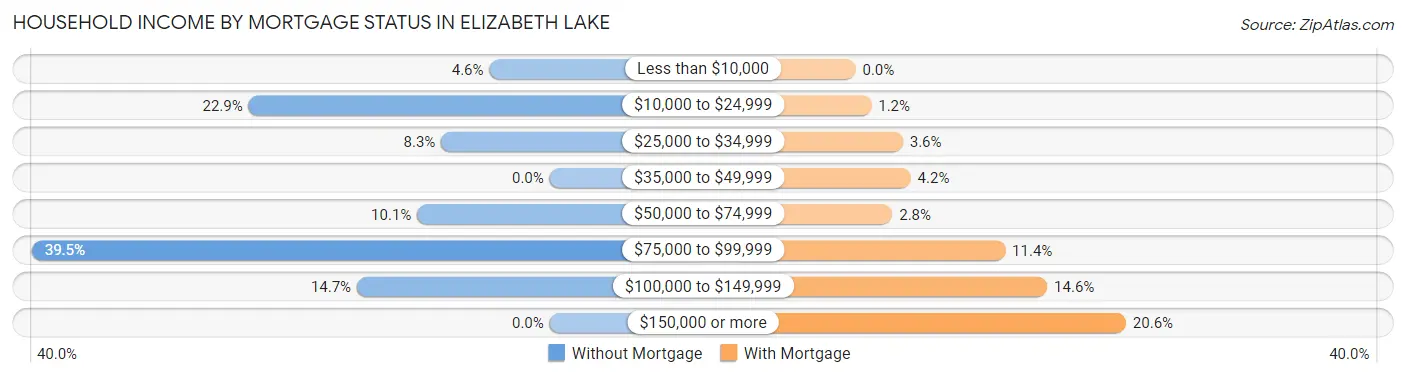
| Household Income | Without Mortgage | With Mortgage |
| Less than $10,000 | 5 (4.6%) | 0 (0.0%) |
| $10,000 to $24,999 | 25 (22.9%) | 6 (1.2%) |
| $25,000 to $34,999 | 9 (8.3%) | 18 (3.6%) |
| $35,000 to $49,999 | 0 (0.0%) | 21 (4.2%) |
| $50,000 to $74,999 | 11 (10.1%) | 14 (2.8%) |
| $75,000 to $99,999 | 43 (39.5%) | 57 (11.4%) |
| $100,000 to $149,999 | 16 (14.7%) | 73 (14.6%) |
| $150,000 or more | 0 (0.0%) | 103 (20.6%) |
| Total | 109 (100.0%) | 500 (100.0%) |
Property Value to Household Income Ratio in Elizabeth Lake
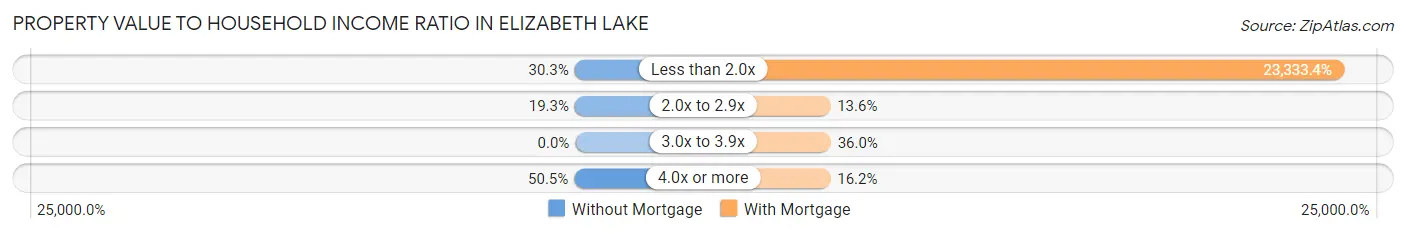
| Value-to-Income Ratio | Without Mortgage | With Mortgage |
| Less than 2.0x | 33 (30.3%) | 116,667 (23,333.4%) |
| 2.0x to 2.9x | 21 (19.3%) | 68 (13.6%) |
| 3.0x to 3.9x | 0 (0.0%) | 180 (36.0%) |
| 4.0x or more | 55 (50.5%) | 81 (16.2%) |
| Total | 109 (100.0%) | 500 (100.0%) |
Real Estate Taxes by Mortgage Status in Elizabeth Lake
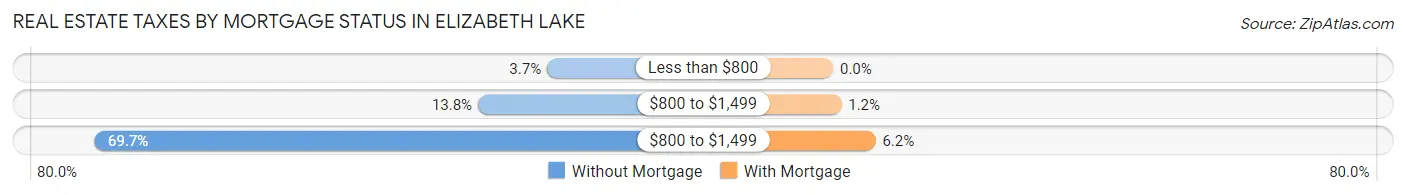
| Property Taxes | Without Mortgage | With Mortgage |
| Less than $800 | 4 (3.7%) | 0 (0.0%) |
| $800 to $1,499 | 15 (13.8%) | 6 (1.2%) |
| $800 to $1,499 | 76 (69.7%) | 31 (6.2%) |
| Total | 109 (100.0%) | 500 (100.0%) |
Health & Disability in Elizabeth Lake
Health Insurance Coverage by Age in Elizabeth Lake
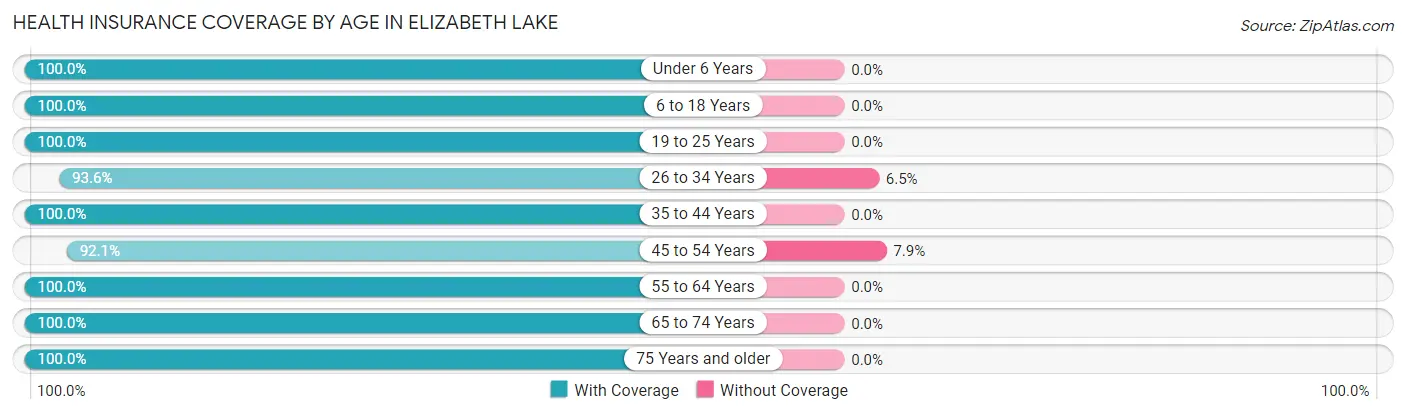
| Age Bracket | With Coverage | Without Coverage |
| Under 6 Years | 118 (100.0%) | 0 (0.0%) |
| 6 to 18 Years | 213 (100.0%) | 0 (0.0%) |
| 19 to 25 Years | 108 (100.0%) | 0 (0.0%) |
| 26 to 34 Years | 290 (93.5%) | 20 (6.5%) |
| 35 to 44 Years | 204 (100.0%) | 0 (0.0%) |
| 45 to 54 Years | 258 (92.1%) | 22 (7.9%) |
| 55 to 64 Years | 213 (100.0%) | 0 (0.0%) |
| 65 to 74 Years | 230 (100.0%) | 0 (0.0%) |
| 75 Years and older | 88 (100.0%) | 0 (0.0%) |
| Total | 1,722 (97.6%) | 42 (2.4%) |
Health Insurance Coverage by Citizenship Status in Elizabeth Lake
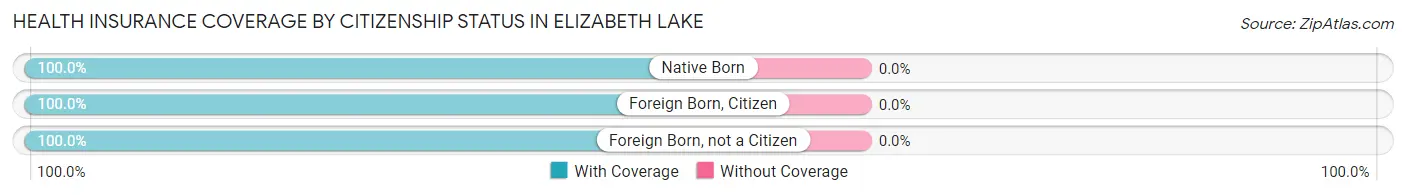
| Citizenship Status | With Coverage | Without Coverage |
| Native Born | 118 (100.0%) | 0 (0.0%) |
| Foreign Born, Citizen | 213 (100.0%) | 0 (0.0%) |
| Foreign Born, not a Citizen | 108 (100.0%) | 0 (0.0%) |
Health Insurance Coverage by Household Income in Elizabeth Lake
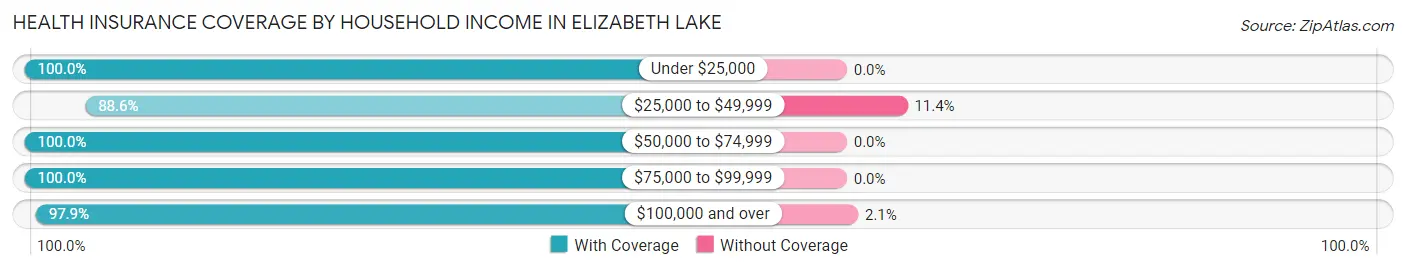
| Household Income | With Coverage | Without Coverage |
| Under $25,000 | 94 (100.0%) | 0 (0.0%) |
| $25,000 to $49,999 | 156 (88.6%) | 20 (11.4%) |
| $50,000 to $74,999 | 236 (100.0%) | 0 (0.0%) |
| $75,000 to $99,999 | 217 (100.0%) | 0 (0.0%) |
| $100,000 and over | 1,019 (97.9%) | 22 (2.1%) |
Public vs Private Health Insurance Coverage by Age in Elizabeth Lake
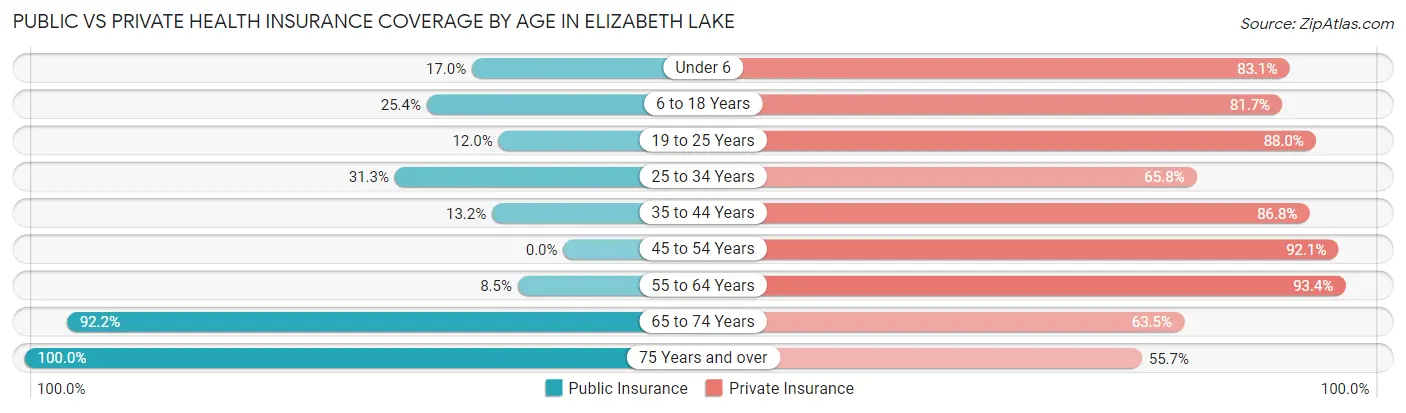
| Age Bracket | Public Insurance | Private Insurance |
| Under 6 | 20 (17.0%) | 98 (83.1%) |
| 6 to 18 Years | 54 (25.4%) | 174 (81.7%) |
| 19 to 25 Years | 13 (12.0%) | 95 (88.0%) |
| 25 to 34 Years | 97 (31.3%) | 204 (65.8%) |
| 35 to 44 Years | 27 (13.2%) | 177 (86.8%) |
| 45 to 54 Years | 0 (0.0%) | 258 (92.1%) |
| 55 to 64 Years | 18 (8.5%) | 199 (93.4%) |
| 65 to 74 Years | 212 (92.2%) | 146 (63.5%) |
| 75 Years and over | 88 (100.0%) | 49 (55.7%) |
| Total | 529 (30.0%) | 1,400 (79.4%) |
Disability Status by Sex by Age in Elizabeth Lake
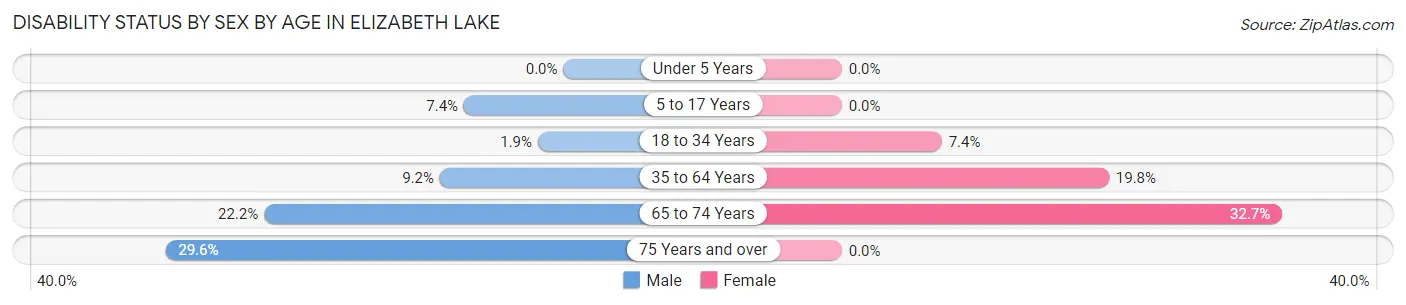
| Age Bracket | Male | Female |
| Under 5 Years | 0 (0.0%) | 0 (0.0%) |
| 5 to 17 Years | 9 (7.4%) | 0 (0.0%) |
| 18 to 34 Years | 4 (1.9%) | 19 (7.4%) |
| 35 to 64 Years | 32 (9.2%) | 69 (19.8%) |
| 65 to 74 Years | 28 (22.2%) | 34 (32.7%) |
| 75 Years and over | 13 (29.5%) | 0 (0.0%) |
Disability Class by Sex by Age in Elizabeth Lake
Disability Class: Hearing Difficulty
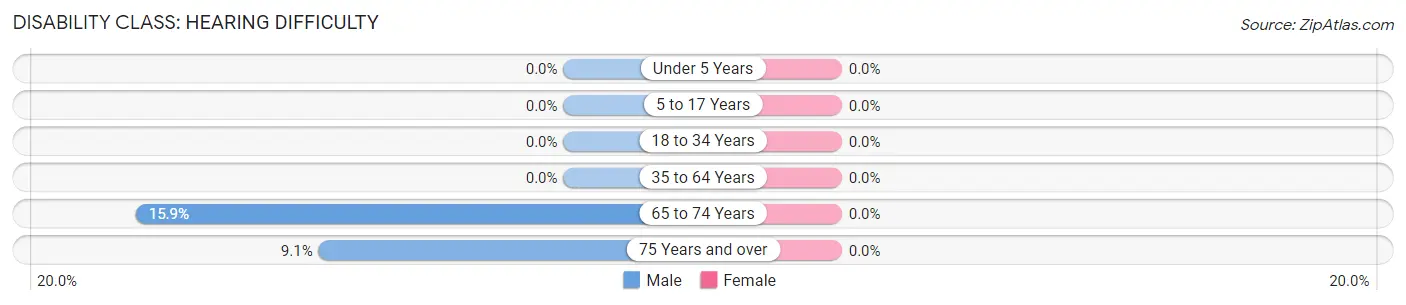
| Age Bracket | Male | Female |
| Under 5 Years | 0 (0.0%) | 0 (0.0%) |
| 5 to 17 Years | 0 (0.0%) | 0 (0.0%) |
| 18 to 34 Years | 0 (0.0%) | 0 (0.0%) |
| 35 to 64 Years | 0 (0.0%) | 0 (0.0%) |
| 65 to 74 Years | 20 (15.9%) | 0 (0.0%) |
| 75 Years and over | 4 (9.1%) | 0 (0.0%) |
Disability Class: Vision Difficulty
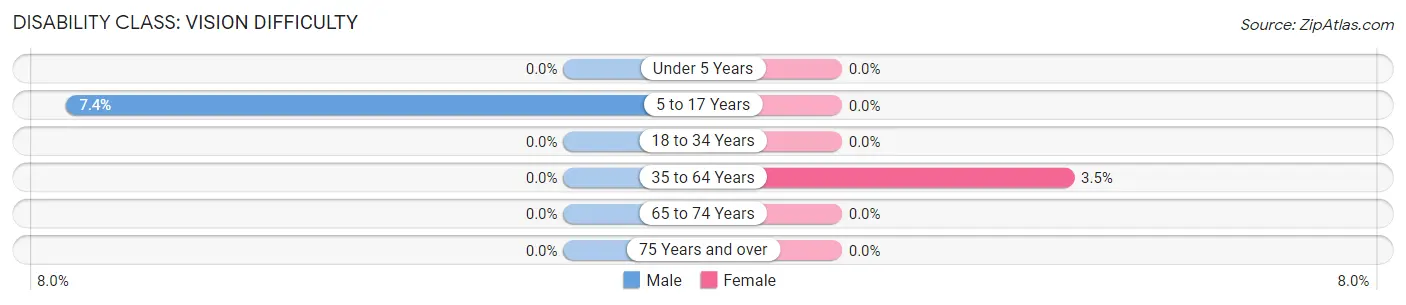
| Age Bracket | Male | Female |
| Under 5 Years | 0 (0.0%) | 0 (0.0%) |
| 5 to 17 Years | 9 (7.4%) | 0 (0.0%) |
| 18 to 34 Years | 0 (0.0%) | 0 (0.0%) |
| 35 to 64 Years | 0 (0.0%) | 12 (3.5%) |
| 65 to 74 Years | 0 (0.0%) | 0 (0.0%) |
| 75 Years and over | 0 (0.0%) | 0 (0.0%) |
Disability Class: Cognitive Difficulty
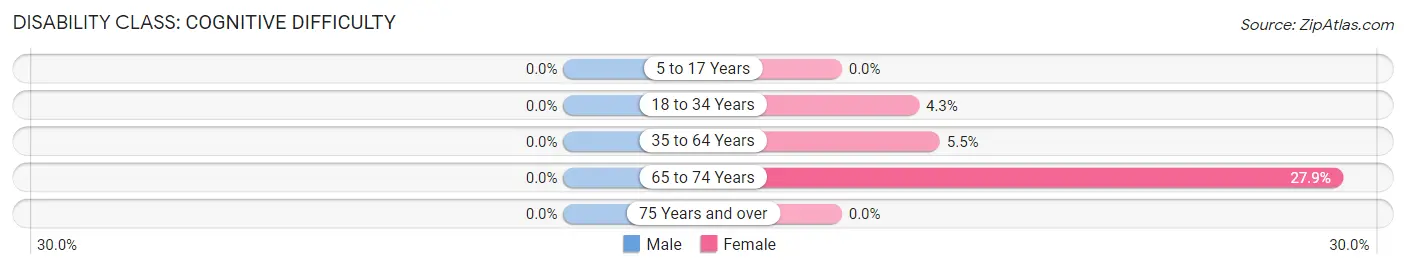
| Age Bracket | Male | Female |
| 5 to 17 Years | 0 (0.0%) | 0 (0.0%) |
| 18 to 34 Years | 0 (0.0%) | 11 (4.3%) |
| 35 to 64 Years | 0 (0.0%) | 19 (5.5%) |
| 65 to 74 Years | 0 (0.0%) | 29 (27.9%) |
| 75 Years and over | 0 (0.0%) | 0 (0.0%) |
Disability Class: Ambulatory Difficulty
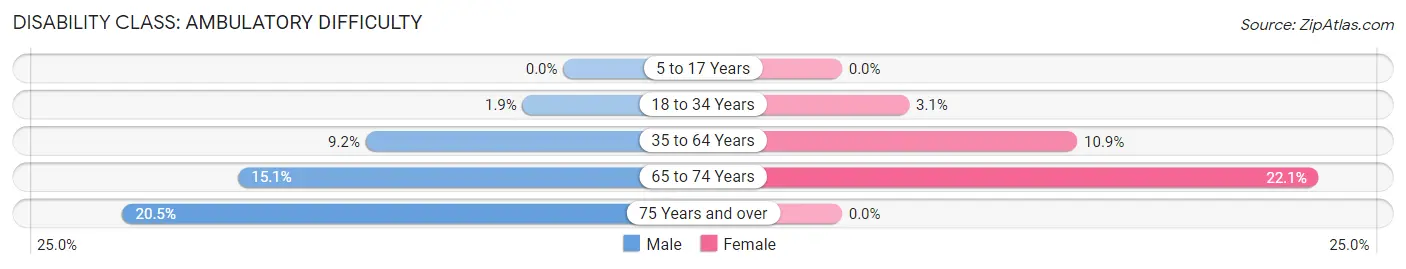
| Age Bracket | Male | Female |
| 5 to 17 Years | 0 (0.0%) | 0 (0.0%) |
| 18 to 34 Years | 4 (1.9%) | 8 (3.1%) |
| 35 to 64 Years | 32 (9.2%) | 38 (10.9%) |
| 65 to 74 Years | 19 (15.1%) | 23 (22.1%) |
| 75 Years and over | 9 (20.4%) | 0 (0.0%) |
Disability Class: Self-Care Difficulty
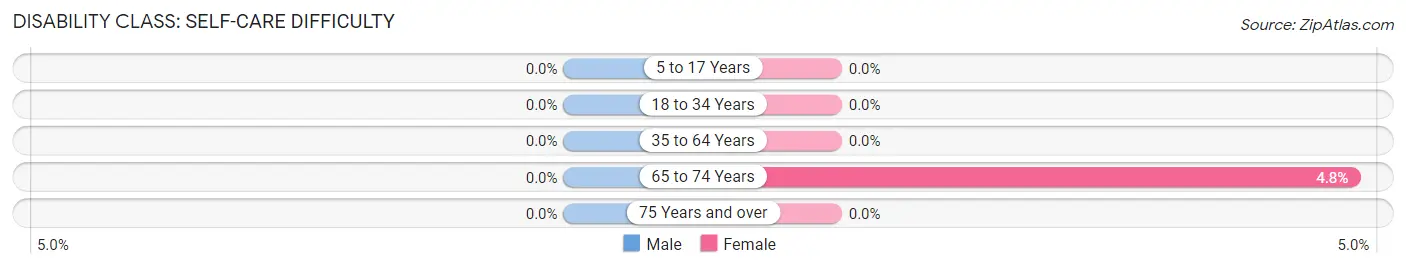
| Age Bracket | Male | Female |
| 5 to 17 Years | 0 (0.0%) | 0 (0.0%) |
| 18 to 34 Years | 0 (0.0%) | 0 (0.0%) |
| 35 to 64 Years | 0 (0.0%) | 0 (0.0%) |
| 65 to 74 Years | 0 (0.0%) | 5 (4.8%) |
| 75 Years and over | 0 (0.0%) | 0 (0.0%) |
Technology Access in Elizabeth Lake
Computing Device Access in Elizabeth Lake
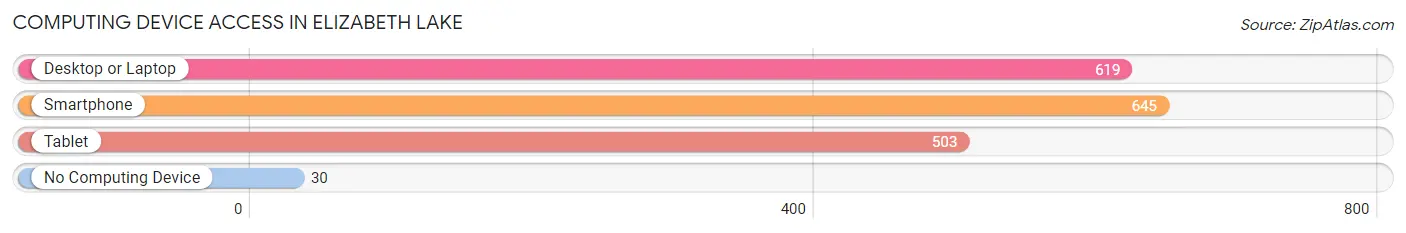
| Device Type | # Households | % Households |
| Desktop or Laptop | 619 | 89.3% |
| Smartphone | 645 | 93.1% |
| Tablet | 503 | 72.6% |
| No Computing Device | 30 | 4.3% |
| Total | 693 | 100.0% |
Internet Access in Elizabeth Lake
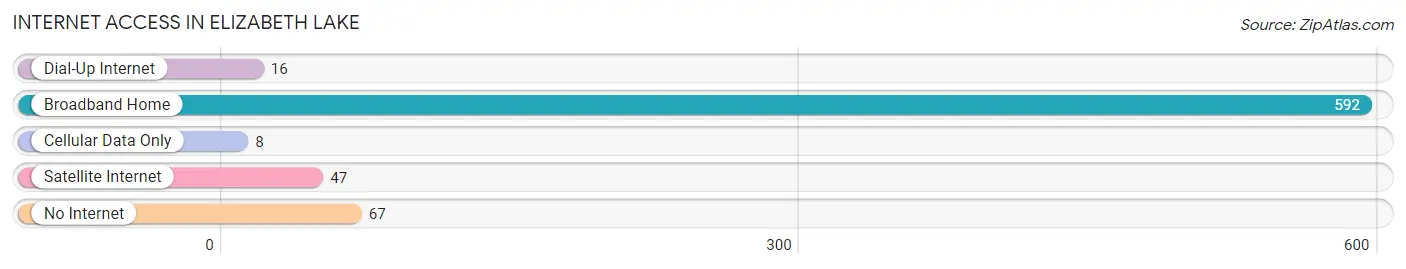
| Internet Type | # Households | % Households |
| Dial-Up Internet | 16 | 2.3% |
| Broadband Home | 592 | 85.4% |
| Cellular Data Only | 8 | 1.1% |
| Satellite Internet | 47 | 6.8% |
| No Internet | 67 | 9.7% |
| Total | 693 | 100.0% |
Elizabeth Lake Summary
History
Elizabeth Lake is a small unincorporated community located in the Angeles National Forest in Los Angeles County, California. It is located in the San Gabriel Mountains, about 25 miles north of the city of Los Angeles. The area was first settled in the late 1800s by ranchers and farmers, and the town was officially established in 1887.
The area was originally known as "Liz Lake" after the wife of one of the first settlers, but the name was changed to Elizabeth Lake in 1895. The lake itself was named after Elizabeth, the wife of one of the first settlers.
The town grew slowly over the years, and by the early 1900s it had become a popular destination for tourists and vacationers. The area was known for its beautiful scenery and its abundance of outdoor activities, such as fishing, hunting, and camping.
In the 1920s, the town began to attract more permanent residents, and by the 1940s it had become a popular weekend getaway for Los Angeles residents. The town was also home to a number of resorts, including the Elizabeth Lake Resort, which was built in the 1930s.
The town continued to grow throughout the 1950s and 1960s, and by the 1970s it had become a popular destination for retirees. The town was also home to a number of small businesses, including a general store, a post office, and a gas station.
Geography
Elizabeth Lake is located in the Angeles National Forest in Los Angeles County, California. It is situated in the San Gabriel Mountains, about 25 miles north of the city of Los Angeles. The area is surrounded by mountains and is home to a number of lakes, including Elizabeth Lake, which is the largest lake in the area.
The area is known for its beautiful scenery and its abundance of outdoor activities, such as fishing, hunting, and camping. The area is also home to a number of hiking trails, including the Pacific Crest Trail, which runs through the area.
Economy
The economy of Elizabeth Lake is largely based on tourism and recreation. The area is home to a number of resorts, including the Elizabeth Lake Resort, which was built in the 1930s. The area is also home to a number of small businesses, including a general store, a post office, and a gas station.
The area is also home to a number of outdoor activities, such as fishing, hunting, and camping. The area is also home to a number of hiking trails, including the Pacific Crest Trail, which runs through the area.
Demographics
As of the 2010 census, the population of Elizabeth Lake was 1,845. The population is largely white (90.2%), with a small percentage of Hispanic or Latino (4.2%) and African American (2.2%) residents. The median household income is $50,000, and the median age is 44.
Conclusion
Elizabeth Lake is a small unincorporated community located in the Angeles National Forest in Los Angeles County, California. It is situated in the San Gabriel Mountains, about 25 miles north of the city of Los Angeles. The area was first settled in the late 1800s by ranchers and farmers, and the town was officially established in 1887. The area is known for its beautiful scenery and its abundance of outdoor activities, such as fishing, hunting, and camping. The economy of Elizabeth Lake is largely based on tourism and recreation, and the population is largely white.
Common Questions
What is Per Capita Income in Elizabeth Lake?
Per Capita income in Elizabeth Lake is $45,330.
What is the Median Family Income in Elizabeth Lake?
Median Family Income in Elizabeth Lake is $116,319.
What is the Median Household income in Elizabeth Lake?
Median Household Income in Elizabeth Lake is $99,811.
What is Income or Wage Gap in Elizabeth Lake?
Income or Wage Gap in Elizabeth Lake is 45.8%.
Women in Elizabeth Lake earn 54.2 cents for every dollar earned by a man.
What is Inequality or Gini Index in Elizabeth Lake?
Inequality or Gini Index in Elizabeth Lake is 0.36.
What is the Total Population of Elizabeth Lake?
Total Population of Elizabeth Lake is 1,764.
What is the Total Male Population of Elizabeth Lake?
Total Male Population of Elizabeth Lake is 912.
What is the Total Female Population of Elizabeth Lake?
Total Female Population of Elizabeth Lake is 852.
What is the Ratio of Males per 100 Females in Elizabeth Lake?
There are 107.04 Males per 100 Females in Elizabeth Lake.
What is the Ratio of Females per 100 Males in Elizabeth Lake?
There are 93.42 Females per 100 Males in Elizabeth Lake.
What is the Median Population Age in Elizabeth Lake?
Median Population Age in Elizabeth Lake is 38.9 Years.
What is the Average Family Size in Elizabeth Lake
Average Family Size in Elizabeth Lake is 2.9 People.
What is the Average Household Size in Elizabeth Lake
Average Household Size in Elizabeth Lake is 2.5 People.
How Large is the Labor Force in Elizabeth Lake?
There are 972 People in the Labor Forcein in Elizabeth Lake.
What is the Percentage of People in the Labor Force in Elizabeth Lake?
63.3% of People are in the Labor Force in Elizabeth Lake.
What is the Unemployment Rate in Elizabeth Lake?
Unemployment Rate in Elizabeth Lake is 8.7%.