Cities with the Highest Percentage of Honduran Population in Illinois
RELATED REPORTS & OPTIONS
Honduran
Illinois
Compare Cities
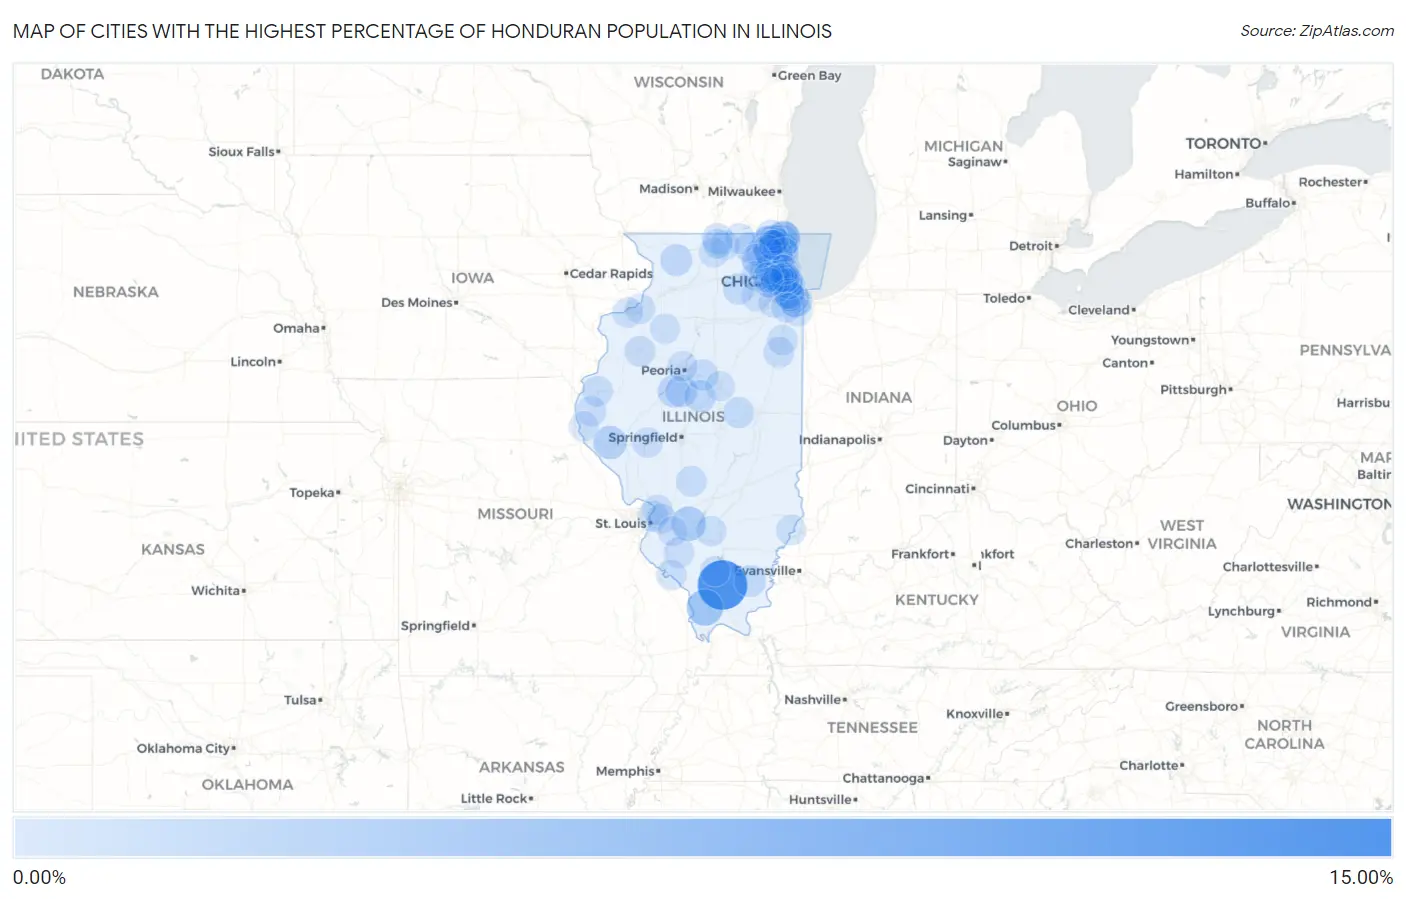
Map of Cities with the Highest Percentage of Honduran Population in Illinois
0.00%
15.00%
Cities with the Highest Percentage of Honduran Population in Illinois
| City | Honduran | vs State | vs National | |
| 1. | Spillertown | 12.70% | 0.14%(+12.6)#1 | 0.32%(+12.4)#24 |
| 2. | Anna | 4.06% | 0.14%(+3.93)#2 | 0.32%(+3.74)#189 |
| 3. | Waukegan | 2.91% | 0.14%(+2.78)#3 | 0.32%(+2.59)#305 |
| 4. | Ridgewood | 2.75% | 0.14%(+2.61)#4 | 0.32%(+2.42)#331 |
| 5. | Breese | 2.72% | 0.14%(+2.58)#5 | 0.32%(+2.40)#336 |
| 6. | Beach Park | 2.57% | 0.14%(+2.43)#6 | 0.32%(+2.24)#372 |
| 7. | Hanover Park | 2.15% | 0.14%(+2.01)#7 | 0.32%(+1.82)#455 |
| 8. | Baylis | 2.08% | 0.14%(+1.95)#8 | 0.32%(+1.76)#469 |
| 9. | Hawthorn Woods | 1.81% | 0.14%(+1.68)#9 | 0.32%(+1.49)#524 |
| 10. | Round Lake Beach | 1.60% | 0.14%(+1.47)#10 | 0.32%(+1.28)#579 |
| 11. | Bridgeview | 1.60% | 0.14%(+1.46)#11 | 0.32%(+1.28)#581 |
| 12. | Long Lake | 1.57% | 0.14%(+1.43)#12 | 0.32%(+1.24)#592 |
| 13. | Phoenix | 1.49% | 0.14%(+1.35)#13 | 0.32%(+1.16)#627 |
| 14. | Manito | 1.40% | 0.14%(+1.26)#14 | 0.32%(+1.07)#663 |
| 15. | Green Valley | 1.30% | 0.14%(+1.16)#15 | 0.32%(+0.973)#708 |
| 16. | Shannon | 1.15% | 0.14%(+1.01)#16 | 0.32%(+0.825)#793 |
| 17. | Rolling Meadows | 1.06% | 0.14%(+0.921)#17 | 0.32%(+0.733)#853 |
| 18. | Armington | 1.04% | 0.14%(+0.901)#18 | 0.32%(+0.714)#869 |
| 19. | Eldorado | 0.97% | 0.14%(+0.839)#19 | 0.32%(+0.652)#912 |
| 20. | Park City | 0.90% | 0.14%(+0.761)#20 | 0.32%(+0.573)#958 |
| 21. | Hinckley | 0.88% | 0.14%(+0.747)#21 | 0.32%(+0.559)#968 |
| 22. | Forest Lake | 0.82% | 0.14%(+0.683)#22 | 0.32%(+0.496)#1,043 |
| 23. | Westchester | 0.78% | 0.14%(+0.644)#23 | 0.32%(+0.456)#1,078 |
| 24. | Goodfield | 0.77% | 0.14%(+0.637)#24 | 0.32%(+0.450)#1,086 |
| 25. | Bellwood | 0.72% | 0.14%(+0.585)#25 | 0.32%(+0.397)#1,152 |
| 26. | North Chicago | 0.71% | 0.14%(+0.574)#26 | 0.32%(+0.386)#1,169 |
| 27. | Zion | 0.69% | 0.14%(+0.553)#27 | 0.32%(+0.365)#1,204 |
| 28. | Harvey | 0.65% | 0.14%(+0.519)#28 | 0.32%(+0.331)#1,249 |
| 29. | De Land | 0.63% | 0.14%(+0.494)#29 | 0.32%(+0.306)#1,280 |
| 30. | Gurnee | 0.57% | 0.14%(+0.433)#30 | 0.32%(+0.245)#1,373 |
| 31. | Roscoe | 0.56% | 0.14%(+0.422)#31 | 0.32%(+0.234)#1,399 |
| 32. | Galesburg | 0.54% | 0.14%(+0.403)#32 | 0.32%(+0.215)#1,430 |
| 33. | Gages Lake | 0.53% | 0.14%(+0.397)#33 | 0.32%(+0.210)#1,437 |
| 34. | Cicero | 0.53% | 0.14%(+0.390)#34 | 0.32%(+0.202)#1,446 |
| 35. | Woodstock | 0.47% | 0.14%(+0.333)#35 | 0.32%(+0.145)#1,564 |
| 36. | Forest View | 0.46% | 0.14%(+0.329)#36 | 0.32%(+0.141)#1,573 |
| 37. | Wheeling | 0.46% | 0.14%(+0.328)#37 | 0.32%(+0.141)#1,574 |
| 38. | Hillsboro | 0.46% | 0.14%(+0.323)#38 | 0.32%(+0.136)#1,587 |
| 39. | Madison | 0.45% | 0.14%(+0.313)#39 | 0.32%(+0.126)#1,613 |
| 40. | Bensenville | 0.44% | 0.14%(+0.309)#40 | 0.32%(+0.122)#1,622 |
| 41. | Blue Island | 0.44% | 0.14%(+0.305)#41 | 0.32%(+0.118)#1,629 |
| 42. | Carthage | 0.39% | 0.14%(+0.255)#42 | 0.32%(+0.068)#1,749 |
| 43. | Clifton | 0.39% | 0.14%(+0.252)#43 | 0.32%(+0.064)#1,758 |
| 44. | Hillside | 0.38% | 0.14%(+0.242)#44 | 0.32%(+0.055)#1,781 |
| 45. | Tilden | 0.36% | 0.14%(+0.229)#45 | 0.32%(+0.041)#1,824 |
| 46. | Kankakee | 0.35% | 0.14%(+0.220)#46 | 0.32%(+0.032)#1,842 |
| 47. | South Roxana | 0.33% | 0.14%(+0.195)#47 | 0.32%(+0.007)#1,913 |
| 48. | Berwyn | 0.32% | 0.14%(+0.187)#48 | 0.32%(-0.001)#1,939 |
| 49. | Palatine | 0.31% | 0.14%(+0.173)#49 | 0.32%(-0.015)#1,982 |
| 50. | Lockport | 0.29% | 0.14%(+0.160)#50 | 0.32%(-0.028)#2,023 |
| 51. | Peoria | 0.29% | 0.14%(+0.159)#51 | 0.32%(-0.029)#2,025 |
| 52. | Loraine | 0.29% | 0.14%(+0.151)#52 | 0.32%(-0.037)#2,052 |
| 53. | Oakwood Hills | 0.24% | 0.14%(+0.107)#53 | 0.32%(-0.080)#2,199 |
| 54. | Rock Island | 0.23% | 0.14%(+0.093)#54 | 0.32%(-0.095)#2,273 |
| 55. | Melrose Park | 0.23% | 0.14%(+0.091)#55 | 0.32%(-0.096)#2,281 |
| 56. | Jacksonville | 0.22% | 0.14%(+0.080)#56 | 0.32%(-0.107)#2,329 |
| 57. | Chicago | 0.21% | 0.14%(+0.079)#57 | 0.32%(-0.109)#2,337 |
| 58. | Centralia | 0.21% | 0.14%(+0.072)#58 | 0.32%(-0.116)#2,366 |
| 59. | Carpentersville | 0.20% | 0.14%(+0.068)#59 | 0.32%(-0.119)#2,376 |
| 60. | Chester | 0.20% | 0.14%(+0.067)#60 | 0.32%(-0.121)#2,388 |
| 61. | Broadview | 0.20% | 0.14%(+0.066)#61 | 0.32%(-0.122)#2,390 |
| 62. | Christopher | 0.20% | 0.14%(+0.064)#62 | 0.32%(-0.123)#2,397 |
| 63. | Lombard | 0.20% | 0.14%(+0.060)#63 | 0.32%(-0.127)#2,414 |
| 64. | Vernon Hills | 0.19% | 0.14%(+0.059)#64 | 0.32%(-0.128)#2,418 |
| 65. | Allendale | 0.19% | 0.14%(+0.057)#65 | 0.32%(-0.131)#2,426 |
| 66. | Antioch | 0.18% | 0.14%(+0.048)#66 | 0.32%(-0.139)#2,460 |
| 67. | Des Plaines | 0.18% | 0.14%(+0.048)#67 | 0.32%(-0.140)#2,462 |
| 68. | Oak Park | 0.17% | 0.14%(+0.034)#68 | 0.32%(-0.154)#2,550 |
| 69. | Harvard | 0.16% | 0.14%(+0.030)#69 | 0.32%(-0.158)#2,574 |
| 70. | Westmont | 0.16% | 0.14%(+0.021)#70 | 0.32%(-0.166)#2,612 |
| 71. | St Charles | 0.15% | 0.14%(+0.017)#71 | 0.32%(-0.170)#2,633 |
| 72. | Addison | 0.15% | 0.14%(+0.016)#72 | 0.32%(-0.171)#2,642 |
| 73. | Hainesville | 0.14% | 0.14%(+0.006)#73 | 0.32%(-0.182)#2,706 |
| 74. | Niles | 0.14% | 0.14%(+0.005)#74 | 0.32%(-0.182)#2,710 |
| 75. | Timberlane | 0.14% | 0.14%(+0.002)#75 | 0.32%(-0.185)#2,723 |
| 76. | Oswego | 0.13% | 0.14%(-0.009)#76 | 0.32%(-0.196)#2,784 |
| 77. | Collinsville | 0.12% | 0.14%(-0.012)#77 | 0.32%(-0.199)#2,794 |
| 78. | Kewanee | 0.12% | 0.14%(-0.012)#78 | 0.32%(-0.199)#2,800 |
| 79. | Steger | 0.12% | 0.14%(-0.020)#79 | 0.32%(-0.207)#2,844 |
| 80. | Lake Forest | 0.11% | 0.14%(-0.022)#80 | 0.32%(-0.209)#2,861 |
| 81. | Elmhurst | 0.11% | 0.14%(-0.023)#81 | 0.32%(-0.211)#2,866 |
| 82. | Schaumburg | 0.11% | 0.14%(-0.027)#82 | 0.32%(-0.214)#2,880 |
| 83. | Wauconda | 0.11% | 0.14%(-0.028)#83 | 0.32%(-0.216)#2,889 |
| 84. | East Moline | 0.11% | 0.14%(-0.030)#84 | 0.32%(-0.218)#2,903 |
| 85. | Lindenhurst | 0.097% | 0.14%(-0.038)#85 | 0.32%(-0.225)#2,951 |
| 86. | Villa Park | 0.097% | 0.14%(-0.038)#86 | 0.32%(-0.226)#2,956 |
| 87. | Oak Lawn | 0.095% | 0.14%(-0.040)#87 | 0.32%(-0.227)#2,971 |
| 88. | Algonquin | 0.087% | 0.14%(-0.048)#88 | 0.32%(-0.236)#3,050 |
| 89. | Bloomington | 0.081% | 0.14%(-0.054)#89 | 0.32%(-0.241)#3,085 |
| 90. | Grayslake | 0.077% | 0.14%(-0.058)#90 | 0.32%(-0.246)#3,119 |
| 91. | Park Ridge | 0.076% | 0.14%(-0.059)#91 | 0.32%(-0.246)#3,127 |
| 92. | Alsip | 0.064% | 0.14%(-0.072)#92 | 0.32%(-0.259)#3,245 |
| 93. | Elmwood Park | 0.062% | 0.14%(-0.073)#93 | 0.32%(-0.261)#3,264 |
| 94. | Wheaton | 0.061% | 0.14%(-0.074)#94 | 0.32%(-0.261)#3,267 |
| 95. | Rockford | 0.060% | 0.14%(-0.075)#95 | 0.32%(-0.263)#3,282 |
| 96. | Carol Stream | 0.058% | 0.14%(-0.077)#96 | 0.32%(-0.265)#3,308 |
| 97. | Mascoutah | 0.057% | 0.14%(-0.078)#97 | 0.32%(-0.266)#3,314 |
| 98. | Machesney Park | 0.057% | 0.14%(-0.078)#98 | 0.32%(-0.266)#3,318 |
| 99. | Frankfort Square | 0.053% | 0.14%(-0.082)#99 | 0.32%(-0.269)#3,348 |
| 100. | Quincy | 0.053% | 0.14%(-0.082)#100 | 0.32%(-0.269)#3,350 |
Common Questions
What are the Top 10 Cities with the Highest Percentage of Honduran Population in Illinois?
Top 10 Cities with the Highest Percentage of Honduran Population in Illinois are:
#1
12.70%
#2
4.06%
#3
2.91%
#4
2.72%
#5
2.57%
#6
2.15%
#7
2.08%
#8
1.81%
#9
1.60%
#10
1.60%
What city has the Highest Percentage of Honduran Population in Illinois?
Spillertown has the Highest Percentage of Honduran Population in Illinois with 12.70%.
What is the Percentage of Honduran Population in the State of Illinois?
Percentage of Honduran Population in Illinois is 0.14%.
What is the Percentage of Honduran Population in the United States?
Percentage of Honduran Population in the United States is 0.32%.