Cities with the Highest Percentage of Hawaiian / Pacific Population in Arizona
RELATED REPORTS & OPTIONS
Hawaiian / Pacific
Arizona
Compare Cities
Map of Cities with the Highest Percentage of Hawaiian / Pacific Population in Arizona
0.0%
15.0%
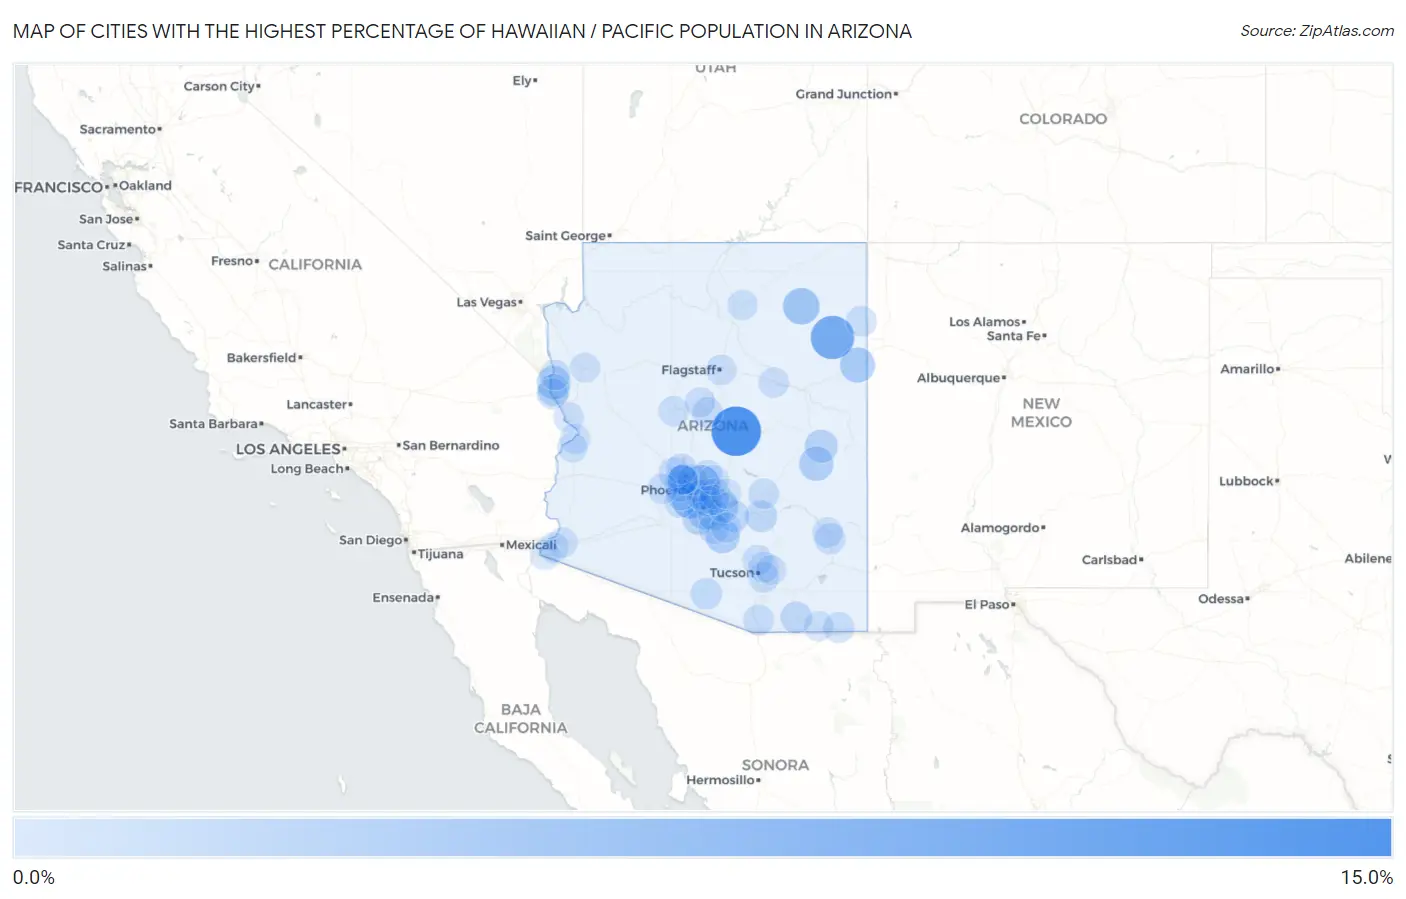
Cities with the Highest Percentage of Hawaiian / Pacific Population in Arizona
| City | Hawaiian / Pacific | vs State | vs National | |
| 1. | East Verde Estates | 10.1% | 0.20% (+9.87)#1 | 0.19% (+9.88)#93 |
| 2. | Cornfields | 6.8% | 0.20% (+6.56)#2 | 0.19% (+6.57)#147 |
| 3. | Red Lake | 3.7% | 0.20% (+3.54)#3 | 0.19% (+3.54)#250 |
| 4. | Paradise Valley | 3.6% | 0.20% (+3.37)#4 | 0.19% (+3.38)#263 |
| 5. | Komatke | 3.3% | 0.20% (+3.15)#5 | 0.19% (+3.16)#277 |
| 6. | Pinon | 3.2% | 0.20% (+3.04)#6 | 0.19% (+3.05)#285 |
| 7. | Houck | 2.4% | 0.20% (+2.25)#7 | 0.19% (+2.26)#363 |
| 8. | Whiteriver | 2.0% | 0.20% (+1.83)#8 | 0.19% (+1.84)#424 |
| 9. | Casa Blanca | 2.0% | 0.20% (+1.83)#9 | 0.19% (+1.83)#425 |
| 10. | Eloy | 1.9% | 0.20% (+1.74)#10 | 0.19% (+1.75)#444 |
| 11. | Fort Mohave | 1.7% | 0.20% (+1.51)#11 | 0.19% (+1.52)#503 |
| 12. | Mcnary | 1.4% | 0.20% (+1.23)#12 | 0.19% (+1.24)#571 |
| 13. | Maricopa | 1.1% | 0.20% (+0.941)#13 | 0.19% (+0.949)#679 |
| 14. | El Mirage | 0.96% | 0.20% (+0.762)#14 | 0.19% (+0.771)#762 |
| 15. | Kearny | 0.90% | 0.20% (+0.706)#15 | 0.19% (+0.714)#805 |
| 16. | Mohave Valley | 0.84% | 0.20% (+0.648)#16 | 0.19% (+0.656)#849 |
| 17. | Youngtown | 0.83% | 0.20% (+0.634)#17 | 0.19% (+0.642)#860 |
| 18. | Sierra Vista | 0.78% | 0.20% (+0.584)#18 | 0.19% (+0.592)#914 |
| 19. | Sells | 0.66% | 0.20% (+0.464)#19 | 0.19% (+0.472)#1,050 |
| 20. | Florence | 0.62% | 0.20% (+0.420)#20 | 0.19% (+0.428)#1,096 |
| 21. | Tempe | 0.56% | 0.20% (+0.364)#21 | 0.19% (+0.373)#1,161 |
| 22. | Queen Creek | 0.51% | 0.20% (+0.315)#22 | 0.19% (+0.323)#1,233 |
| 23. | Sacaton | 0.48% | 0.20% (+0.282)#23 | 0.19% (+0.290)#1,288 |
| 24. | Arizona Village | 0.48% | 0.20% (+0.279)#24 | 0.19% (+0.287)#1,297 |
| 25. | Swift Trail Junction | 0.38% | 0.20% (+0.182)#25 | 0.19% (+0.190)#1,499 |
| 26. | Sawmill | 0.38% | 0.20% (+0.181)#26 | 0.19% (+0.189)#1,501 |
| 27. | Douglas | 0.37% | 0.20% (+0.177)#27 | 0.19% (+0.185)#1,510 |
| 28. | Camp Verde | 0.37% | 0.20% (+0.174)#28 | 0.19% (+0.182)#1,519 |
| 29. | Litchfield Park | 0.37% | 0.20% (+0.171)#29 | 0.19% (+0.179)#1,530 |
| 30. | Rio Rico | 0.34% | 0.20% (+0.144)#30 | 0.19% (+0.152)#1,613 |
| 31. | Miami | 0.30% | 0.20% (+0.099)#31 | 0.19% (+0.107)#1,743 |
| 32. | Goodyear | 0.28% | 0.20% (+0.082)#32 | 0.19% (+0.090)#1,812 |
| 33. | Avondale | 0.25% | 0.20% (+0.057)#33 | 0.19% (+0.065)#1,918 |
| 34. | Tucson | 0.25% | 0.20% (+0.050)#34 | 0.19% (+0.058)#1,938 |
| 35. | Casa Grande | 0.23% | 0.20% (+0.035)#35 | 0.19% (+0.043)#1,999 |
| 36. | Guadalupe | 0.21% | 0.20% (+0.009)#36 | 0.19% (+0.017)#2,099 |
| 37. | Flagstaff | 0.20% | 0.20% (+0.003)#37 | 0.19% (+0.011)#2,132 |
| 38. | Phoenix | 0.20% | 0.20% (+0.001)#38 | 0.19% (+0.009)#2,141 |
| 39. | Mesa | 0.20% | 0.20% (+0.000)#39 | 0.19% (+0.008)#2,146 |
| 40. | Winslow | 0.19% | 0.20% (-0.007)#40 | 0.19% (+0.001)#2,178 |
| 41. | Surprise | 0.19% | 0.20% (-0.009)#41 | 0.19% (-0.001)#2,188 |
| 42. | Scottsdale | 0.19% | 0.20% (-0.010)#42 | 0.19% (-0.002)#2,191 |
| 43. | San Tan Valley | 0.18% | 0.20% (-0.013)#43 | 0.19% (-0.005)#2,204 |
| 44. | Sun City | 0.18% | 0.20% (-0.019)#44 | 0.19% (-0.011)#2,240 |
| 45. | Peoria | 0.17% | 0.20% (-0.023)#45 | 0.19% (-0.015)#2,261 |
| 46. | Thatcher | 0.17% | 0.20% (-0.026)#46 | 0.19% (-0.018)#2,278 |
| 47. | Chandler | 0.17% | 0.20% (-0.029)#47 | 0.19% (-0.021)#2,291 |
| 48. | Buckeye | 0.16% | 0.20% (-0.036)#48 | 0.19% (-0.028)#2,342 |
| 49. | Catalina Foothills | 0.15% | 0.20% (-0.043)#49 | 0.19% (-0.034)#2,382 |
| 50. | Prescott | 0.15% | 0.20% (-0.049)#50 | 0.19% (-0.041)#2,415 |
| 51. | Bullhead City | 0.14% | 0.20% (-0.053)#51 | 0.19% (-0.044)#2,436 |
| 52. | Oro Valley | 0.13% | 0.20% (-0.067)#52 | 0.19% (-0.059)#2,528 |
| 53. | Verde Village | 0.12% | 0.20% (-0.072)#53 | 0.19% (-0.064)#2,557 |
| 54. | Lake Havasu City | 0.12% | 0.20% (-0.073)#54 | 0.19% (-0.065)#2,566 |
| 55. | Tuba City | 0.096% | 0.20% (-0.101)#55 | 0.19% (-0.093)#2,775 |
| 56. | Coolidge | 0.085% | 0.20% (-0.112)#56 | 0.19% (-0.104)#2,861 |
| 57. | Fortuna Foothills | 0.080% | 0.20% (-0.117)#57 | 0.19% (-0.109)#2,901 |
| 58. | Glendale | 0.076% | 0.20% (-0.121)#58 | 0.19% (-0.113)#2,931 |
| 59. | Cienega Springs | 0.069% | 0.20% (-0.127)#59 | 0.19% (-0.119)#2,998 |
| 60. | Gilbert | 0.061% | 0.20% (-0.135)#60 | 0.19% (-0.127)#3,085 |
| 61. | Parker | 0.060% | 0.20% (-0.137)#61 | 0.19% (-0.129)#3,105 |
| 62. | Tanque Verde | 0.054% | 0.20% (-0.143)#62 | 0.19% (-0.135)#3,167 |
| 63. | Yuma | 0.044% | 0.20% (-0.153)#63 | 0.19% (-0.145)#3,280 |
| 64. | Fountain Hills | 0.042% | 0.20% (-0.155)#64 | 0.19% (-0.147)#3,300 |
| 65. | San Luis | 0.034% | 0.20% (-0.163)#65 | 0.19% (-0.155)#3,390 |
| 66. | Apache Junction | 0.031% | 0.20% (-0.166)#66 | 0.19% (-0.158)#3,431 |
| 67. | Bisbee | 0.020% | 0.20% (-0.177)#67 | 0.19% (-0.169)#3,587 |
| 68. | Kingman | 0.0030% | 0.20% (-0.194)#68 | 0.19% (-0.186)#3,795 |
Common Questions
What are the Top 10 Cities with the Highest Percentage of Hawaiian / Pacific Population in Arizona?
Top 10 Cities with the Highest Percentage of Hawaiian / Pacific Population in Arizona are:
#1
10.1%
#2
6.8%
#3
3.6%
#4
3.3%
#5
3.2%
#6
2.4%
#7
2.0%
#8
2.0%
#9
1.9%
#10
1.7%
What city has the Highest Percentage of Hawaiian / Pacific Population in Arizona?
East Verde Estates has the Highest Percentage of Hawaiian / Pacific Population in Arizona with 10.1%.
What is the Percentage of Hawaiian / Pacific Population in the State of Arizona?
Percentage of Hawaiian / Pacific Population in Arizona is 0.20%.
What is the Percentage of Hawaiian / Pacific Population in the United States?
Percentage of Hawaiian / Pacific Population in the United States is 0.19%.